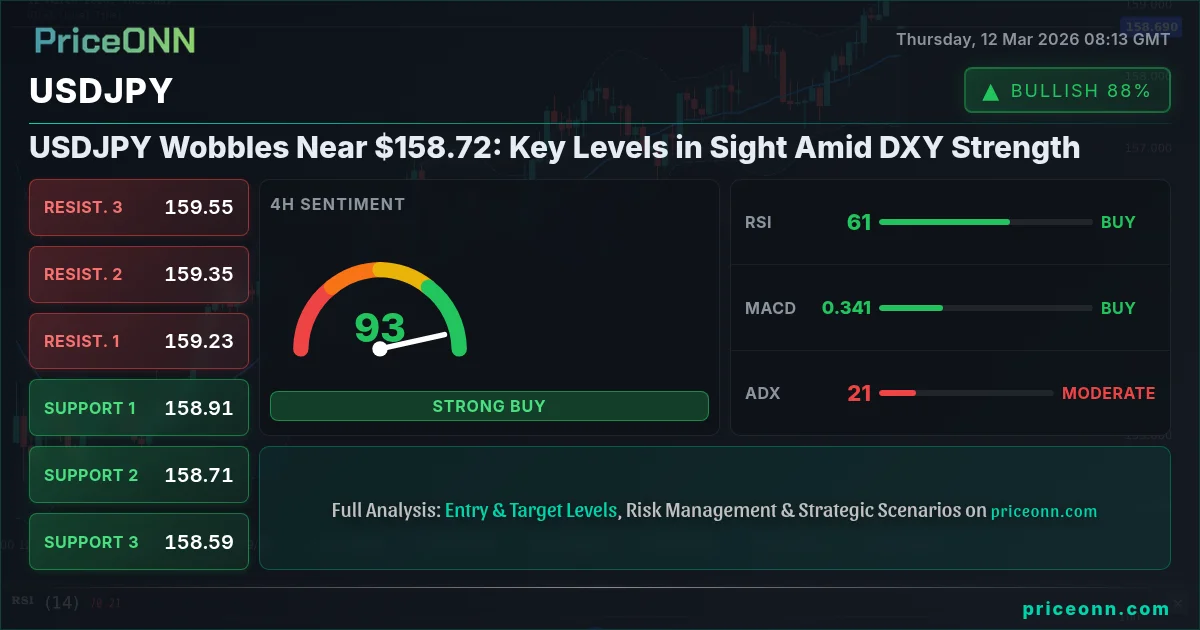
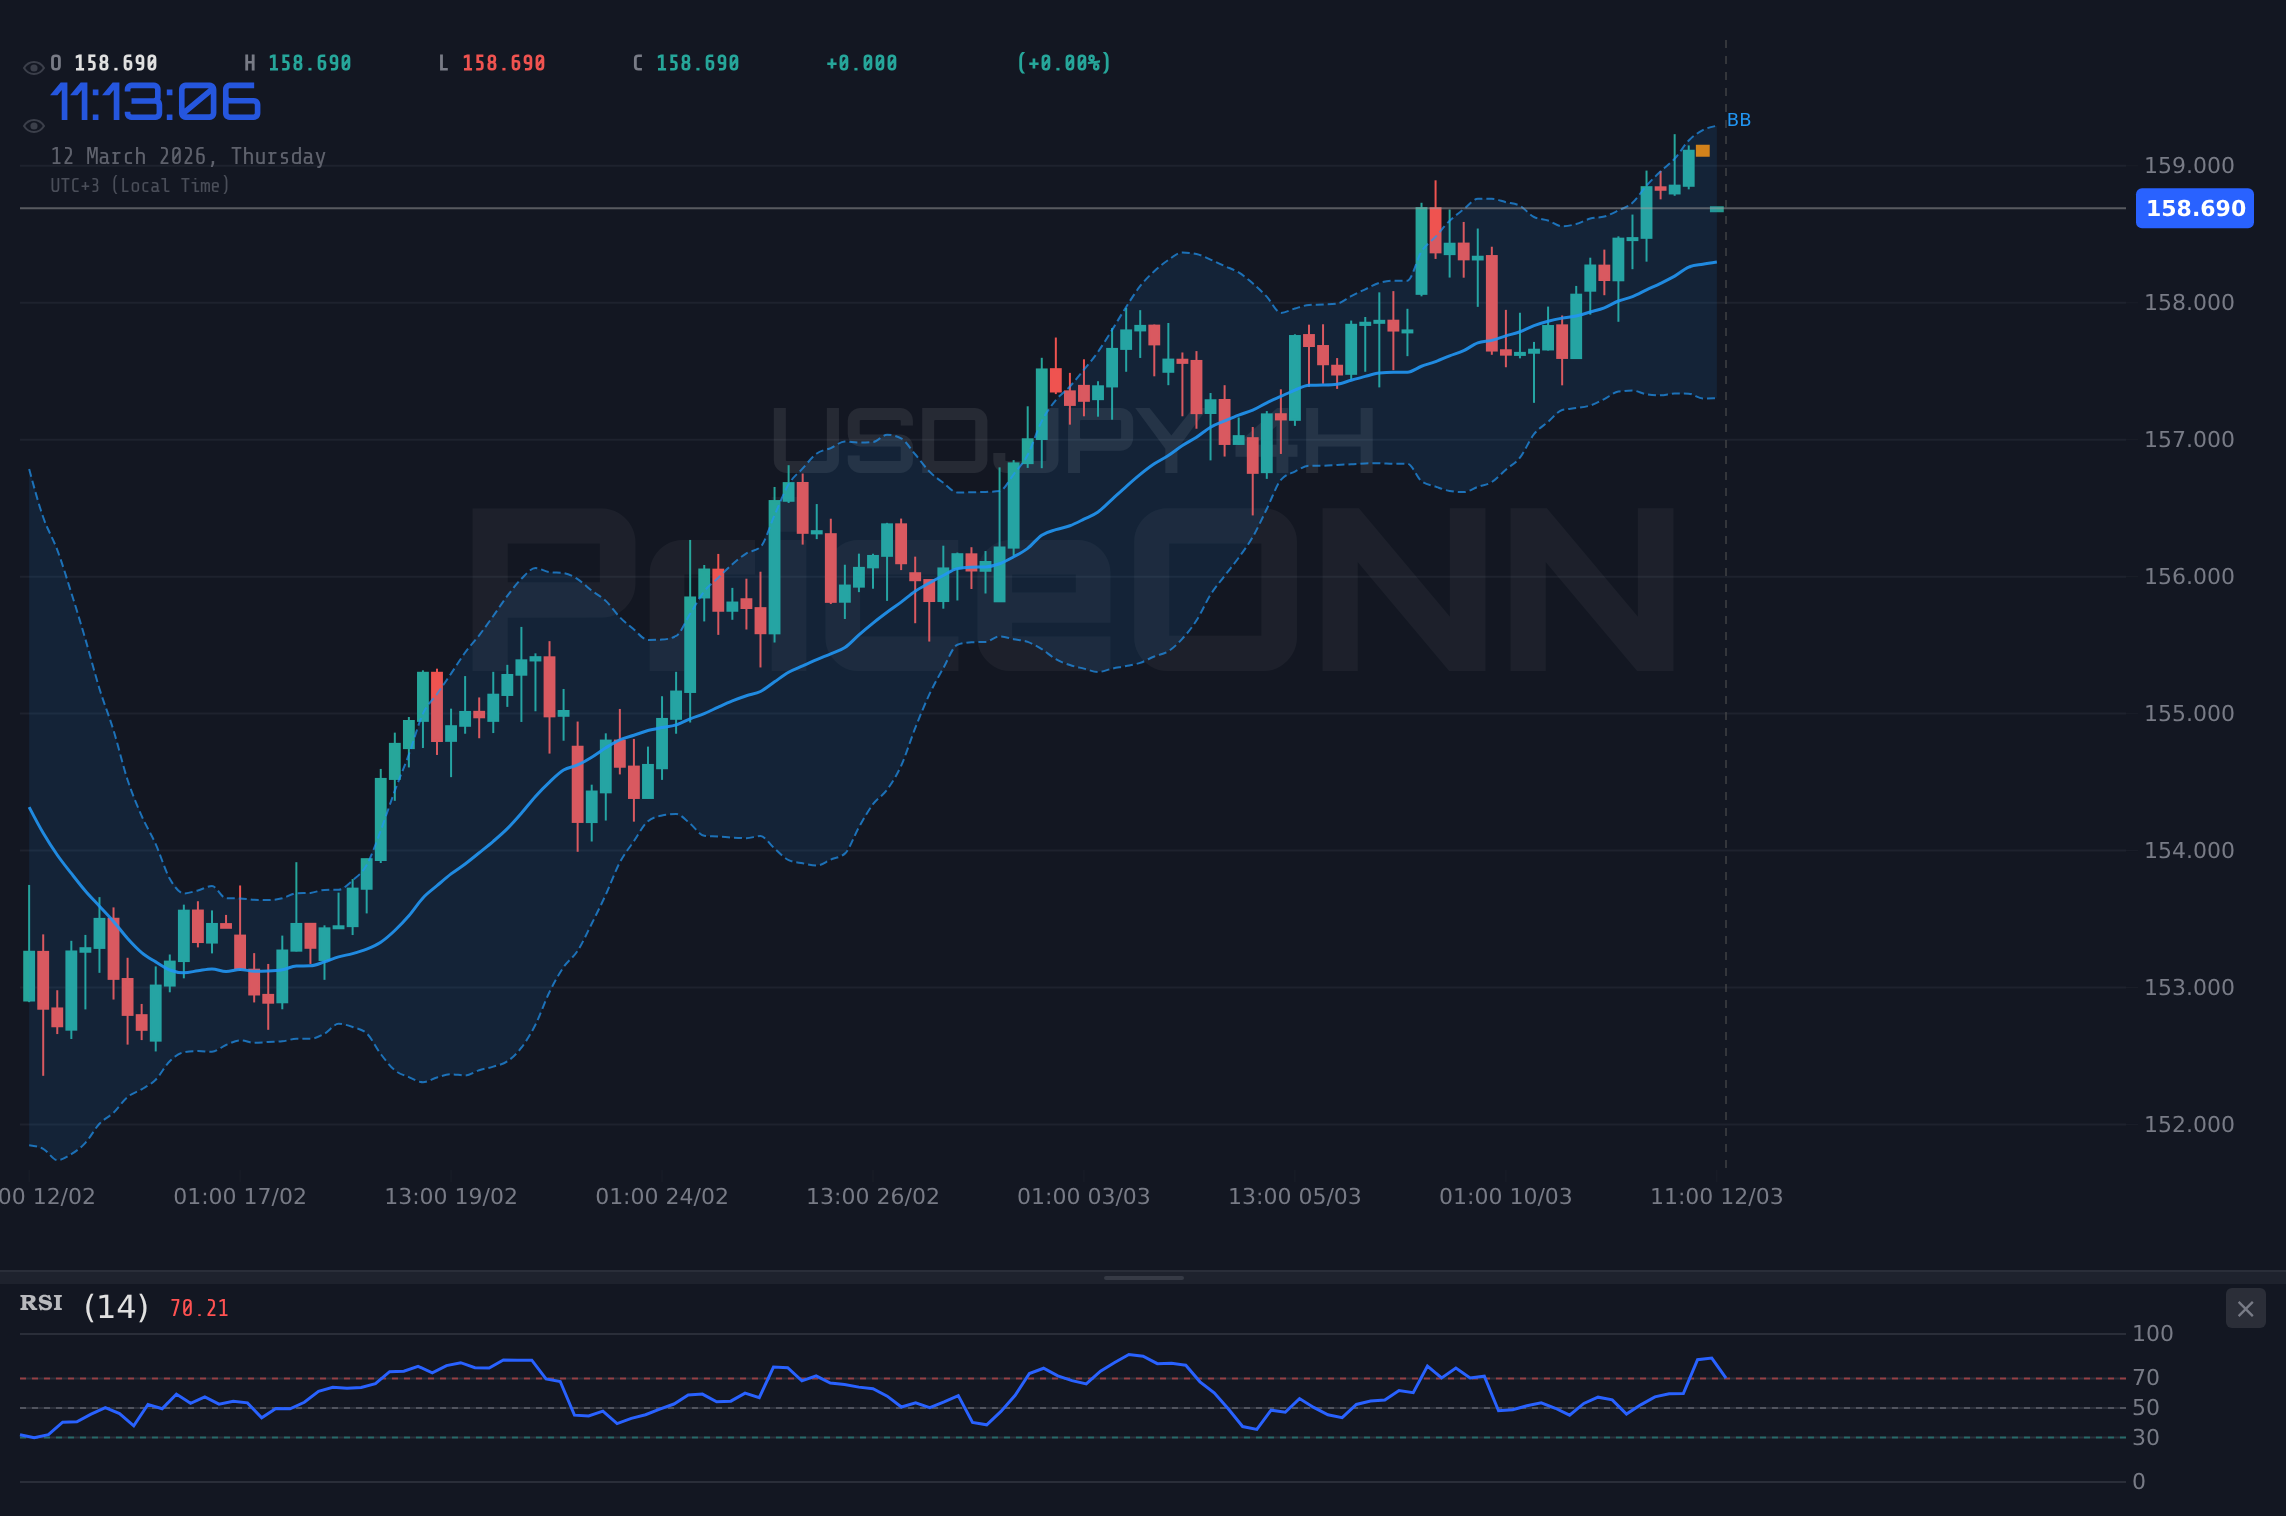
USDJPY is trading near $158.72, a level that's proving to be a key battleground between bulls and bears. With the dollar index (DXY) showing strength, the pair is under pressure, and traders are closely watching for a breakout or breakdown from this consolidation zone.
- RSI at 49.4 on the 1H chart suggests neutral momentum, but leaning bearish.
- Key support sits at 158.68, tested multiple times in the last 4 hours.
- MACD histogram shows negative momentum, indicating bearish pressure.
- Strong DXY performance is driving USDJPY correlation, placing downward pressure on the pair.
The Bull's Roadmap: A Break Above $159.13
For the bulls to regain control, USDJPY needs to decisively break above the resistance level of 159.13 on the 4H chart. A sustained move above this level could signal a shift in momentum and open the door for a test of higher targets. The 4H RSI at 63.25, while neutral, suggests there is room for further upside if the bullish momentum picks up. The MACD histogram is positive, further supporting this potential bullish scenario. However, the Stochastic K=79.77 and D=87.44 indicates that the pair is nearing overbought conditions, so the bullish move needs to be swift and decisive to avoid a reversal.
If USDJPY manages to clear 159.13, the next target for the bulls would be 159.406, followed by 159.58. This bullish scenario is likely to play out within the next week, assuming risk appetite remains positive and the dollar index doesn't strengthen significantly further. Keep an eye on upcoming economic data releases, particularly the USD data scheduled for Friday, which could act as a catalyst for a breakout.
Where Bears Take Control: A Close Below $158.68
The bears are currently in a favorable position, with the daily trend leaning bearish. For the bearish scenario to unfold, USDJPY needs to break below the immediate support level of 158.68 on the 4H chart. A sustained move below this level could trigger a wave of selling pressure and push the pair towards lower targets. The 1H RSI at 49.4 is leaning bearish, and the MACD histogram is negative, supporting this potential bearish scenario. The ADX at 15.38 on the 1H chart indicates a weak trend, so a breakout needs to be confirmed by a surge in volume and momentum.
If USDJPY breaks below 158.68, the next target for the bears would be 158.506, followed by 158.23. This bearish scenario is likely to play out within the next few days, especially if risk aversion increases and the dollar index continues to strengthen. Watch out for the GBP data scheduled for Friday, which could indirectly influence USDJPY via cross-currency movements.
The Waiting Game: Stuck Between $158.68 and $159.13
If neither the bulls nor the bears manage to gain a decisive advantage, USDJPY could remain range-bound between the support level of 158.68 and the resistance level of 159.13. This neutral scenario is characterized by indecision and sideways price action. The 1H ADX at 15.38 and the 1D ADX at 19.78 both indicate a weak trend, suggesting that a sustained breakout or breakdown is unlikely in the near term. The Stochastic on the 1H chart shows a K value of 33.45 and a D value of 52.53, indicating bearish sentiment, but the lack of a strong trend suggests that the downside potential is limited.
In this neutral scenario, traders should exercise caution and avoid taking aggressive positions. Look for range-bound trading opportunities, buying near support and selling near resistance. The time horizon for this scenario is likely to be intraday to a few days, as the market awaits a catalyst to break the consolidation. Keep an eye on the SP500, as risk sentiment can play a key role in breaking the stalemate.
Most Likely Scenario: Bearish Pressure with Potential for Range-Bound Consolidation (50% Probability)
Considering the current technical picture and the strength of the dollar index, the most likely scenario is bearish pressure with potential for range-bound consolidation. The bearish signals on the 1H and 4H charts, combined with the strong dollar, suggest that USDJPY is likely to test lower levels in the near term. However, the weak trend indicated by the ADX and the proximity of the support level at 158.68 suggest that a sustained breakdown is not guaranteed. Therefore, a 50% probability is assigned to this scenario.
The bullish scenario is assigned a 30% probability, as it requires a significant shift in market sentiment and a weakening of the dollar index. The neutral scenario is assigned a 20% probability, as it is dependent on the market remaining indecisive and lacking a clear catalyst for a breakout or breakdown.
Key Triggers to Watch This Week
Traders should keep a close eye on the following triggers this week:
- Breakout or breakdown from the 158.68-159.13 range: A decisive move outside this range could signal the start of a new trend.
- USD data releases on Friday: These data releases could act as a catalyst for a breakout or breakdown, depending on the results.
- GBP data releases on Friday: These data releases could indirectly influence USDJPY via cross-currency movements.
IF price breaks above 159.13 THEN target 159.406, 159.58. Conditions: Positive risk appetite, weaker DXY. Time horizon: Next week.
IF price breaks below 158.68 THEN target 158.506, 158.23. Conditions: Increased risk aversion, stronger DXY. Time horizon: Next few days.
Technical Outlook Summary
| Indicator | Value | Signal |
|---|---|---|
| RSI (14) | 49.4 | Neutral |
| MACD Histogram | Negative | Bearish |
| Stochastic | 33.45/52.53 | Bearish |
| ADX | 15.38 | Weak Trend |
| Bollinger | Middle Band | Watch |
Key Levels
Support Levels
Resistance Levels
Frequently Asked Questions: USDJPY Analysis
What happens if USDJPY breaks above $159.13 resistance?
If USDJPY breaks above the 159.13 resistance, it could signal a shift in momentum and open the door for a test of higher targets like 159.406 and 159.58. The 4H RSI at 63.25 supports this potential bullish scenario.
Should I buy USDJPY at current levels of $158.72 given the DXY strength?
Given the strength of the DXY, buying USDJPY at current levels carries risk. It's prudent to wait for a clear breakout above 159.13 or a pullback to support at 158.68 before making a decision. Manage your risk and wait for your setup- the market always gives a second chance.
Is RSI at 49.4 a sell signal for USDJPY right now?
An RSI of 49.4 on the 1H chart suggests neutral momentum, but leaning bearish. While not a definitive sell signal, it indicates that the bulls are not in control, and bearish pressure could increase if the pair breaks below support at 158.68.
How will the USD data releases on Friday affect USDJPY this week?
The USD data releases on Friday could act as a catalyst for a breakout or breakdown in USDJPY, depending on the results. Stronger-than-expected data could strengthen the dollar and push USDJPY lower, while weaker-than-expected data could weaken the dollar and allow USDJPY to rally.
Track markets in real-time
AI-powered analysis, technical indicators and real-time price data.
Join Our Telegram Channel
Breaking market news, AI analysis and trading signals instantly.
Join Channel