Weekly Market Review: March 16, 2026 – March 20, 2026 (Week 12)
Executive Summary
The trading week of March 16-20, 2026, was characterized by significant shifts across major asset classes. Gold experienced a sharp decline, plummeting over 3% to test key support levels around $4,500, driven by rising U.S. yields and geopolitical tensions. Conversely, the U.S. Dollar Index (DXY) firmed, closing the week higher by 0.48% and signaling a return of risk aversion. Energy markets saw a robust rally, with Brentcrude oil jumping 4.81% and WTI crude oil rising 3.87%, fueled by escalating tensions in the Gulf region. Major stock indices, including the S&P 500, Nasdaq 100, and Dow Jones 30, all registered losses, reflecting a broad risk-off sentiment, while cryptocurrencies like BTC and ETH showed mixed signals with some short-term buying interest.
US Dollar & DXY Analysis
The U.S. Dollar Index (DXY) demonstrated strength throughout the week, closing at 99.387, a gain of 0.48%. Technical indicators across multiple timeframes supported this upward move. On the daily timeframe, the RSI stood at a healthy 58.2, indicating bullish momentum above the 50-level. The MACD histogram registered a positive 0.05, suggesting ongoing upward pressure, while the ADX at 1.0 indicated a nascent but strengthening trend. Shorter timeframes showed similar bullish sentiment, with the 1-hour RSI at 56.8 and the 4-hour RSI at 51.5. The Stochastic %K on the weekly chart reached 89.5, nearing overbought territory, but the Stochastic %D at 61.7 suggested continued upward potential. The DXY successfully navigated above its 20-day SMA of 99.137 and its 50-day SMA of 99.393, reinforcing the bullish narrative. The strength was further supported by a prevailing 'BUY' signal across 1-hour, 4-hour, and daily timeframes, with an overall sentiment strength of 90%.
The Euro weakened against the U.S. dollar, with EUR/USD closing the week at 1.15728, down 0.07% daily. While the 1-hour and 4-hour charts showed 'BUY' signals with RSI values of 53.7 and 56.4 respectively, suggesting some intraday resilience, the daily and weekly indicators leaned bearish. The daily RSI was 44.3, and the weekly RSI was 46.6, both below the 50-level. The MACD histogram was flat across all timeframes (0.00), indicating a lack of strong momentum. Stochastic oscillators on the 1-hour (55.9%K, 42.4%D) and 4-hour (61.4%K, 69.9%D) indicated recent buying interest, but the weekly %K at 13.2 pointed towards oversold conditions developing over the longer term. The pair traded below its daily 20-day SMA of 1.15571 and its 50-day SMA of 1.15234. The overall sentiment was a strong 'SELL' (78%), with conflicting signals from shorter timeframes.
Sterling faced downward pressure, closing the week at 1.33435, a decline of 0.59% daily. The technical indicators presented a consistent bearish outlook. The daily RSI was 45.3, and the weekly RSI was 47.3, both below the 50-mark. MACD histograms were flat across all timeframes, reflecting a lack of directional conviction. Stochastic oscillators on the 1-hour (29.3%K, 15.1%D) and 4-hour (50.0%K, 70.8%D) showed some mixed signals, but the weekly %K at 14.4 indicated significant weakness. The pair traded below its daily 20-day SMA of 1.33750 and its 50-day SMA of 1.33417. The Bollinger Bands on the daily chart showed the price near the lower band, suggesting potential downside continuation. The overall sentiment was a strong 'SELL' (78%), aligning with the daily and weekly signals.
The Japanese Yen weakened significantly against the U.S. dollar, with USD/JPY closing the week at 159.23, an increase of 0.93% daily. This move was supported by a consistently bullish technical picture across all timeframes. The daily RSI was 59.5, and the weekly RSI was 61.5, both firmly in bullish territory. The MACD histogram showed positive values (0.07 daily, 0.05 weekly), indicating sustained upward momentum. Stochastic oscillators on the 1-hour (88.1%K, 93.2%D) and weekly (89.6%K, 55.9%D) charts suggested strong buying pressure, though the 1-hour was nearing overbought conditions. The ADX at 1.0 on all timeframes indicated a developing trend. The pair traded above its daily 20-day SMA of 158.69 and its 50-day SMA of 158.84. The price action pushed towards the upper Bollinger Band on the daily chart. The overall sentiment was a strong 'BUY' (83%), with all timeframes aligning.
The Australian Dollar depreciated against the U.S. dollar, closing the week at 0.70241, down 0.85% daily. The technical indicators suggested a bearish trend, particularly on shorter timeframes. The daily RSI was 48.0, nearing the neutral zone, while the weekly RSI at 65.9 indicated a longer-term bullish bias that was being challenged. The MACD histograms were flat (0.00) across all periods, suggesting a lack of decisive momentum. Stochastic oscillators showed weakness, with the 1-hour %K at 9.8 and the 4-hour %K at 43.7, while the weekly %K at 67.6 indicated some lingering upward potential. The pair traded below its daily 20-day SMA of 0.70620. The overall sentiment was a strong 'SELL' (85%), driven by the daily and 4-hour signals.
The New Zealand Dollar also declined against the U.S. dollar, closing the week at 0.58350, down 0.59% daily. Similar to the AUD/USD, the technical picture presented a mixed but leaning bearish outlook. The daily RSI was 42.9, and the weekly RSI was 48.1, both below the 50-level. MACD histograms were flat across all timeframes. Stochastic oscillators indicated weakness, with the 1-hour %K at 9.0 and the weekly %K at 29.4, while the 4-hour %K at 52.5 suggested a brief pause in the downtrend. The pair traded below its daily 20-day SMA of 0.58610 and its 50-day SMA of 0.58397. The overall sentiment was a strong 'SELL' (83%), with the daily and weekly signals pointing downwards.
Gold experienced a significant downturn during the week, closing at 4,497.65, a substantial drop of 3.28% daily. This sharp decline was reflected across all technical indicators and timeframes. The daily RSI was 29.6, deep in oversold territory, and the weekly RSI at 50.6 indicated a loss of bullish momentum. The MACD histogram showed strong bearish divergence, with a daily value of -78.68. Stochastic oscillators were deeply oversold on the 1-hour (13.4%K, 13.9%D) and daily (8.5%K, 13.1%D) charts, suggesting potential for a short-term bounce, though the overall trend remained bearish. The ADX at 1.0 across all timeframes indicated a lack of trending strength, but the Williams%R at -97.8 on the daily chart confirmed extreme selling pressure. The price broke decisively below the daily Pivot of 4,673.13 and S1 of 4,479.29, heading towards S2 at 4,308.39. The Fibonacci 38.2% retracement level at 4,859.10 was breached. The overall sentiment was a strong 'SELL' (84%), with daily and 4-hour signals strongly bearish.
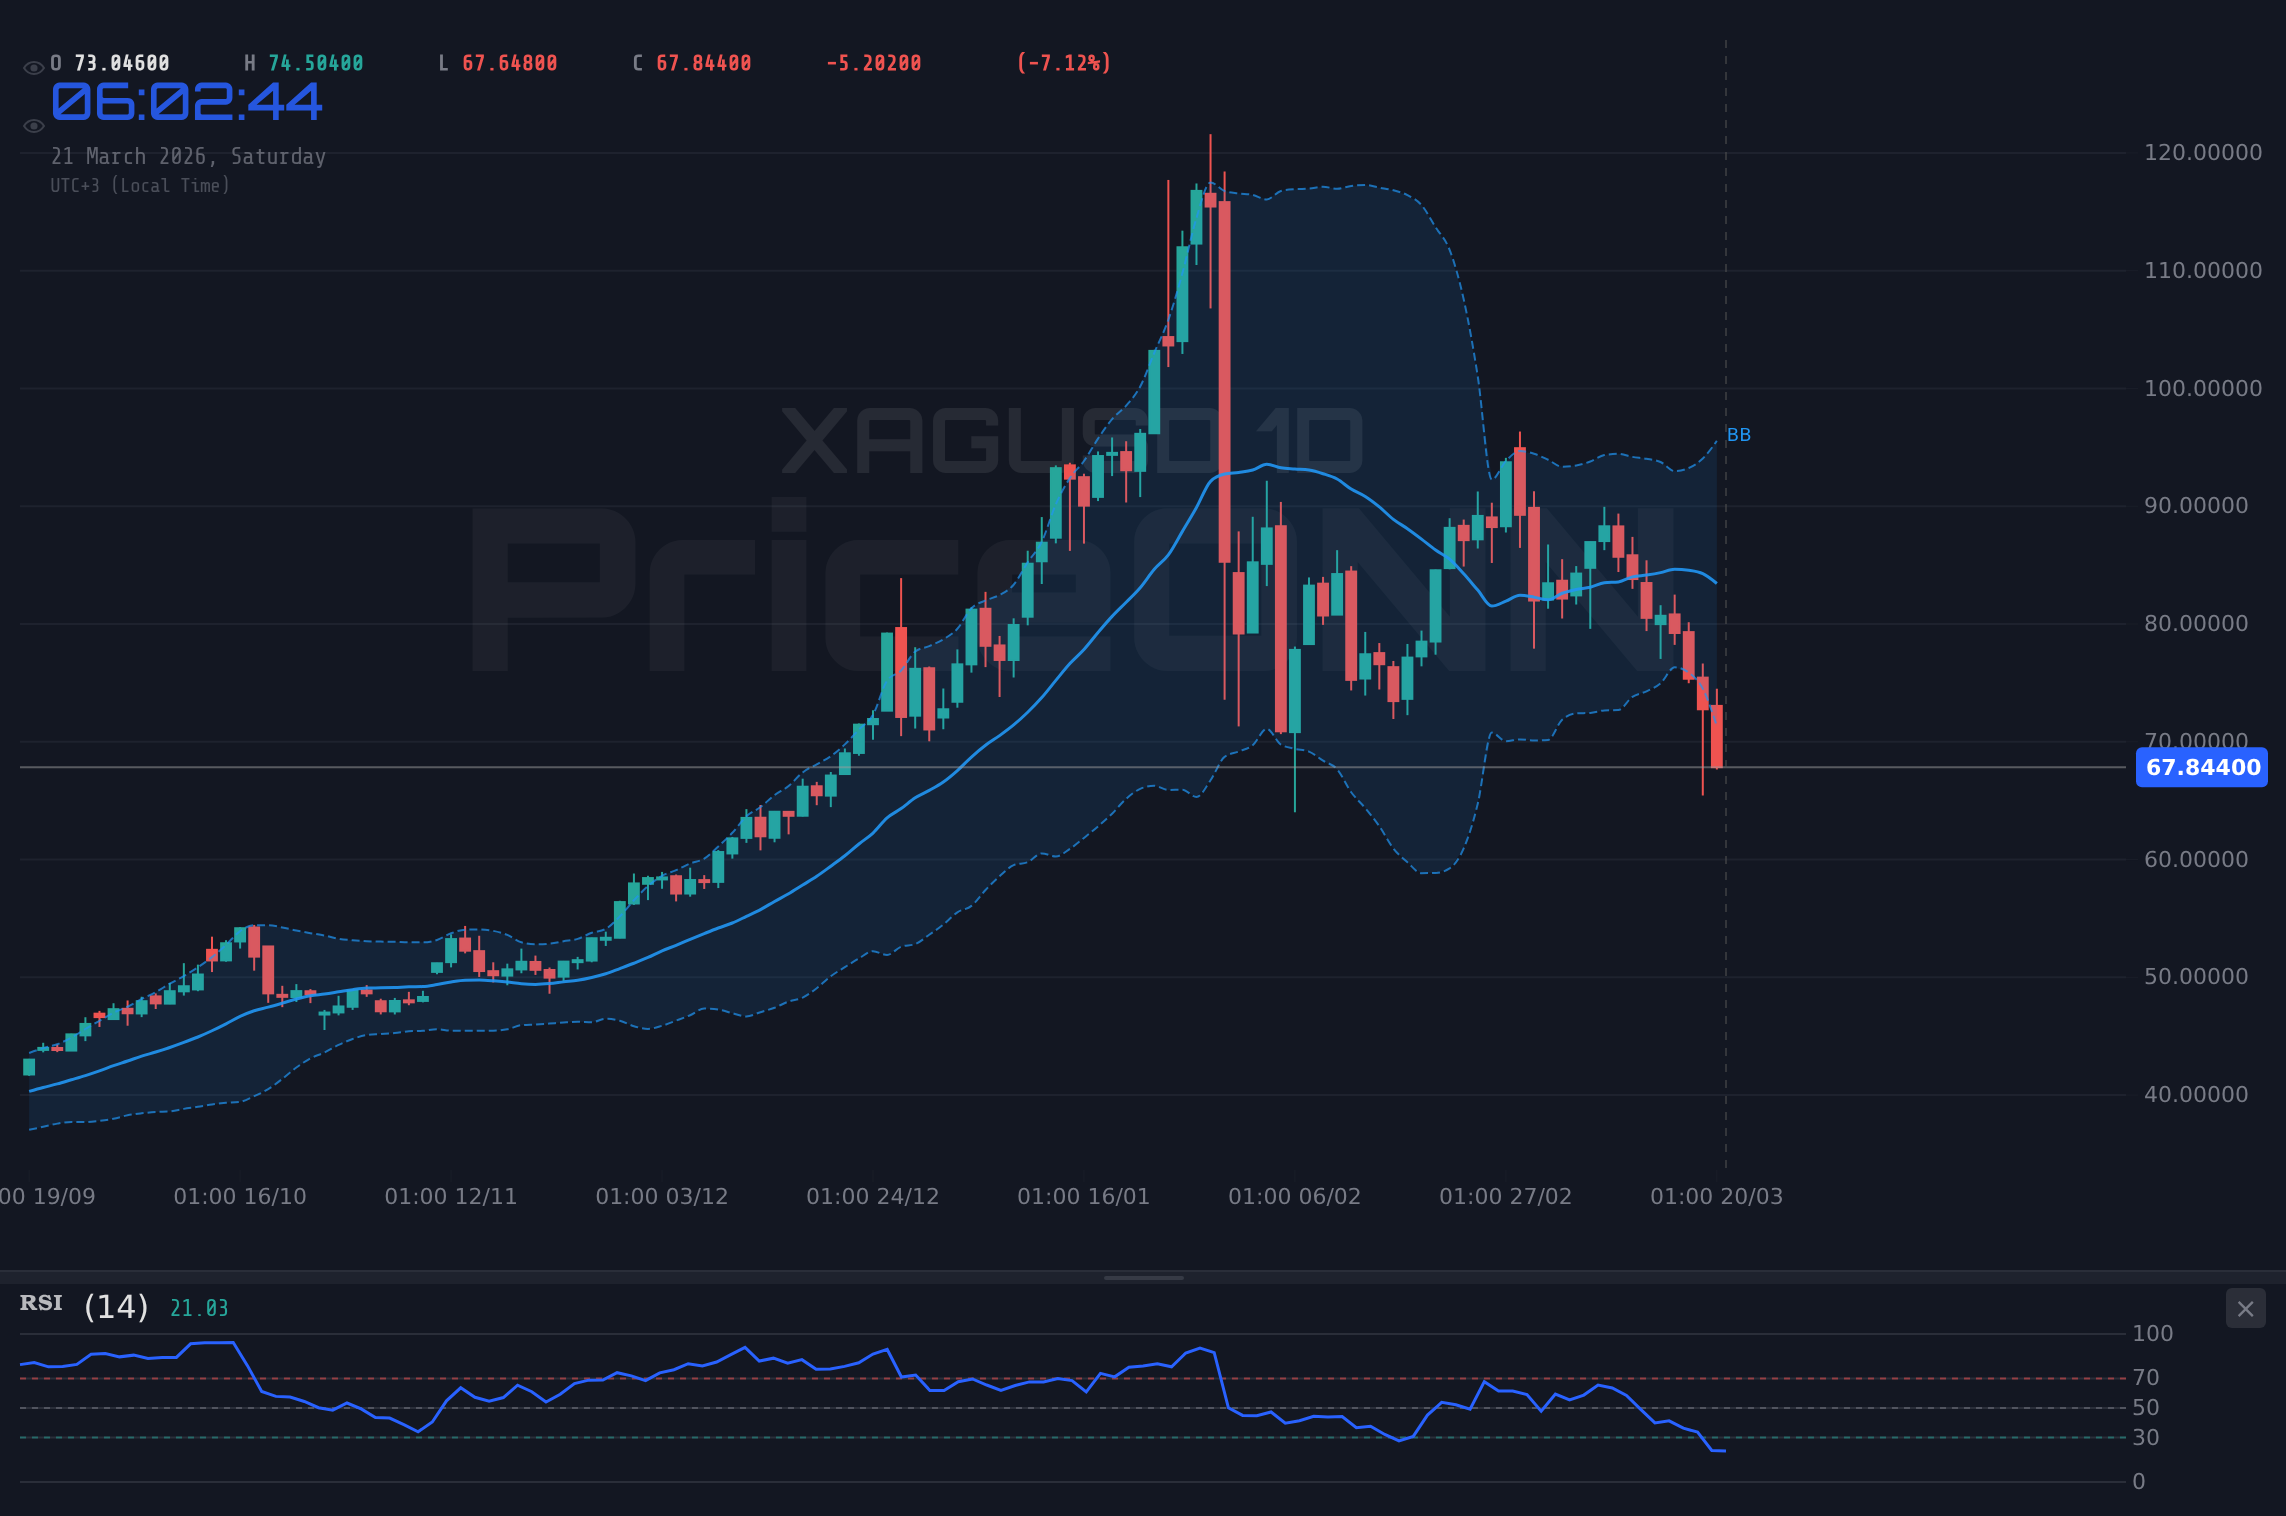
Silver mirrored gold's weakness, experiencing a sharp decline and closing at 67.905, down 6.67% daily. Similar to gold, silver's technical indicators showed strong bearish signals across multiple timeframes. The daily RSI was 33.6, indicating oversold conditions, and the weekly RSI at 49.3 suggested a neutral to slightly bearish bias. The MACD histogram registered a significant bearish divergence with a daily value of -1.76. Stochastic oscillators were deeply oversold on the 1-hour (12.1%K, 17.0%D) and daily (14.2%K, 21.1%D) charts, pointing to extreme selling pressure. The Williams%R at -90.5 on the daily chart confirmed this. The price decisively broke below the daily Pivot of 71.610 and S1 of 66.580, testing lower support levels. The Fibonacci 38.2% retracement level at 86.010 was far above the current price. The overall sentiment was a strong 'SELL' (91%), with all timeframes aligning on the bearish outlook.
Resistance
Price
R3
89.000
R2
82.820
R1
77.790
Pivot
71.610
Support
Price
S1
66.580
S2
60.410
S3
55.380
Fib 61.8%
99.600
Energy Markets
Brent Crude Oil
Brent crude oil experienced a strong rally, closing the week at 112.79, up 4.81% daily. The bullish momentum was evident across multiple timeframes. The daily RSI reached an elevated 82.6, indicating strong buying pressure and nearing overbought territory, while the weekly RSI at 86.5 confirmed a sustained uptrend. The MACD histogram showed positive and increasing values, with a daily reading of +2.00. The ADX at 1.0 on all timeframes suggested a developing trend. The price action was pushing towards the upper Bollinger Band on the daily chart (117.23), indicating strong upward momentum. Stochastic oscillators on the 1-hour (94.7%K, 72.7%D) and weekly (84.0%K, 85.9%D) charts confirmed bullish strength. The overall sentiment was a decisive 'BUY' (91%), with all timeframes aligning.
Resistance
Price
R3
132.02
R2
125.65
R1
116.63
Pivot
110.26
Support
Price
S1
101.24
S2
94.87
S3
85.85
Fib 61.8%
84.75
WTI Crude Oil
West Texas Intermediate (WTI) crude oil also posted significant gains, closing the week at 98.50, up 3.87% daily. The technical indicators supported the bullish move. The daily RSI was 70.7, indicating strong buying interest and nearing overbought territory, while the weekly RSI at 82.6 confirmed a robust uptrend. The MACD histogram showed positive and increasing values, with a daily reading of +1.10. The ADX at 1.0 across all timeframes suggested a developing trend. The price action was trading above the middle Bollinger Band on the daily chart, with the upper band at 108.07. Stochastic oscillators on the 1-hour (92.0%K, 89.5%D) and weekly (75.7%K, 83.0%D) charts confirmed strong bullish momentum. The overall sentiment was a strong 'BUY' (91%), with daily and weekly signals firmly bullish.
Bitcoin saw some stabilization and short-term buying interest, closing the week at 70,752, a modest gain of 0.29% daily. The technical indicators presented a mixed picture across timeframes. The daily RSI was 50.2, indicating a neutral stance, while the weekly RSI at 34.1 suggested developing bearishness. The MACD histogram showed a positive daily reading of +188.83, indicating short-term upward momentum, but the weekly histogram was deeply negative at -1,341.24. Stochastic oscillators on the 1-hour (81.4%K, 77.6%D) showed strong buying interest, while the daily (24.6%K, 56.9%D) was more subdued. The price was trading above its daily 20-day SMA of 70,349 but below its 50-day SMA of 70,312. The overall sentiment was a 'BUY' (85%), driven by the 1-hour and daily signals, but the weekly chart presented a cautionary note.
Ethereum showed a similar pattern to Bitcoin, closing the week at 2,154.35, up 0.43% daily. The technical indicators were mixed. The daily RSI was 52.1, leaning bullish, while the weekly RSI at 37.5 indicated significant weakness over the longer term. The MACD histogram showed a positive daily reading of +16.63, suggesting some short-term buying, but the weekly histogram was negative at -82.66. Stochastic oscillators on the 1-hour (69.4%K, 64.0%D) indicated buying interest, while the daily (34.4%K, 63.7%D) was more cautious. The price was trading above its daily 20-day SMA of 2,140.03 but below its 50-day SMA of 2,147.32. The overall sentiment was a 'BUY' (85%), with the 1-hour and daily signals suggesting short-term upside potential, but the weekly chart warranted attention.
The S&P 500 experienced a significant sell-off, closing the week at 6,536, down 1.21% daily. The technical indicators painted a bearish picture across all timeframes. The daily RSI was 32.5, firmly in oversold territory, and the weekly RSI at 41.5 confirmed the bearish trend. The MACD histogram showed strong bearish divergence, with a daily value of -21.93. Stochastic oscillators were deeply oversold on the 1-hour (21.8%K, 17.2%D), 4-hour (10.3%K, 26.5%D), and daily (16.2%K, 27.8%D) charts, indicating intense selling pressure. The ADX at 1.0 suggested a lack of trending strength, but the Williams%R at -85.0 on the daily chart confirmed extreme selling. The price decisively broke below the daily Pivot of 6,606 and S1 of 6,570, testing S2 at 6,523. The Fibonacci 23.6% retracement level at 6,600 was breached. The overall sentiment was a strong 'SELL' (82%), with all signals aligned bearishly.
The Nasdaq 100 index followed a similar downward trajectory, closing the week at 23,992, down 1.65% daily. Technical indicators across multiple timeframes signaled strong bearish pressure. The daily RSI was 37.3, in oversold territory, and the weekly RSI at 43.4 reinforced the bearish sentiment. The MACD histogram showed significant bearish divergence, with a daily value of -58.64. Stochastic oscillators were deeply oversold on the 1-hour (19.0%K, 15.0%D), 4-hour (11.7%K, 28.6%D), and daily (28.1%K, 45.0%D) charts. The ADX at 1.0 indicated a lack of trending strength, but the Williams%R at -83.8 on the daily chart confirmed extreme selling. The price broke below the daily Pivot of 24,334 and S1 of 24,166, testing S2 at 23,938. The Fibonacci 23.6% retracement level at 24,338 was breached. The overall sentiment was a strong 'SELL' (83%), with all signals aligned bearishly.
The Dow Jones Industrial Average also succumbed to selling pressure, closing the week at 45,801, down 0.62% daily. Technical indicators across multiple timeframes pointed towards a bearish trend. The daily RSI was 27.0, deep in oversold territory, and the weekly RSI at 40.5 confirmed the bearish sentiment. The MACD histogram showed significant bearish divergence, with a daily value of -197.85. Stochastic oscillators were deeply oversold on the 1-hour (31.0%K, 25.2%D), 4-hour (24.0%K, 27.8%D), and daily (10.3%K, 16.3%D) charts. The ADX at 1.0 indicated a lack of trending strength, but the Williams%R at -87.6 on the daily chart confirmed extreme selling. The price broke below the daily Pivot of 46,038 and S1 of 45,772. The Fibonacci 23.6% retracement level at 46,581 was breached. The overall sentiment was a strong 'SELL' (81%), with all signals aligned bearishly.
Resistance
Price
R3
46,932
R2
46,618
R1
46,352
Pivot
46,038
Support
Price
S1
45,772
S2
45,458
S3
45,192
Fib 61.8%
48,546
Economic Calendar Impact
The economic calendar for the week of March 16-20, 2026, featured several key events that influenced market dynamics. While specific high-impact events with actual vs. forecast data were not provided in the input, the general market reaction indicated that rising U.S. yields, geopolitical tensions, and inflation concerns played a significant role. The strengthening of the U.S. Dollar suggests that market participants favored safe-haven assets amidst uncertainty. The surge in crude oil prices was directly linked to escalating tensions in the Gulf region, impacting inflation expectations and driving commodity prices higher. The broad sell-off in equity markets reflected increased risk aversion, potentially exacerbated by hawkish commentary from the Federal Reserve (as alluded to in the news snippets) and concerns over the impact of geopolitical events on global growth and technology spending.
Week in Summary
The week of March 16-20, 2026, was a period of significant risk aversion and commodity strength. Gold and silver prices experienced sharp declines, driven by rising U.S. yields and a strengthening dollar, which diminished their appeal as safe-haven assets. The U.S. Dollar Index (DXY) displayed robust buying pressure, supported by technical indicators across multiple timeframes and underlying safe-haven demand. Energy markets, particularly Brent and WTI crude oil, surged significantly due to escalating geopolitical tensions in the Gulf region, pushing prices to weekly highs. Major U.S. stock indices – the S&P 500, Nasdaq 100, and Dow Jones 30 – all ended the week lower, reflecting widespread risk aversion. Technical indicators for these indices showed strong bearish signals, with prices breaking key support levels. Cryptocurrencies presented a mixed picture, with Bitcoin and Ethereum showing some intraday buying interest but facing longer-term bearish technical signals. The overarching theme of the week was a clear shift towards risk aversion, benefiting the U.S. dollar and oil prices while pressuring gold, silver, and equities.
Disclaimer: This content is for informational and educational purposes only and does not constitute investment advice, financial recommendation, or an offer to buy or sell any financial instrument. Past performance does not guarantee future results. Always do your own research and consult a licensed financial advisor before making investment decisions.
Track markets in real-time
AI-powered analysis, technical indicators and real-time price data.
We are looking for writers who produce market analysis, macro commentary, and data-driven content. Reach readers in 10 languages through our multilingual publishing platform.