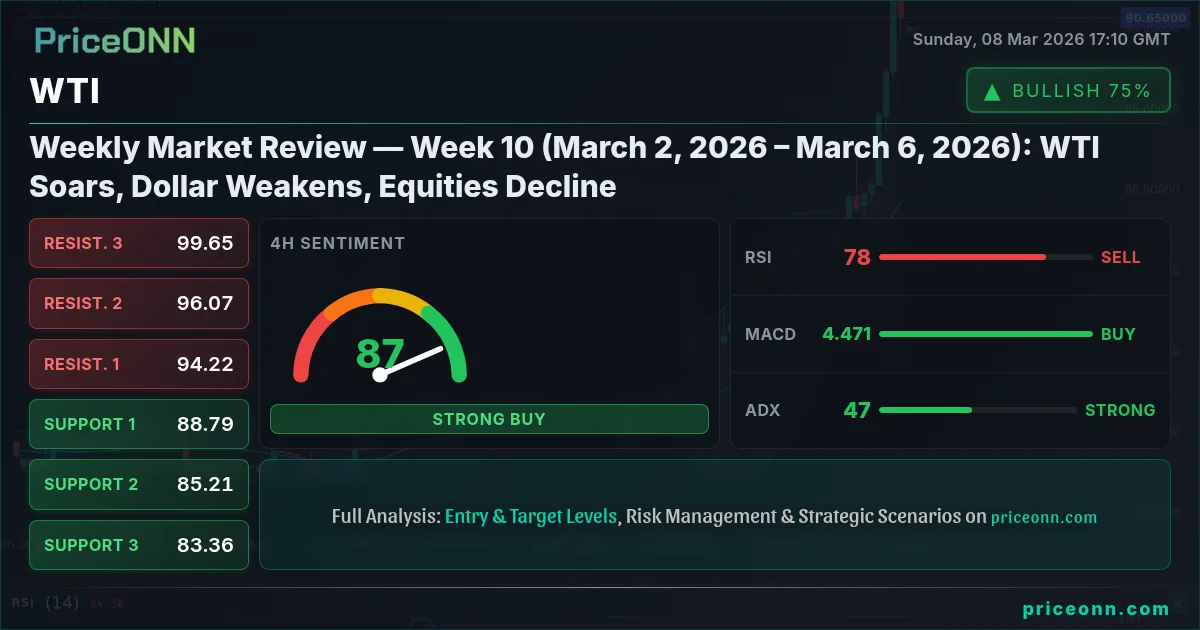
Weekly Market Review - Week 10 (March 2, 2026 – March 6, 2026): WTI Soars, Dollar Weakens, Equities Decline
Week 10 (March 2, 2026 – March 6, 2026) saw WTI soar 15.02%, DXY weaken, and equities decline. Gold rose 1.78%. Full analysis of forex, commodities, and stocks.
Weekly Market Review: March 2, 2026 – March 6, 2026 (Week 10)
Executive Summary
Week 10 (March 2, 2026 – March 6, 2026) saw significant movement across various asset classes. WTIcrude oil experienced a dramatic surge, closing up 15.02% daily at $90.66, driven by escalating tensions in the Middle East. The U.S. Dollar Index (DXY) weakened, closing at 98.571, down 0.19% daily. Equity markets faced downward pressure, with the S&P 500 closing at 6,743 (-1.07% daily), the Nasdaq 100 at 24,657 (-1.25% daily), and the Dow Jones Industrial Average at 47,516 (-0.76% daily). Gold bucked the trend, rising 1.78% to close at $5,171.21. Several active trading signals were generated, including a sell signal for SOLUSD based on daily chart analysis.
US Dollar & DXY Analysis
The U.S. Dollar Index (DXY) experienced a weakening trend this week, closing at 98.571, a 0.19% daily decrease. The 1-hour RSI stood at 41.0, indicating oversold conditions in the short term, while the 4-hour RSI was at 51.0, suggesting neutral momentum. On the daily timeframe, the RSI was at 62.6, signaling potential overbought conditions. The MACD histogram showed -0.04 on the 1-hour, -0.03 on the 4-hour, and +0.20 on the daily, reflecting mixed momentum. The ADX across all timeframes was at 1.0, indicating a lack of a strong trend. The dollar's weakness may have been influenced by the weakening US job market, as suggested by recent news reports. Keep an eye on the daily bulletin for updates on this developing trend.
The EUR/USD pair closed the week at 1.16115, marking a slight daily gain of 0.04%. Technical indicators presented a mixed outlook. The hourly RSI was 54.8, indicating neutral momentum, while the daily RSI was at 34.3, suggesting oversold conditions. The MACD histogram was near zero across all timeframes. The pair faced resistance from the 20-day SMA at 1.17787. Sentiment remained bearish, with a sell strength of 74% across the 4-hour and daily timeframes, contrasting with a buy signal on the 1-hour chart.
GBP/USD closed at 1.33958, up 0.32% daily. The hourly RSI was 60.7, suggesting increasing bullish momentum, while the daily RSI was 41.4, indicating neutral conditions. The MACD histogram was near zero across all timeframes. The pair struggled to overcome the 20-day SMA at 1.35101. Sentiment was bullish in the short term (1H and 4H) but bearish on the daily timeframe.
USD/JPY closed at 157.80, a 0.16% daily increase. The RSI across all timeframes indicated neutral to slightly overbought conditions (1H: 54.8, 4H: 61.0, 1D: 61.7). The MACD histogram showed positive momentum on the daily (+0.37). The pair was trading above its 20-day SMA at 155.33, suggesting continued bullishness. Overall sentiment remained bullish.
AUD/USD closed at 0.70244, up 0.26% daily. The hourly RSI was 51.7, while the daily RSI was 50.8, both indicating neutral momentum. The MACD histogram was near zero across all timeframes. The pair was trading below its 20-day SMA at 0.70729. Sentiment was mixed, with buy signals on the 1-hour and weekly charts, but sell signals on the 4-hour and daily charts.
NZD/USD closed at 0.58981, up 0.09% daily. The hourly RSI was 52.3, while the daily RSI was 43.1, both indicating neutral momentum. The MACD histogram was near zero across all timeframes. The pair was trading below its 20-day SMA at 0.59811. Sentiment was bearish overall, with sell signals on the 4-hour and daily charts, contrasting with buy signals on the 1-hour and weekly charts.
Gold closed the week at $5,171.21, a significant 1.78% daily increase. The weekly RSI reached 75.1, indicating overbought conditions. The daily RSI was at 55.2, suggesting bullish momentum. The MACD histogram showed positive momentum on the weekly (+45.93) but negative on the daily (-13.35). The price was well above its 20-day SMA of $5,094.23, confirming the bullish trend. Sentiment was strongly bullish across all timeframes.
Silver closed at $84.231, up a strong 2.52% daily. The weekly RSI was 60.4, indicating bullish momentum. The daily RSI was 49.7, suggesting neutral conditions. The MACD histogram showed positive momentum on the weekly (+0.45). The price was trading above its 20-day SMA of $82.935. Sentiment was bullish overall, although the daily chart showed a sell signal.
Brent crude closed at $65.73, a 1.96% daily increase. The RSI across all timeframes indicated bullish momentum (1H: 71.2, 4H: 62.3, 1D: 60.0). The MACD histogram showed positive momentum across all timeframes. The price was trading above its 20-day SMA of $63.29 and approaching the upper Bollinger Band on the daily chart, suggesting a potential breakout. Overall sentiment remained bullish.
Resistance
Price
R3
67.23
R2
66.36
R1
65.42
Pivot
64.55
Support
Price
S1
63.61
S2
62.74
S3
61.80
Fib 61.8%
62.07
WTI Crude Oil
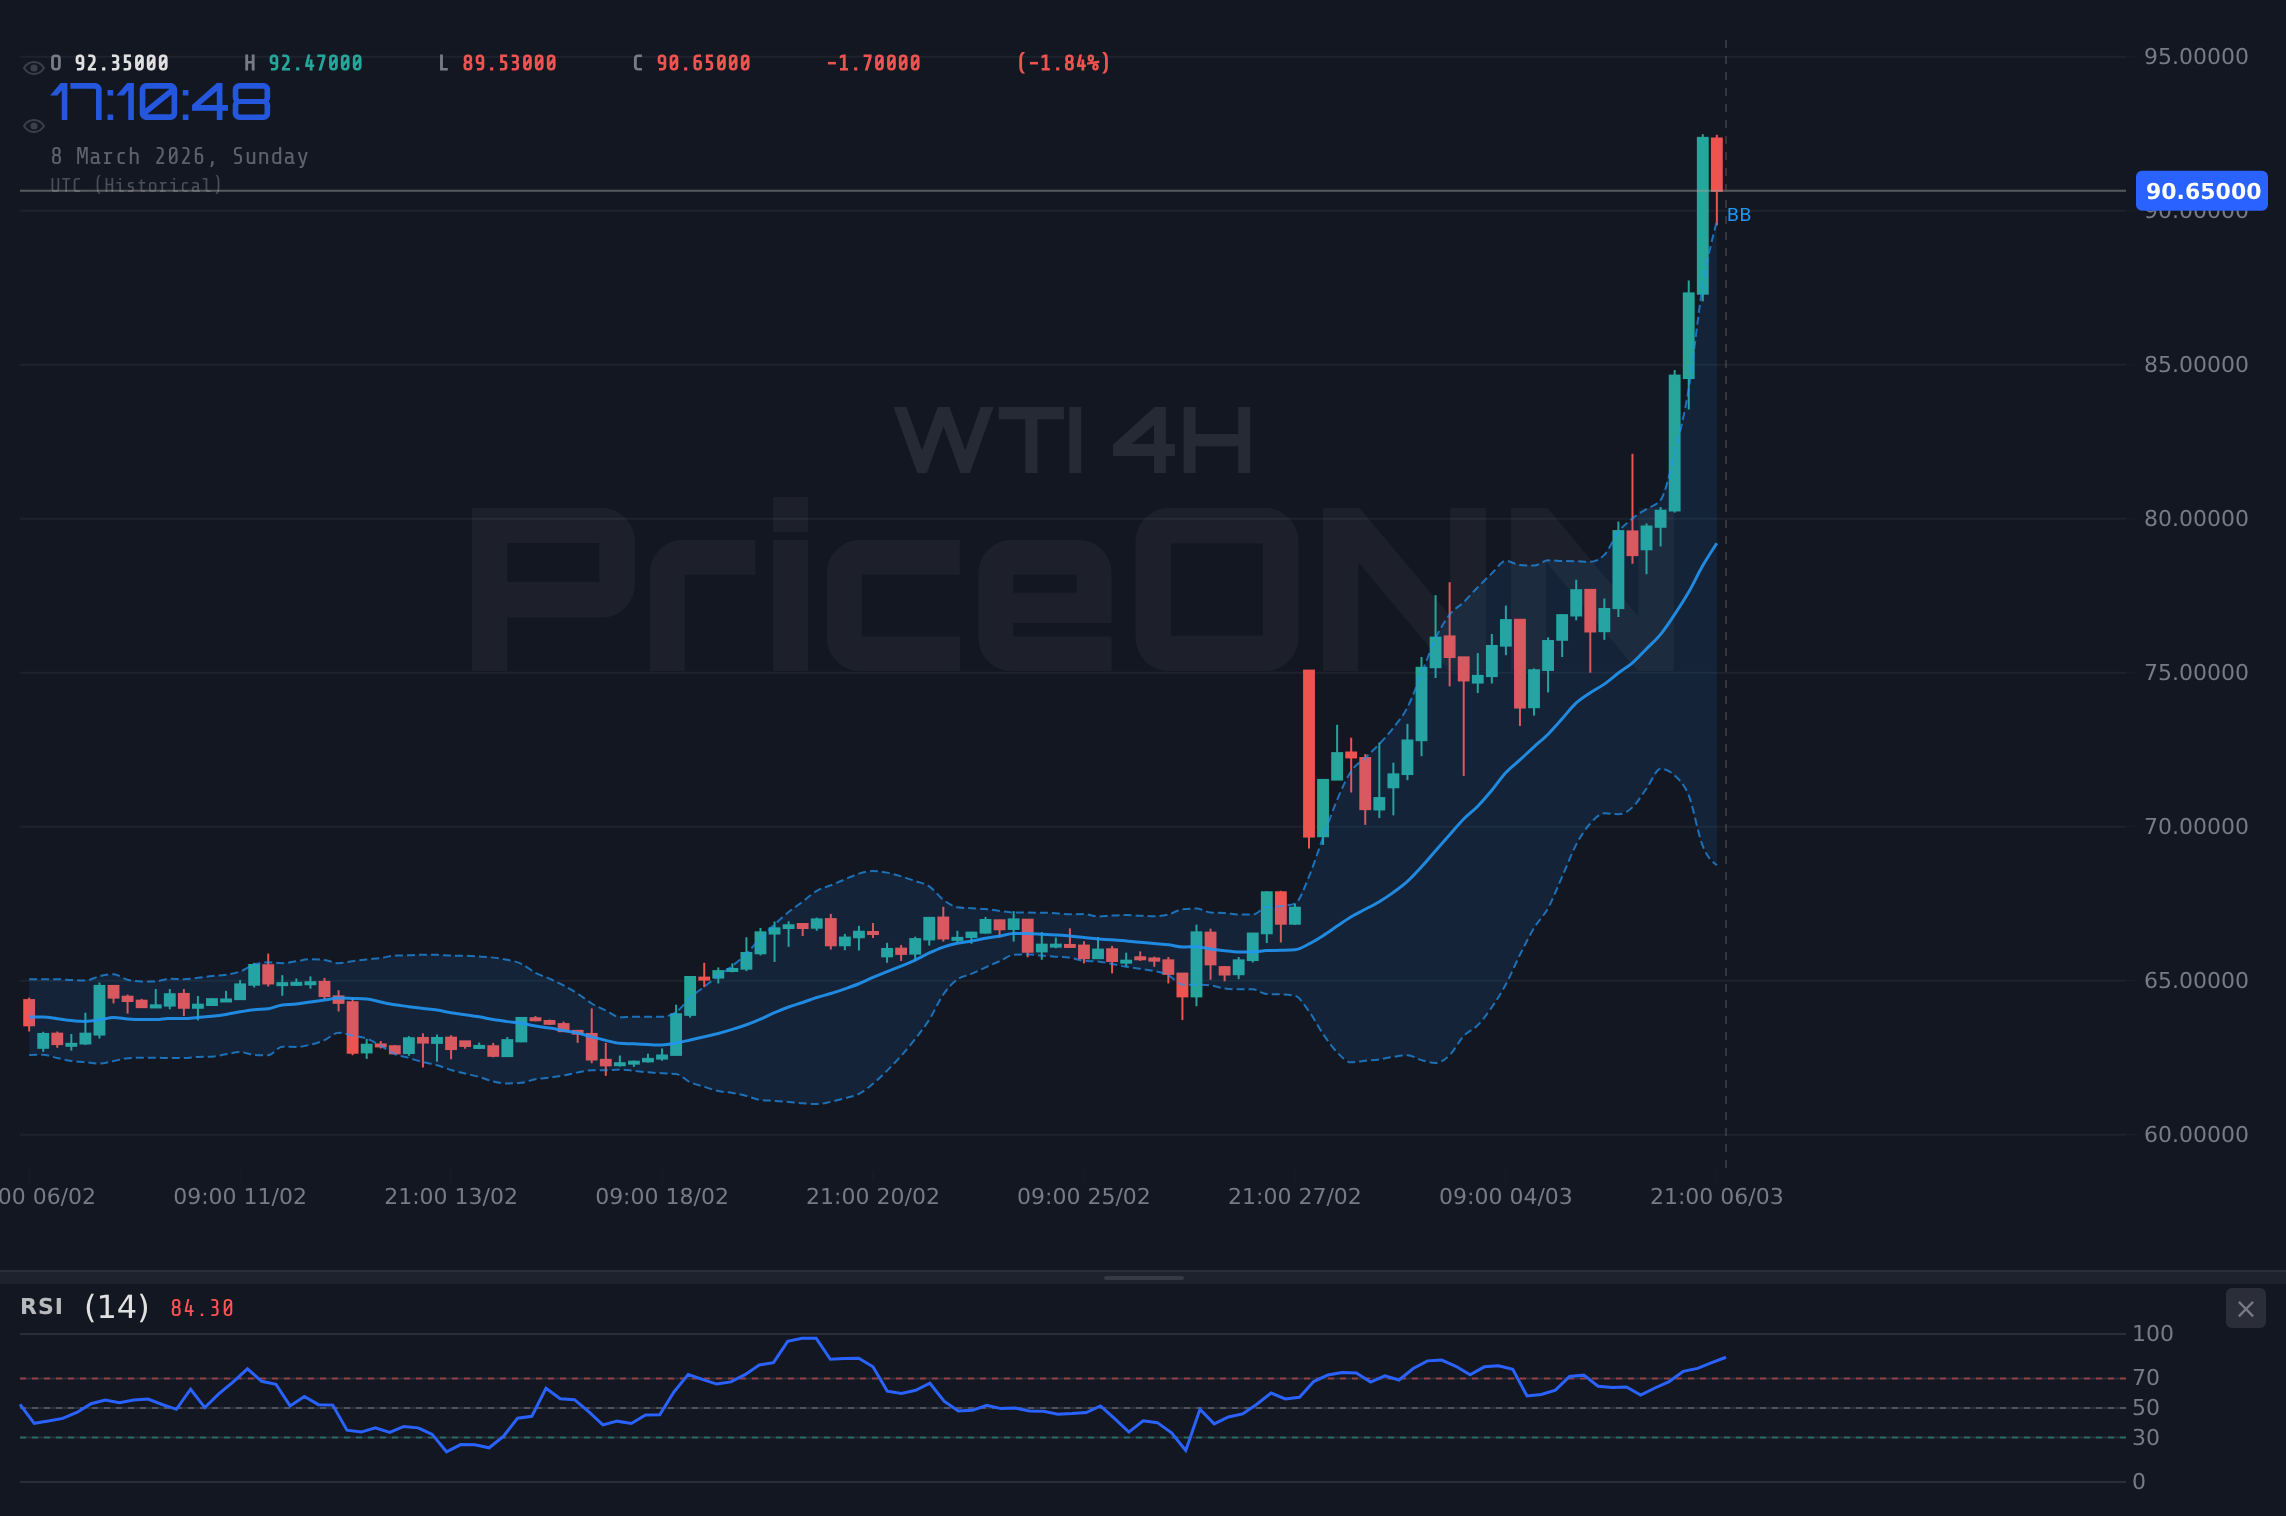
WTI crude experienced a dramatic surge, closing at $90.66, up 15.02% daily. The RSI across all timeframes indicated extremely overbought conditions (1H: 76.0, 4H: 83.6, 1D: 88.9, 1W: 80.3). The MACD histogram showed strong positive momentum across all timeframes. The price was trading significantly above its 20-day SMA of $68.30 and approaching the upper Bollinger Band, suggesting a potential for a pullback. Overall sentiment remained strongly bullish, driven by escalating tensions in the Middle East, as noted in recent articles. This surge may impact forex markets, particularly the EUR/CAD pair, as mentioned in the daily bulletin.
Bitcoin closed at $66,869, down 0.87% daily. The RSI across all timeframes indicated neutral to oversold conditions (1H: 38.3, 4H: 37.0, 1D: 44.5, 1W: 29.4). The MACD histogram showed mixed momentum, with positive momentum on the daily (+606.69). The price was trading below its 20-day SMA of $67,612. Sentiment remained bearish overall.
Ethereum closed at $1,933.46, down 1.77% daily. The RSI across all timeframes indicated neutral to oversold conditions (1H: 36.3, 4H: 36.8, 1D: 43.2, 1W: 32.4). The MACD histogram showed mixed momentum, with positive momentum on the daily (+24.47). The price was trading below its 20-day SMA of $1,977.02. Sentiment remained strongly bearish across all timeframes.
The S&P 500 closed at 6,743, down 1.07% daily. The RSI across all timeframes indicated neutral to oversold conditions (1H: 36.9, 4H: 38.4, 1D: 39.6). The MACD histogram showed negative momentum across all timeframes. The price was trading below its 20-day SMA of 6,871. Sentiment remained strongly bearish across all timeframes.
The Nasdaq 100 closed at 24,657, down 1.25% daily. The RSI across all timeframes indicated neutral conditions (1H: 37.6, 4H: 43.7, 1D: 44.0). The MACD histogram showed mixed momentum, with positive momentum on the daily (+6.33). The price was trading below its 20-day SMA of 24,923. Sentiment remained strongly bearish across all timeframes.
The Dow Jones Industrial Average closed at 47,516, down 0.76% daily. The RSI across all timeframes indicated neutral to oversold conditions (1H: 42.0, 4H: 35.4, 1D: 33.2). The MACD histogram showed negative momentum across all timeframes. The price was trading below its 20-day SMA of 49,209. Sentiment remained bearish overall.
Resistance
Price
R3
49,892
R2
49,359
R1
48,618
Pivot
48,085
Support
Price
S1
47,344
S2
46,811
S3
46,070
Fib 61.8%
49,169
Economic Calendar Impact
Due to missing actual vs forecast data, a detailed analysis of specific economic events is unavailable. However, the news feed indicates that US job market data was released and may have influenced the weakening dollar. We will update the chart analysis in our daily bulletin as the data becomes available.
Week in Summary
Week 10 was marked by a significant surge in WTI crude oil prices, driven by escalating tensions in the Middle East, leading to a 15.02% daily increase. This surge impacted forex markets, particularly the EUR/CAD pair. The U.S. Dollar Index (DXY) weakened, while gold bucked the trend and rose. Equity markets faced downward pressure, with the S&P 500, Nasdaq 100, and Dow Jones Industrial Average all declining. Sentiment shifted towards bearishness in equity markets and cryptocurrencies, while remaining bullish for energy markets. Active trading signals were generated, including a sell signal for SOLUSD. The week highlighted the interconnectedness of geopolitical events, commodity markets, and financial asset performance.
Disclaimer: This content is for informational and educational purposes only and does not constitute investment advice, financial recommendation, or an offer to buy or sell any financial instrument. Past performance does not guarantee future results. Always do your own research and consult a licensed financial advisor before making investment decisions.
Track markets in real-time
AI-powered analysis, technical indicators and real-time price data.
We are looking for writers who produce market analysis, macro commentary, and data-driven content. Reach readers in 10 languages through our multilingual publishing platform.