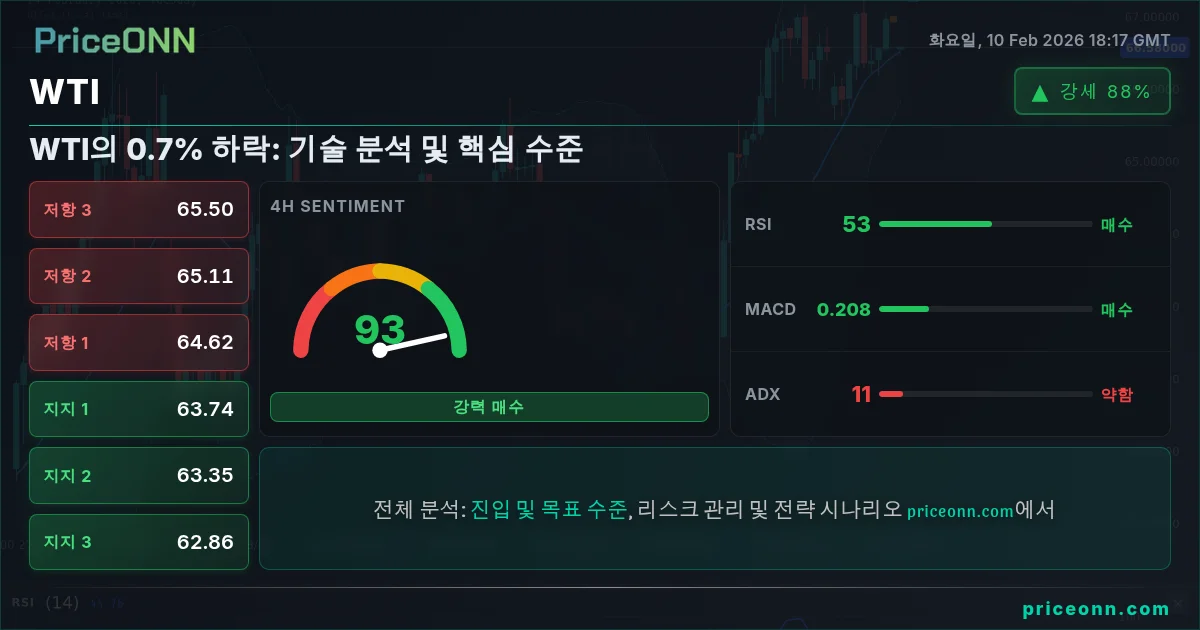
WTI의 0.7% 하락: 기술 분석 및 핵심 수준
WTI는 현재 $64.03에 거래 중이며 0.7%의 소폭 하락을 보이고 있습니다. 기술 지표는 무엇을 제시하고 있나요?
WTI 원유 가격이 $64.03로 하락하며 0.7% 감소를 나타내고 있습니다. 이러한 움직임은 시장의 방향성과 기초적인 요소에 대해 중요한 질문을 제기합니다.
⚡ 핵심 요약
WTI가 $64.03에 거래됨에 따라, 시장 정서는 지정학적 긴장과 변동하는 수요 예측의 영향을 받고 있습니다.
시장 개요
최근 WTI 가격의 하락은 글로벌 수요의 변화와 지속적인 지정학적 불확실성 등 여러 요인에 기인할 수 있습니다. 현재 가격이 $64.03인 상황에서 시장은 향후 가격 움직임을 결정할 수 있는 주요 지지선 및 저항선에 주목하고 있습니다.
현재 가격
$64.03
안정적
일일 변화
-0.7%
하락 중
주간 범위
64.4 - 66.04
변동성 있음
기술 분석
1시간, 4시간 및 일별 차트를 분석한 결과 혼합 신호가 나타납니다:
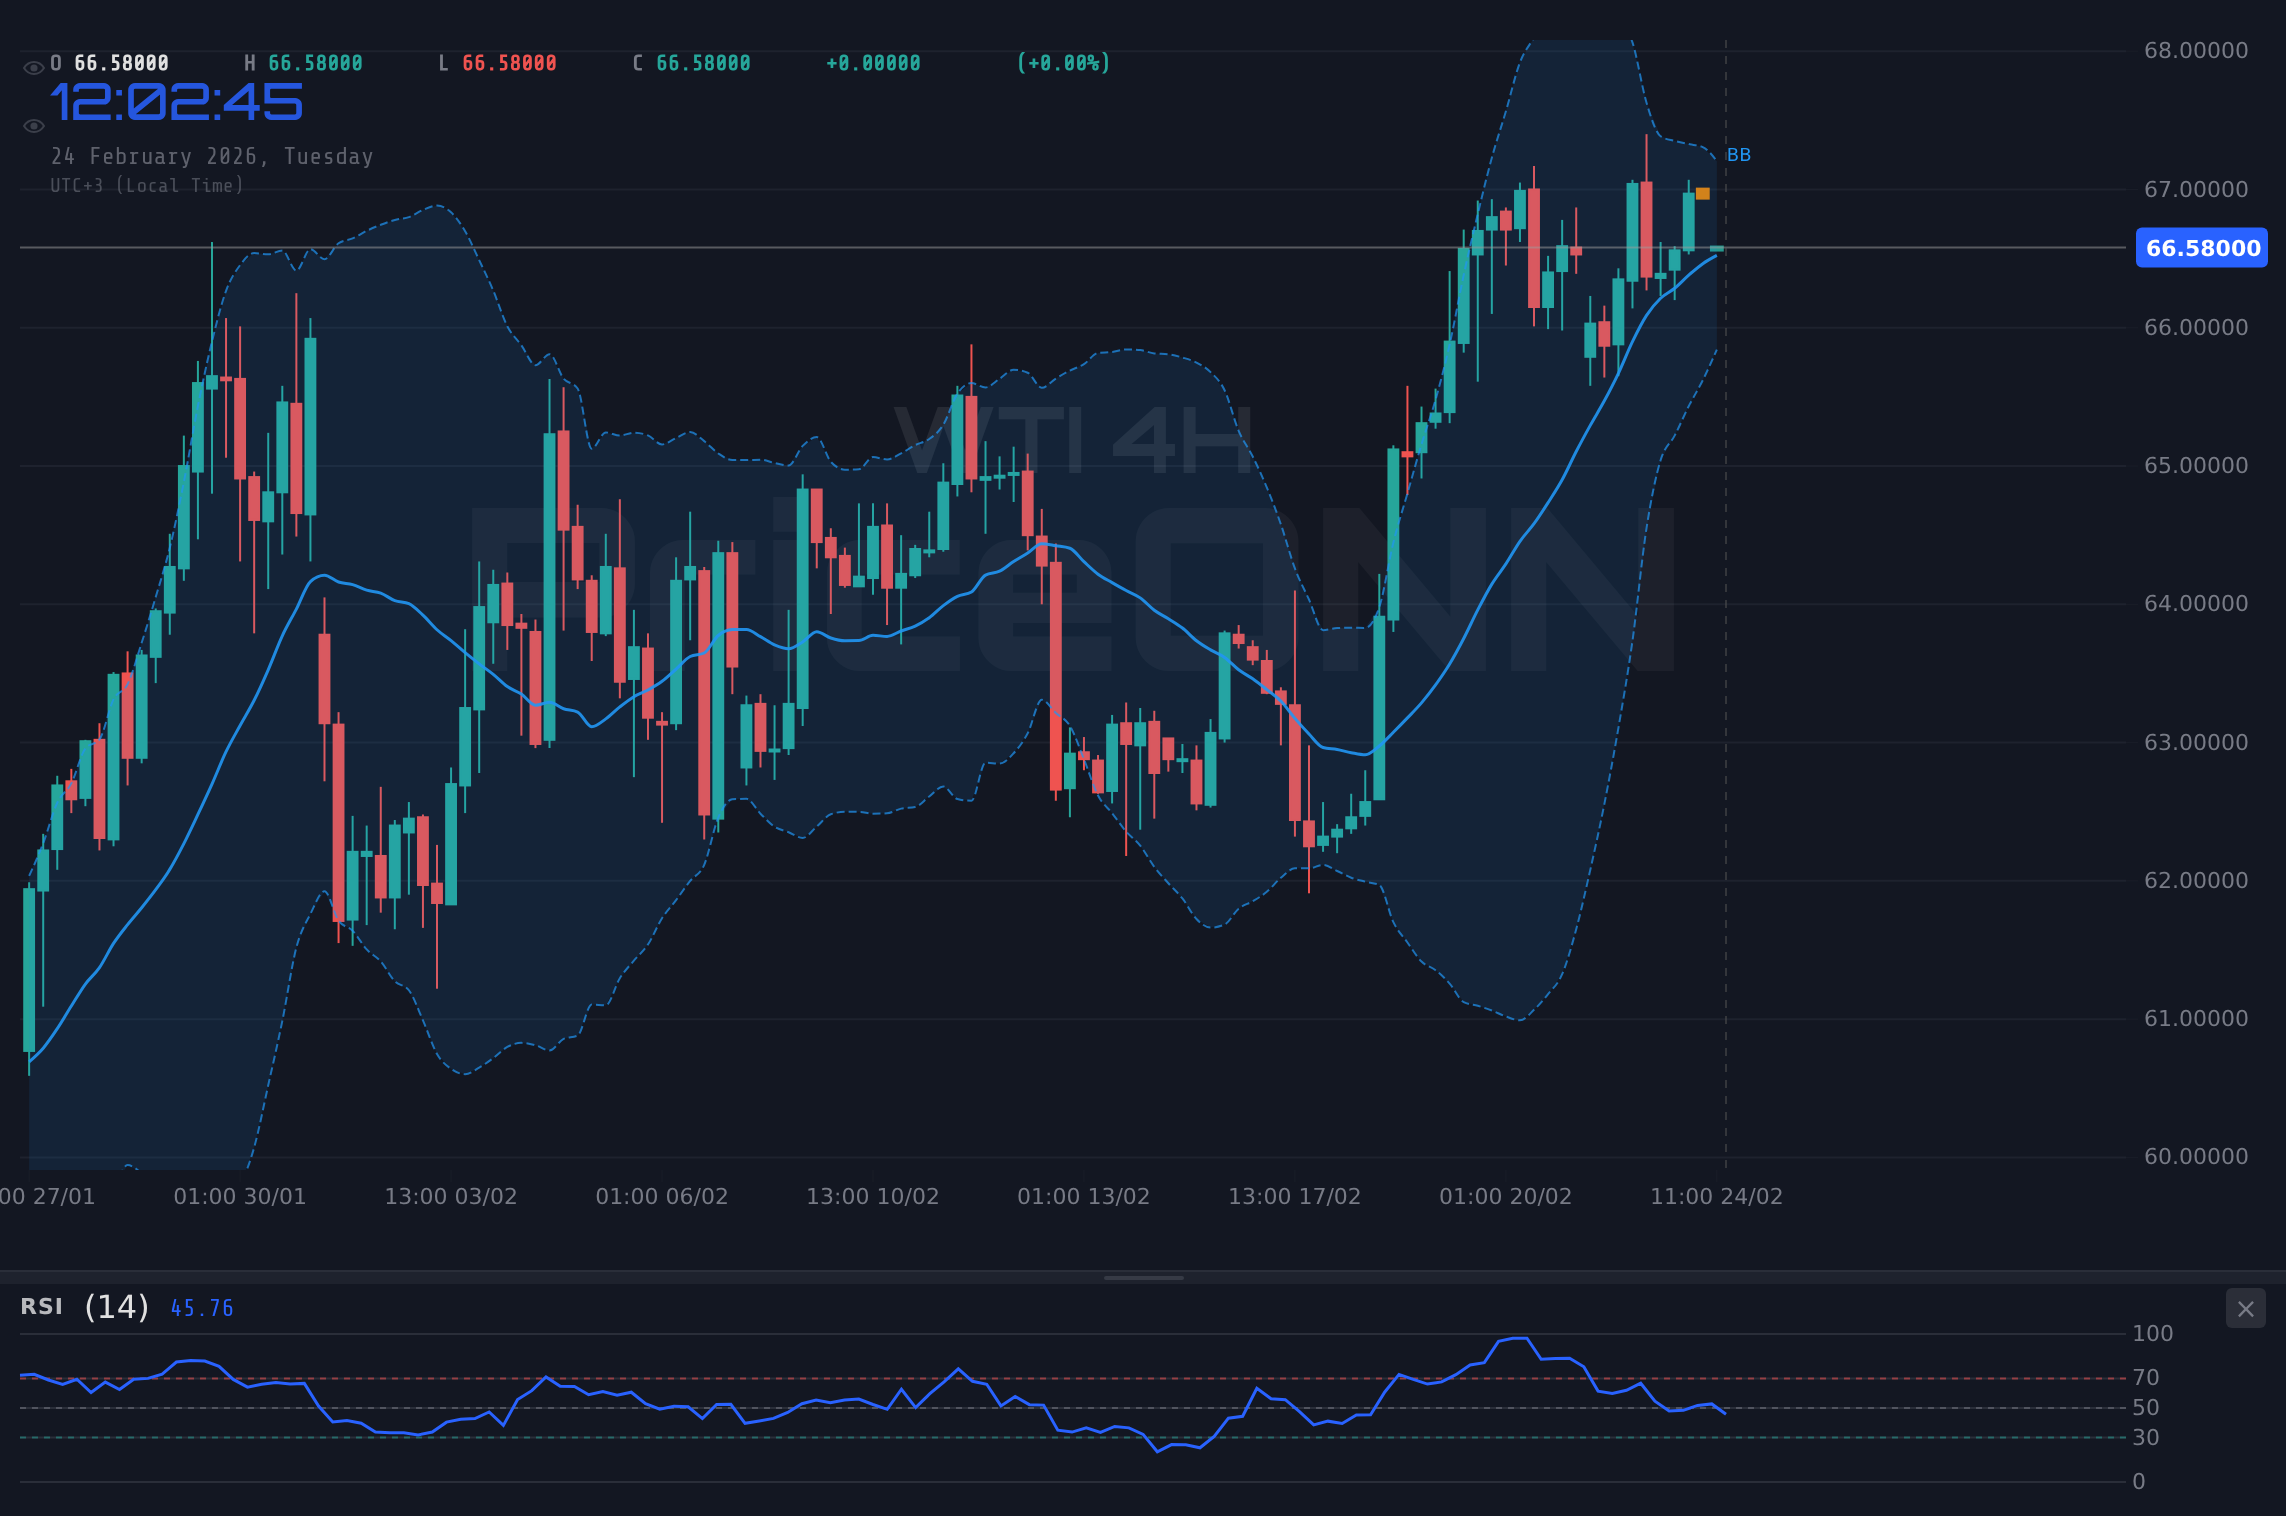
- 1시간 차트: 현재 추세는 중립이며 $64.24에서 상당한 저항을 보입니다.
- 4시간 차트: 강한 상승 추세가 관찰되어 반등 가능성이 있습니다.
- 일별 차트: 전반적인 추세는 중립으로 신중한 거래를 암시합니다.
⚡ 핵심 요약
$64.24 저항선을 면밀히 모니터링하세요. 돌파가 강한 상승을 알릴 수 있습니다.
핵심 수준
▲ 지지 수준
S1
최근 최저치
$63.84
S2
주요 심리적 수준
$63.50
S3
장기 지지
$63.00
▼ 저항 수준
R1
즉각적인 저항
$65.41
R2
다음 주요 저항
$65.62
R3
역사적 저항
$66.04
앞으로의 경제 이벤트
2월 12일, 월요일
미국 CPI 데이터 - 인플레이션 전망과 유가에 영향을 줄 것으로 예상됩니다.
2월 15일, 목요일
OPEC 회의 - 생산 감축 가능성이 시장 동향에 영향을 미칠 수 있습니다.
거래 계획
시나리오 A: 하락 추세 지속
- 방향: 약세
- 진입 트리거: $63.84 아래에서 마감
- 목표 1: $63.50 (~$0.53)
- 목표 2: $63.00 (~$1.03)
- 중단/무효화: $64.24 위에서 마감
시나리오 B: 반등 시도
- 조건: $63.84에서 지지 유지
- 진입 트리거: 거래량 증가와 함께 $64.24 위에서 마감
- 목표: $65.41
- 무효화: $63.00 아래에서 마감
뉴스 리스크: 2월 12일 CPI 데이터 발표 전후로 잠재적인 변동성에 유의하세요.
▲ 지지 수준
S1
최근 최저치
$63.84
S2
주요 심리적 수준
$63.50
S3
장기 지지
$63.00
▼ 저항 수준
R1
즉각적인 저항
$65.41
R2
다음 주요 저항
$65.62
R3
역사적 저항
$66.04
"원유 거래 세계에서는 인내와 정확성이 변동성을 헤쳐 나가는 열쇠입니다."
시장이 변화하는 역학에 반응함에 따라 WTI를 둘러싼 조심스러운 낙관론이 여전히 존재합니다. 거래자들은 경계하며 리스크를 효과적으로 관리하고 기회가 생길 때 이를 잡을 준비를 해야 합니다.
면책 조항: 이 콘텐츠는 정보 제공 및 교육 목적으로만 제공되며, 투자 조언, 금융 추천 또는 금융 상품의 매매 제안을 구성하지 않습니다. 과거 실적이 미래 결과를 보장하지 않습니다. 투자 결정을 내리기 전에 직접 조사하고 공인 재정 상담사와 상담하세요.