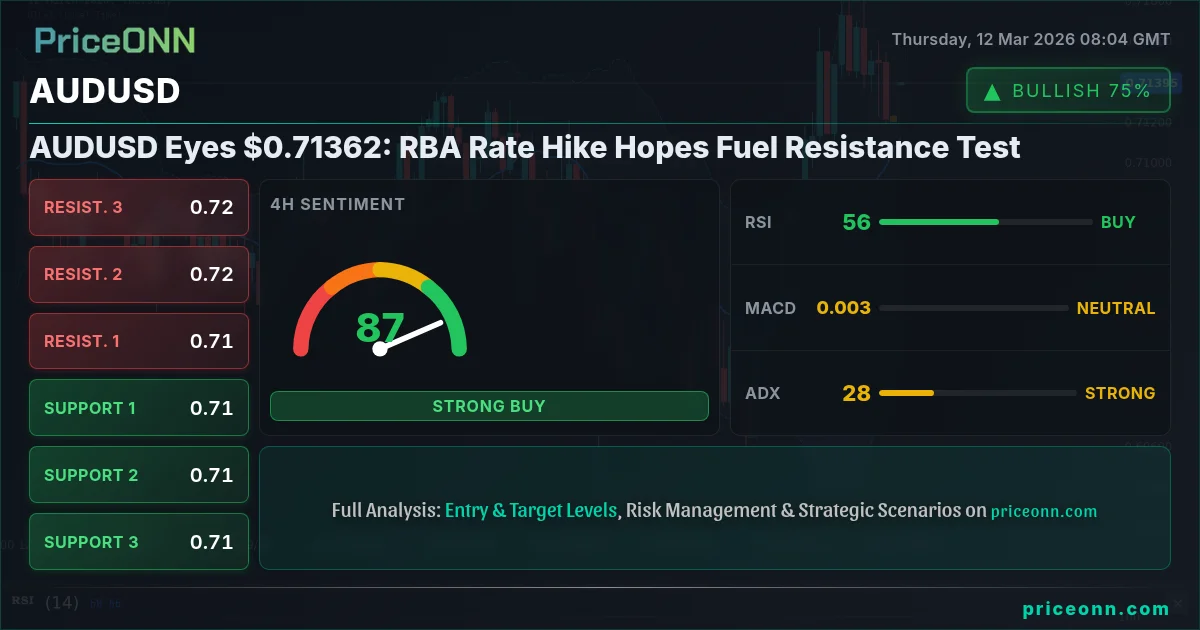
AUDUSD is currently trading near $0.71362, a level that's proving to be a battleground between bulls and bears. The pair is gaining momentum amid rising expectations of a rate hike by the Reserve Bank of Australia (RBA), but a strengthening US dollar is capping gains. Will the Aussie dollar break through resistance, or will dollar strength push it back down?
The Bull Case for AUDUSD: RBA Rate Hike Expectations
The primary driver behind the recent AUDUSD rally is increasing anticipation of a rate hike by the RBA. Recent economic data from Australia has been mixed, but inflation remains a concern, leading markets to price in a higher probability of tighter monetary policy. News headlines mentioning a RBA rate hike are fueling the sentiment. If the RBA adopts a hawkish stance at its next meeting, AUDUSD could see a significant boost, potentially targeting the daily resistance level of 0.71872.
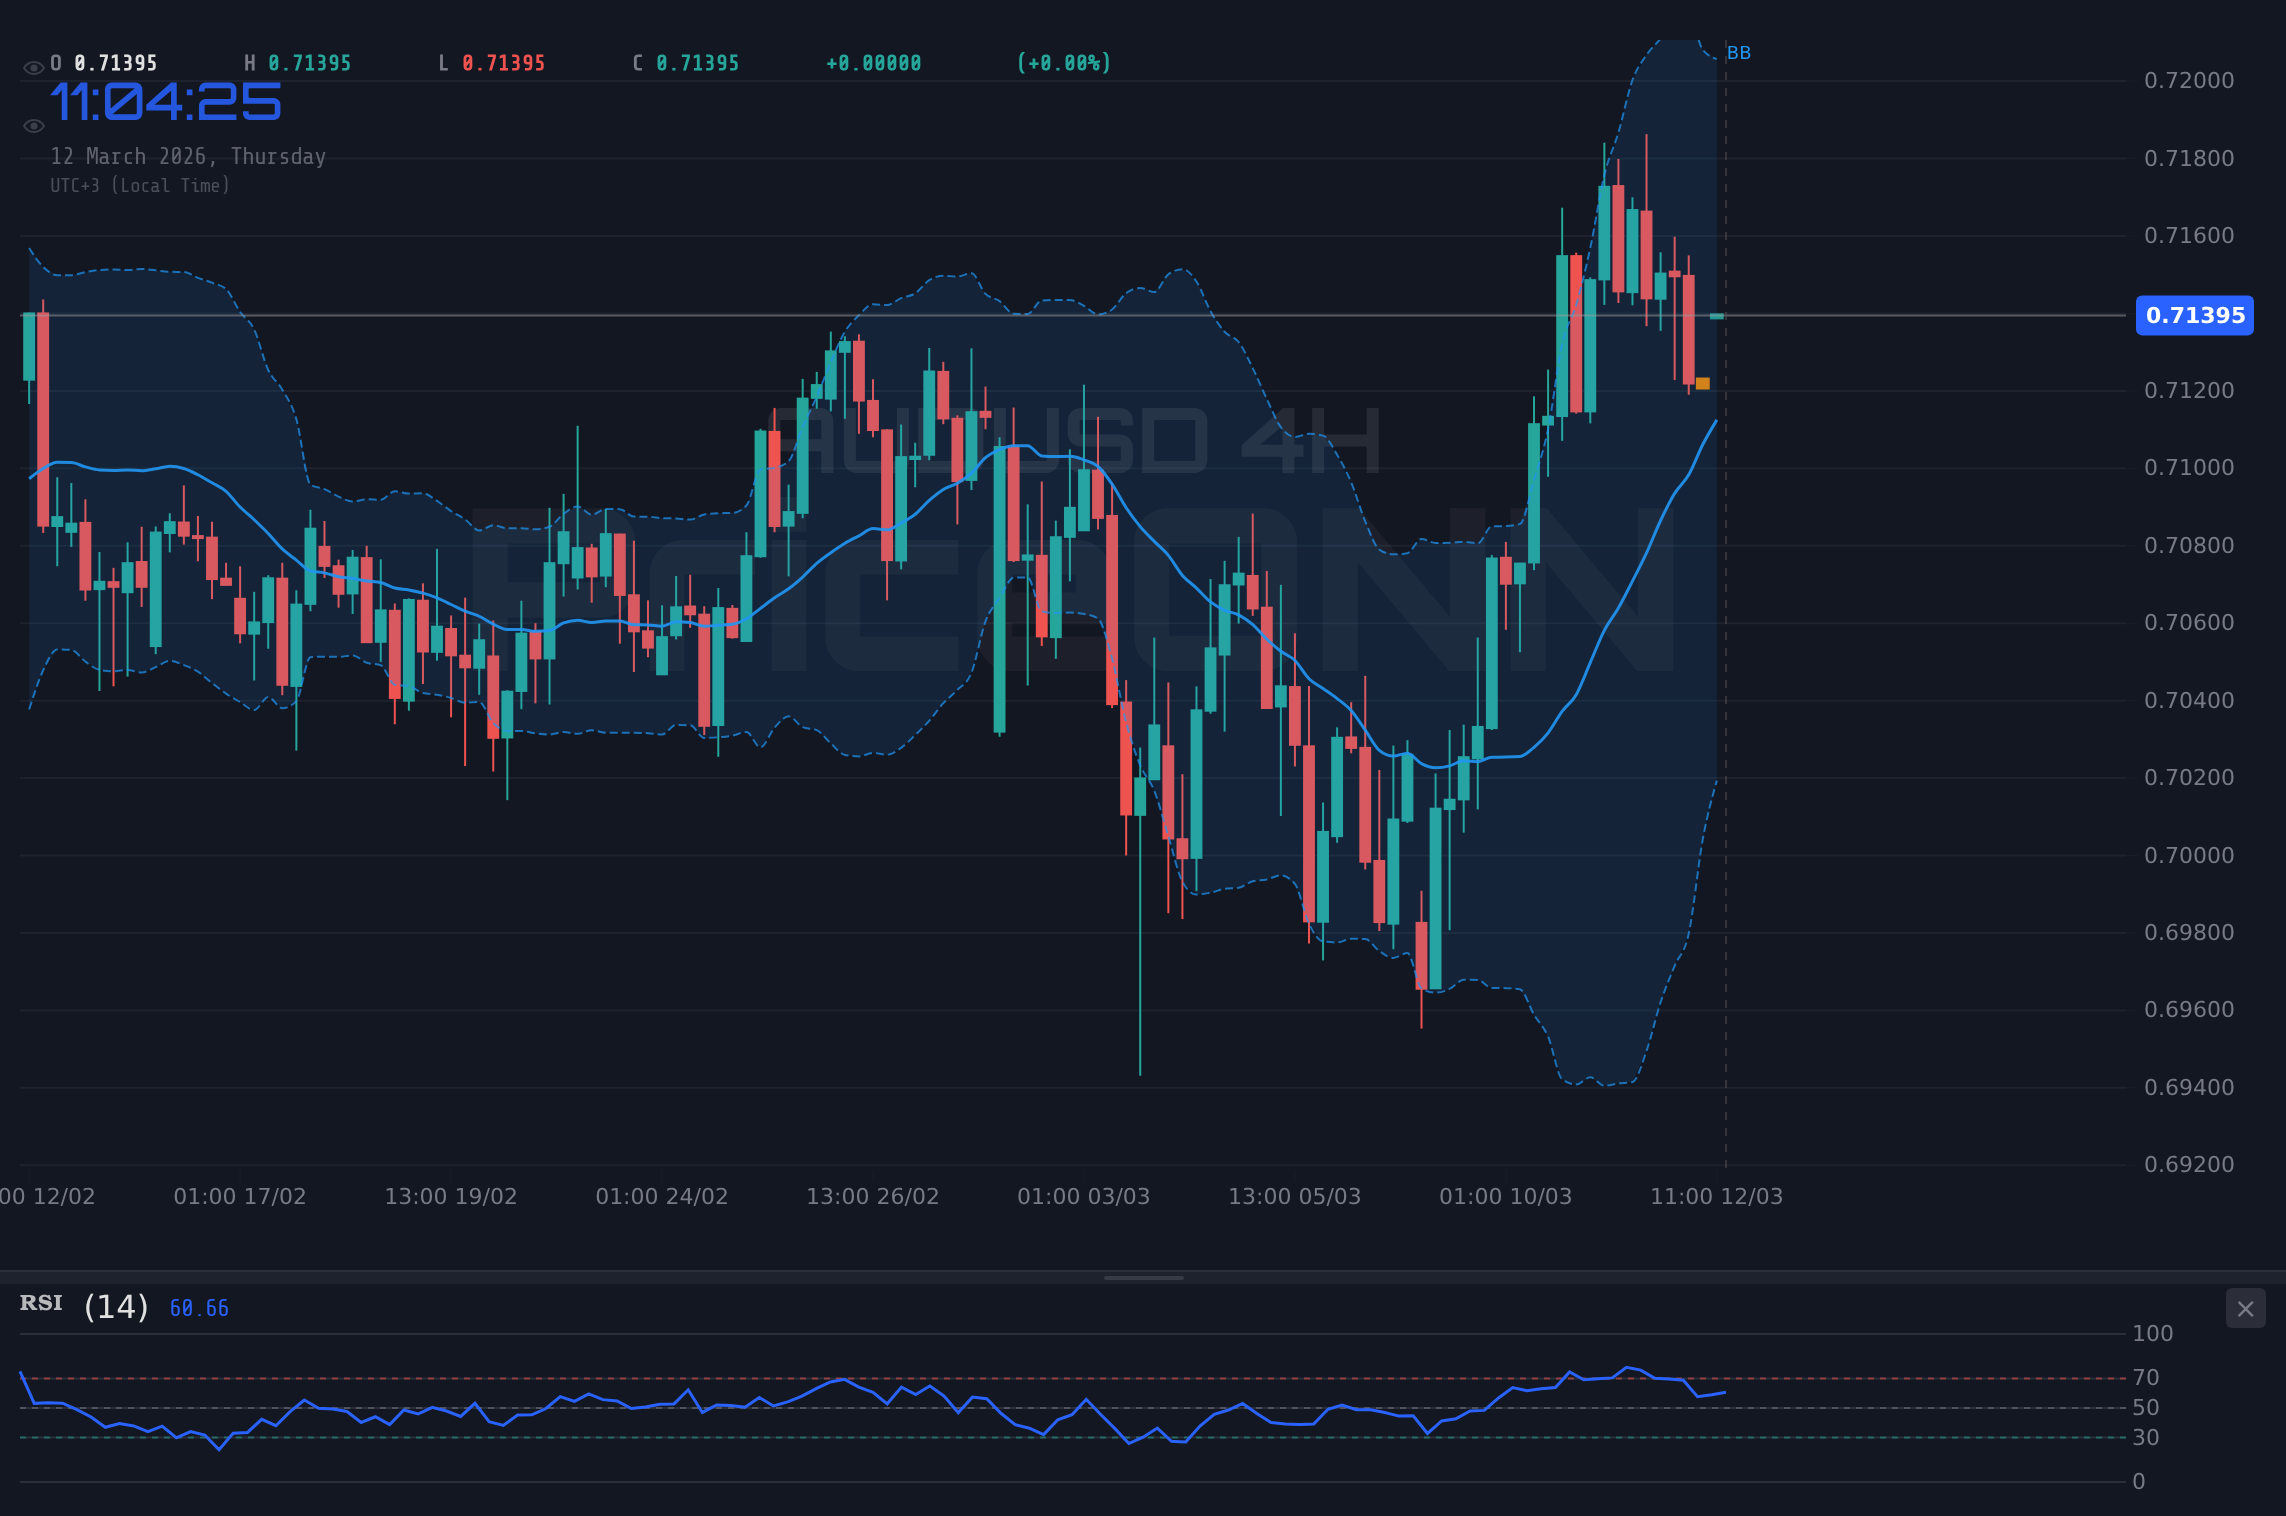
Technically, the 4-hour chart paints a supportive picture for the bulls. The RSI sits at 54.09, indicating neither overbought nor oversold conditions, leaving room for further upside. The MACD histogram is showing positive momentum, further reinforcing the bullish case. The pair is trading above its middle Bollinger Band, which often acts as a dynamic support level. A break above the hourly resistance at 0.71316 could trigger a move towards 0.71653, the 4-hour resistance level.
The Bear Case for AUDUSD: Dollar Dominance and Global Risk-Off
Despite the RBA rate hike expectations, the US dollar remains a formidable force. The Dollar Index (DXY) is currently trading at 99.12, with a strong upward trend across multiple timeframes. The dollar's strength is fueled by a combination of factors, including safe-haven demand amid global economic uncertainty and expectations of continued interest rate hikes by the Federal Reserve. As indicated by the rise of DXY, a stronger dollar puts downward pressure on AUDUSD, potentially negating the positive impact of RBA expectations.
Furthermore, escalating geopolitical tensions, particularly in the Middle East, are contributing to a risk-off environment. As oil prices soar, as mentioned in recent news, inflation fears are reignited, dampening hopes for interest rate cuts. In times of uncertainty, investors tend to flock to safe-haven assets like the US dollar, further bolstering its strength. The SP500 is down -0.32% and Nasdaq100 is down -0.28% currently, increasing the likelihood of a risk-off sentiment.
From a technical standpoint, the 1-hour chart reveals some bearish signals. The RSI is at 47.83, showing a downward trend, and the Stochastic oscillator is signaling a potential pullback. A break below the hourly support at 0.71132 could lead to a test of the next support level at 0.71025. The ADX reading of 16.83 indicates a weak trend, suggesting that the recent AUDUSD rally may lack conviction.
Technicals as Tiebreaker: A Multi-Timeframe View
To gain a clearer picture of AUDUSD's potential trajectory, it's crucial to analyze multiple timeframes. On the daily chart, the overall trend appears to be neutral, with the price oscillating within a defined range. The daily RSI of 59.85 suggests that the bulls still have some momentum, but the Stochastic oscillator's overbought signal warrants caution. The ADX reads 28.15, pointing to a strong trend, but doesn't indicate direction.
The MACD histogram is showing negative momentum, indicating that selling pressure is building. However, the pair is trading above its middle Bollinger Band, which could act as a support level. The key lies in whether AUDUSD can sustain its break above the 0.71316 hourly resistance. Failure to do so could pave the way for a retest of the daily support at 0.71125. The upcoming economic data releases, particularly the USD indicators scheduled for release on Friday, will be crucial in determining the pair's direction.
Trade Plan: Cautious Optimism with a Clear Invalidation Level
Given the conflicting signals, a cautious approach is warranted. While the RBA rate hike expectations provide a bullish catalyst, the dollar's strength and global risk-off sentiment pose significant headwinds. The technical picture is equally mixed, with bullish signals on the 4-hour chart offset by bearish signals on the 1-hour chart. Therefore, it's essential to wait for confirmation before entering a trade.
AUDUSD breaks above the hourly resistance at 0.71316 and sustains its rally, driven by hawkish RBA comments and a weakening US dollar. The initial target is the 4-hour resistance at 0.71653, followed by the daily resistance at 0.71872.
AUDUSD fails to break above 0.71316 and reverses its course, pressured by dollar strength and risk-off sentiment. The initial target is the hourly support at 0.71132, followed by the daily support at 0.71125.
Entry Trigger: A confirmed break and retest of the hourly resistance at 0.71316 would signal a potential long entry.
Target 1: 0.71653 (4-hour resistance)
Target 2: 0.71872 (Daily resistance)
Stop/Invalidation: A close below 0.71132 would invalidate the bullish scenario and warrant a reassessment. This is also near the first hourly support of 0.71132.
The upcoming USD indicators on Friday could significantly impact AUDUSD. Be prepared for increased volatility and adjust your position size accordingly.
Frequently Asked Questions: AUDUSD Analysis
What happens if AUDUSD breaks above $0.71316 resistance?
If AUDUSD breaks and holds above the $0.71316 hourly resistance, it could signal a continuation of the bullish trend. The next target would be the 4-hour resistance at 0.71653, driven by RBA rate hike expectations.
Should I buy AUDUSD at current levels of $0.71362 given the Stochastic signal?
While the Stochastic oscillator on the daily chart indicates overbought conditions, suggesting a potential pullback, the overall trend remains neutral. It's prudent to wait for a confirmed break above 0.71316 before considering a long entry, managing risk with a stop-loss order.
Is the RSI at 59.85 a buy signal for AUDUSD right now?
An RSI of 59.85 on the daily chart indicates that the bulls have momentum, but it's not an outright buy signal. It suggests that the pair isn't overbought and could potentially move higher, but confirmation is needed from other indicators and price action.
How will the USD indicators on Friday affect AUDUSD this week?
The upcoming USD indicators on Friday could significantly impact AUDUSD, depending on whether they show a strengthening or weakening US economy. Stronger-than-expected data could bolster the dollar and pressure AUDUSD, while weaker data could have the opposite effect.
The battle between bulls and bears at $0.71362 highlights the current market tension surrounding AUDUSD. While RBA rate hike expectations provide a bullish catalyst, dollar strength and global risk-off sentiment pose significant headwinds. Traders should remain patient, wait for confirmation, and manage risk diligently.
Technical Outlook Summary
| Indicator | Value | Signal |
|---|---|---|
| RSI (14) | 59.85 | Neutral |
| MACD Histogram | Negative | Bearish |
| Stochastic | 79.91/60.91 | Overbought |
| ADX | 28.15 | Strong Trend |
| Bollinger | Middle Band | Watch |
Key Levels
Support Levels
Resistance Levels
Track markets in real-time
AI-powered analysis, technical indicators and real-time price data.
Join Our Telegram Channel
Breaking market news, AI analysis and trading signals instantly.
Join Channel