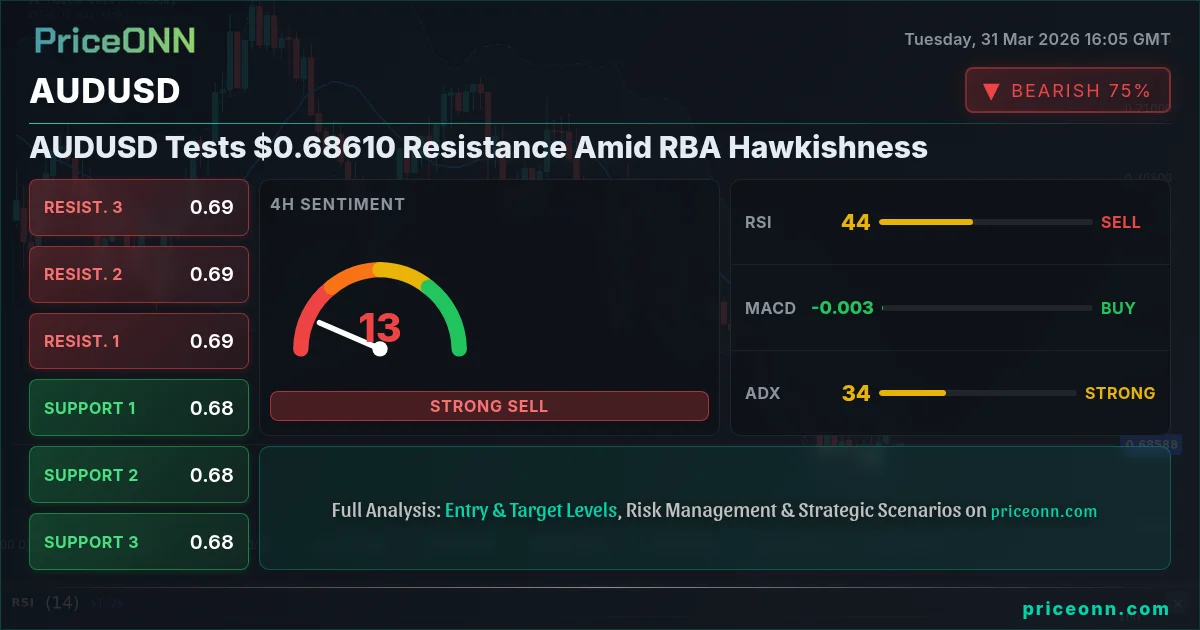
AUDUSD Tests $0.68610 Resistance Amid RBA Hawkishness
AUDUSD faces pressure at $0.68610 as RBA signals tightening, while geopolitical tensions keep oil prices high and the DXY firms.
The global stage is set for a fascinating interplay between central bank policy, geopolitical tensions, and currency movements, with AUDUSD currently hovering around the critical $0.68610 mark. While the Reserve Bank of Australia (RBA) hints at further tightening, global uncertainty fueled by Middle East conflicts and soaring oil prices, currently pushing Brent crude past $110 and WTI above $104, is casting a long shadow. This complex backdrop is simultaneously bolstering the US Dollar Index (DXY) and creating a volatile environment for risk assets, making the $0.68610 level for AUDUSD a key battleground for bulls and bears.
- AUDUSD is testing resistance near $0.68610, with RSI at 47.29 indicating bearish momentum on the 1H chart.
- The RBA's hawkish signals contrast with broader global risk-off sentiment, creating a tug-of-war for the pair.
- Key support for AUDUSD lies at $0.68262, with significant resistance at $0.68775.
- Geopolitical risks continue to support oil prices and the DXY, adding headwinds for AUDUSD.
The Macroeconomic Crosscurrents Shaping AUDUSD
The narrative surrounding AUDUSD at $0.68610 is a tapestry woven from threads of contrasting economic forces. On one hand, the Reserve Bank of Australia (RBA) has been signaling a more hawkish stance, with recent communications suggesting that inflation remains a persistent concern, potentially necessitating further interest rate hikes. This fundamental driver should, in theory, lend support to the Australian dollar. However, the global economic environment is far from supportive. Escalating geopolitical tensions in the Middle East have sent shockwaves through energy markets, pushing Brent crude prices to $110.58 and WTI to $104.72. This surge in oil prices not only fuels inflation fears globally but also typically strengthens the US dollar as a safe-haven asset. The US Dollar Index (DXY) is currently trading around 99.92, reflecting this demand for greenback safety amidst uncertainty.
This divergence in forces creates a complex trading environment. While the RBA's stance might offer some underlying strength to the AUD, the broader risk-off sentiment and the resultant strength in the DXY are acting as significant headwinds. Traders are grappling with whether the immediate global risks will overshadow domestic considerations for the Australian economy. The current price action around $0.68610 suggests a market on edge, waiting for clearer direction. The 1-hour chart shows AUDUSD struggling to break higher, with an RSI(14) at 47.29 indicating bearish momentum, despite positive MACD signals. This conflict highlights the choppy waters traders are navigating.
Furthermore, the performance of major equity indices like the S&P 500 (currently at 6430.7) and Nasdaq 100 (at 23302.48) often serves as a barometer for global risk appetite. A strong showing in these indices typically correlates with demand for riskier currencies like the AUD, while a downturn prompts a flight to safety, benefiting the USD. Currently, the US indices are showing resilience, which might offer some solace to AUD bulls. However, this resilience is being tested by the persistent inflation fears driven by oil prices. The interplay between these factors makes a clear directional call on AUDUSD challenging without a more defined catalyst.
Analyzing the Technical Picture for AUDUSD
Turning our attention to the technical charts, the AUDUSD pair is currently bumping against resistance levels that are proving difficult to breach. On the 1-hour timeframe, the current price of $0.68610 is finding sellers near the $0.68775 resistance level. The RSI(14) at 47.29, while not deeply oversold, suggests that bullish momentum is waning, and the MACD, though showing positive momentum, is operating under the shadow of the broader bearish trend on longer timeframes. The ADX at 17.04 on this timeframe indicates a weak trend, suggesting that any move might lack conviction and could be prone to reversals. This technical picture on the shorter timeframe paints a cautious outlook, aligning with the immediate pressure seen at the $0.68610 level.
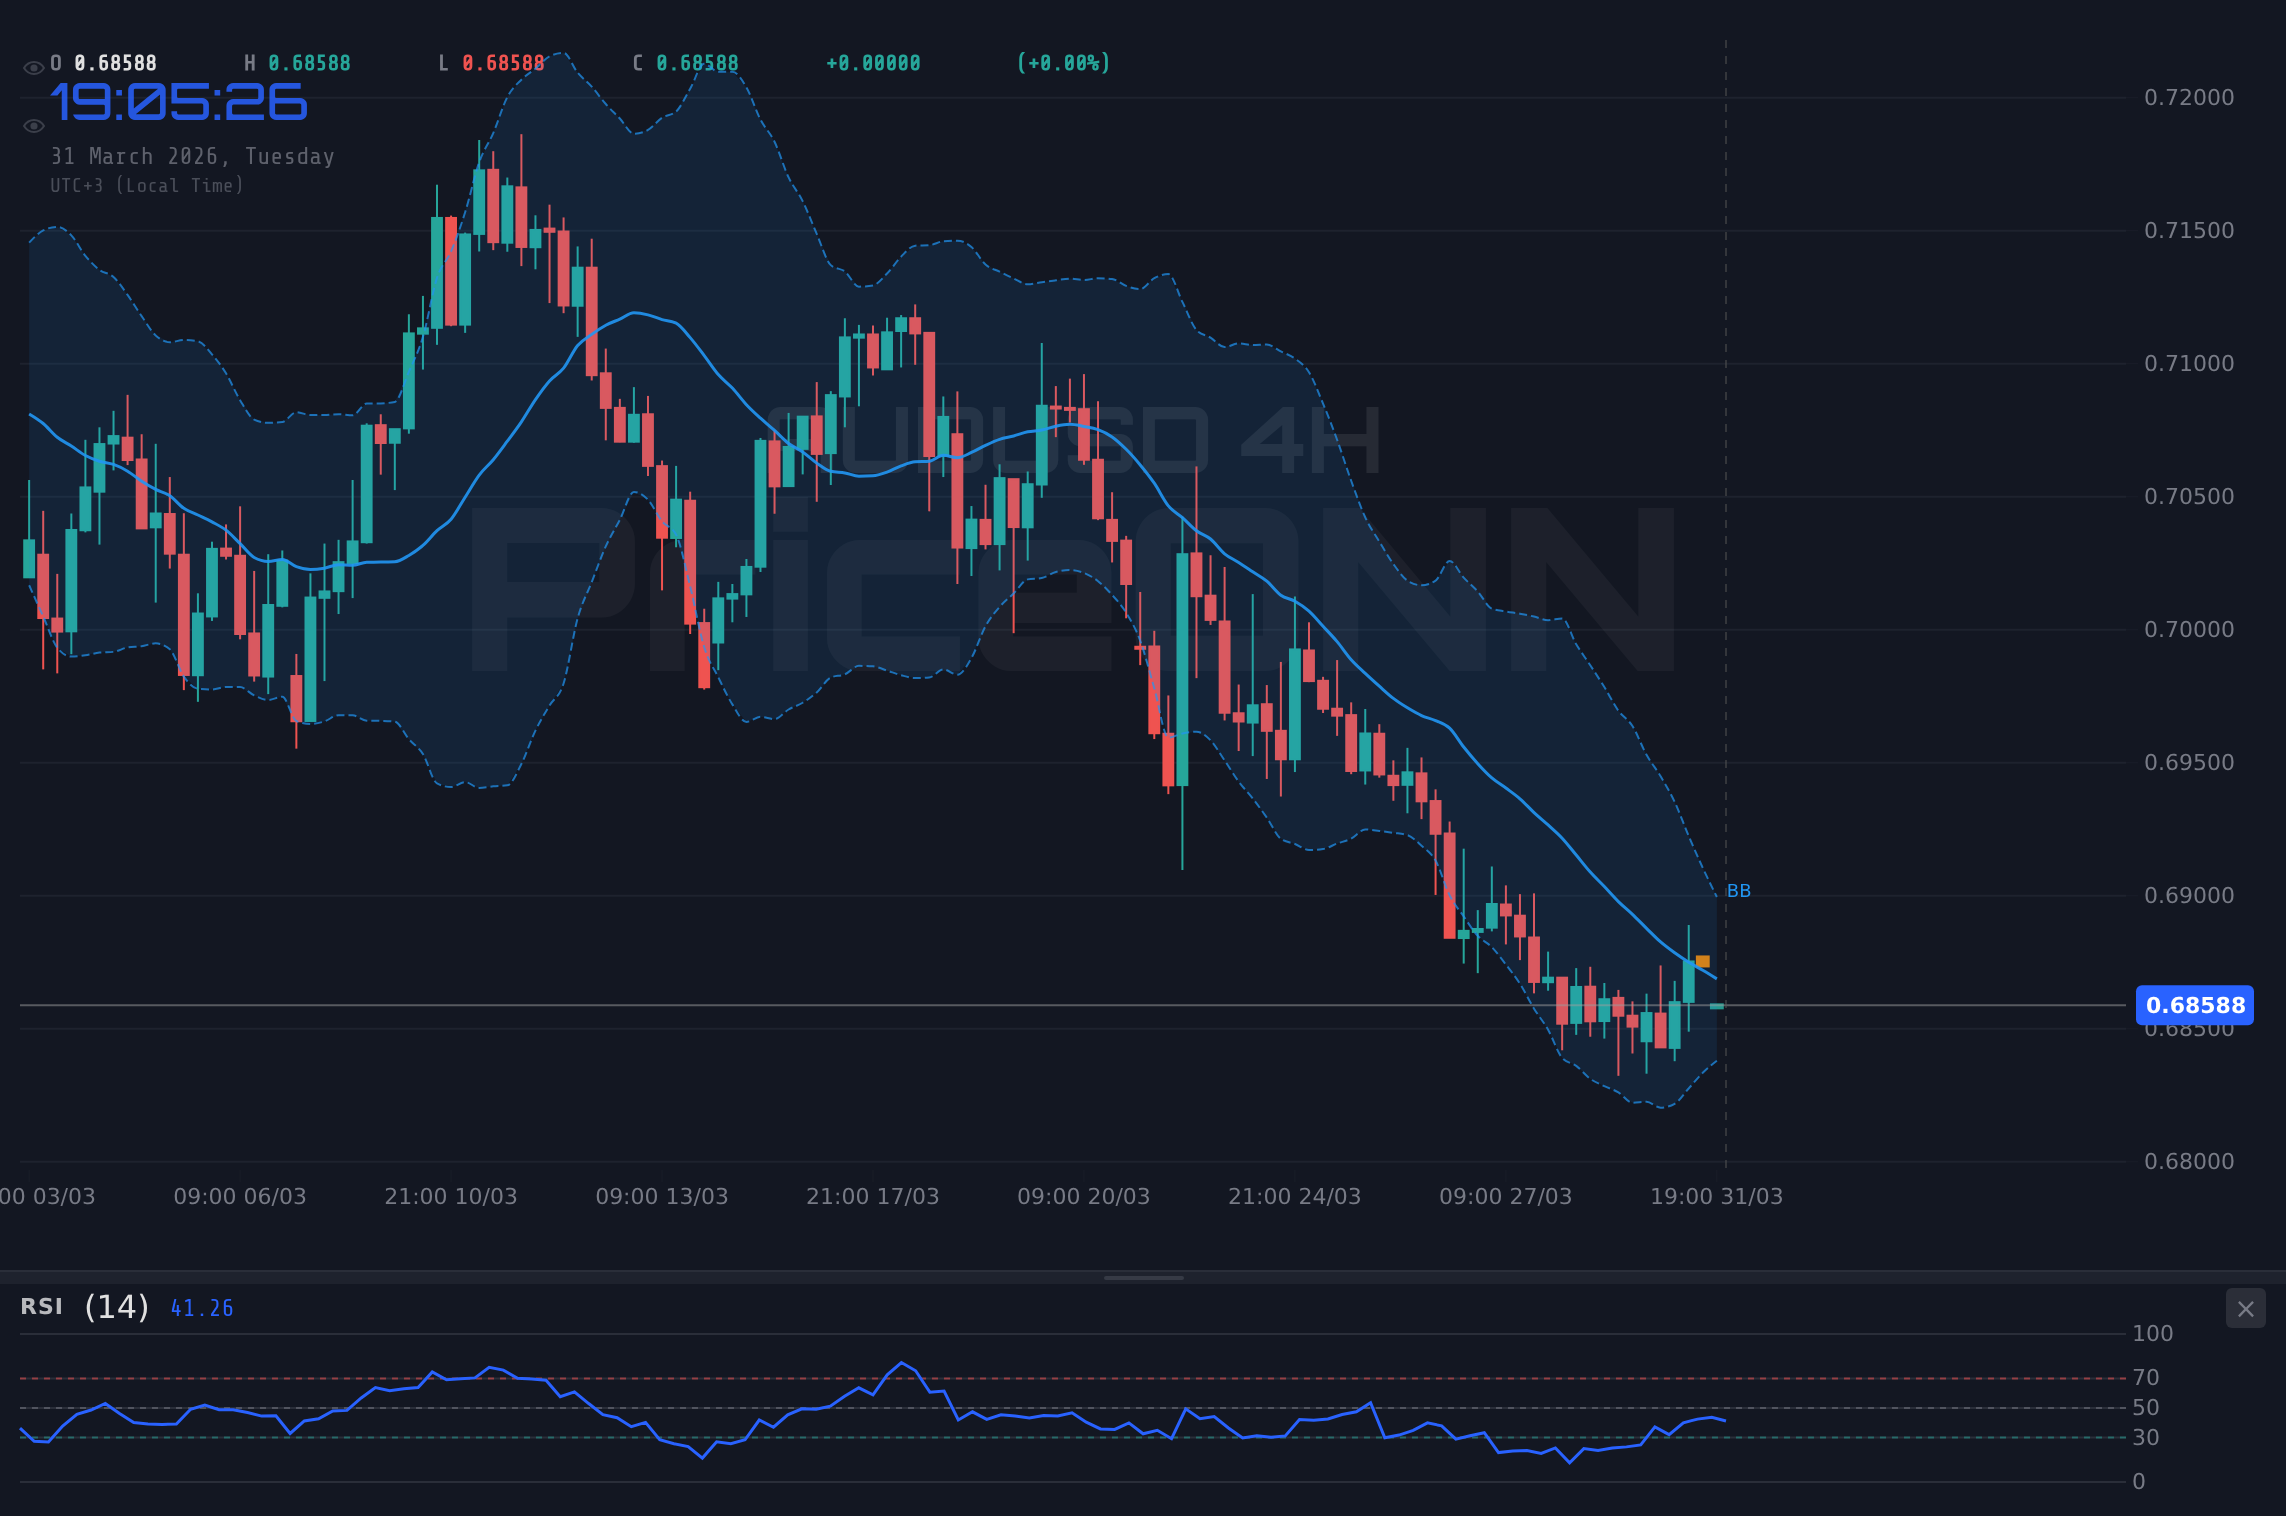
Diving deeper into the 4-hour chart, the picture becomes more mixed, reflecting the broader market's indecision. The trend is classified as neutral with a 50% strength, and the RSI(14) at 43.72 is in line with the bearish lean seen on the 1-hour chart. However, the MACD here is showing positive momentum, and Stochastic %K is above %D, indicating a potential for upward movement. Yet, the ADX at 33.85 signals a strong downtrend, which contradicts the shorter-term signals. This conflict between indicators on the 4-hour chart underscores the current consolidation phase, where the pair might be coiling for a more significant move. The support levels at 0.68425 and 0.68251 are crucial; a break below these could confirm the bearish lean suggested by the ADX.
The daily timeframe offers a starker perspective, with the trend firmly in the bearish camp (89% strength). The RSI(14) at 36.6 indicates bearish sentiment, and the MACD is firmly in negative territory, below its signal line. Bollinger Bands are also positioned below the middle band, reinforcing the downward pressure. The Stochastic indicator, however, shows %K (5.49) significantly below %D (15.52), suggesting the pair is in oversold territory, potentially setting up for a bounce. This divergence between the RSI and Stochastic on the daily chart is noteworthy. While the overall trend is bearish, the oversold conditions on Stochastic could provide a temporary reprieve or a short-covering rally. The key support levels on the daily chart are at 0.6831, 0.68111, and 0.67900. A sustained move above the immediate resistance at $0.68720 would be needed to challenge the prevailing bearish sentiment.
The Influence of Global Events on AUDUSD
The current market environment is heavily dictated by macroeconomic factors and geopolitical developments, which are providing a constant stream of potential catalysts for currency pairs like AUDUSD. The ongoing geopolitical tensions in the Middle East, particularly concerning energy supply routes, have kept crude oil prices elevated. Brent crude trading above $110 and WTI above $104 directly impacts inflation expectations globally. Higher energy costs translate to higher transportation and production costs, feeding into broader inflationary pressures. This scenario often leads central banks, including the RBA and the US Federal Reserve, to adopt or maintain a hawkish monetary policy stance.
The US Dollar Index (DXY), currently around 99.92, is a crucial barometer for AUDUSD. When the DXY strengthens, it typically exerts downward pressure on pairs like AUDUSD, as the Australian dollar becomes relatively more expensive for holders of US dollars. The current strength of the DXY, despite a slight pullback today, is underpinned by its safe-haven appeal amid global uncertainties. This dynamic suggests that any positive news for the Australian economy might struggle to gain traction against a robust US dollar, especially if geopolitical risks continue to escalate.
Looking ahead, upcoming economic data releases will be critical. For the Australian dollar, any significant data points from Australia related to inflation, employment, or GDP will be closely watched. For instance, if upcoming inflation figures from Australia (previous was 0.2) surprise to the upside, it could reinforce the RBA's hawkish narrative and provide a boost to the AUD. Conversely, weaker-than-expected employment numbers or a significant downturn in GDP growth could dampen RBA's tightening prospects and weigh on AUDUSD. On the US side, any indication from the Federal Reserve, or key economic releases like employment data (previous was 6.946 million jobs added) or inflation figures, will heavily influence the DXY and, by extension, AUDUSD.
Navigating the Risk Landscape: Powell's Speech and Future Outlook
The upcoming speech by Federal Reserve Chair Jerome Powell will be a pivotal moment for market participants. While specific dates for his next address are not provided in the live data, any commentary from Fed officials regarding inflation, interest rates, and economic outlook carries significant weight. If Powell reiterates a data-dependent approach but emphasizes the persistence of inflation, it could embolden the DXY and put further pressure on AUDUSD. Conversely, any hints of a potential pause or pivot in monetary policy, perhaps due to signs of cooling inflation or a significant economic slowdown, could weaken the dollar and offer a reprieve for the Aussie. The market's reaction will depend heavily on the nuances of his language and the prevailing economic context at the time.
The current technical setup for AUDUSD at $0.68610 presents a challenging environment. Resistance at $0.68775 on the 1-hour chart, coupled with a bearish lean in momentum indicators like RSI (47.29), suggests that breaking higher will require significant buying pressure. The support at $0.68262 remains a key level to watch; a decisive break below this could open the door for further declines towards $0.67749. The conflicting signals across different timeframes - bearish ADX on the daily and 1-hour charts versus potential oversold conditions on the daily Stochastic - indicate a market in flux. Traders are likely adopting a cautious approach, waiting for a clearer signal or a significant catalyst to emerge.
Given the current market sentiment, characterized by geopolitical uncertainty and a hawkish undertone from central banks, the path of least resistance for AUDUSD might still lean towards caution. While the RBA's stance provides some fundamental support for the Australian dollar, the strength of the US dollar, driven by safe-haven demand and inflation concerns, presents a formidable obstacle. The $0.68610 level represents a critical juncture where the opposing forces are battling for control. Without a clear break above the immediate resistance or a significant shift in the global risk sentiment, the pair could remain range-bound or even drift lower.
The interplay between the RBA's domestic policy considerations and the global macroeconomic backdrop is the central theme for AUDUSD. As traders digest Powell's potential commentary and upcoming economic data, the $0.68610 level will remain under intense scrutiny. The resilience of oil prices and the DXY's firm footing suggest that the headwinds for AUDUSD are substantial. However, if Australian economic data continues to surprise on the upside, or if global risk appetite suddenly returns, the pair could find renewed strength. For now, the market seems to be pricing in a degree of caution, making any upward moves on AUDUSD at $0.68610 a potential opportunity for sellers to re-enter the market, targeting the support levels below.
Bearish Scenario: Downside Risk Prevails
65% ProbabilityNeutral Scenario: Range-Bound Consolidation
25% ProbabilityBullish Scenario: RBA Hawkishness Wins Out
10% ProbabilityFrequently Asked Questions: AUDUSD Analysis
What happens if AUDUSD breaks below the $0.68425 support level?
A break below $0.68425 on AUDUSD would likely confirm the bearish trend indicated by the daily ADX at 33.85. This could trigger a move towards the next support at $0.68251, as sellers gain control amid global risk aversion.
Should I consider selling AUDUSD at current levels near $0.68610 given the DXY strength?
Selling AUDUSD at $0.68610 is a possibility if you are betting on continued DXY strength and risk-off sentiment. However, the daily Stochastic is oversold, suggesting potential for a bounce. A confirmed break below $0.68425 would strengthen the bearish case.
Is the RSI at 47.29 a sell signal for AUDUSD on the 1-hour chart?
An RSI of 47.29 on the 1-hour chart indicates bearish momentum, but it is not yet in oversold territory. While it suggests selling pressure is present, it doesn't signal an immediate strong sell on its own. Confirmation from price action breaking support is crucial.
How will upcoming RBA comments or US employment data affect AUDUSD?
Hawkish comments from the RBA could support AUDUSD, but strong US employment data would likely boost the DXY and counteract any Aussie gains. Traders should watch for surprises in both releases, as they will significantly influence the direction around the $0.68610 level.
The market is a dynamic interplay of fundamental drivers and technical reactions. While the RBA's hawkish posture offers a glimmer of hope for AUDUSD bulls, the persistent geopolitical risks, elevated oil prices, and the consequent strength of the US dollar present significant hurdles. The $0.68610 level remains a critical point of contention, with the bears seemingly having a slight edge due to the prevailing risk-off sentiment and the bearish daily trend. However, potential oversold conditions on the daily Stochastic suggest that a bounce is not out of the question. Patience and disciplined risk management will be key for traders navigating this complex landscape, waiting for a clearer signal or a decisive break of key levels.
Track markets in real-time
AI-powered analysis, technical indicators and real-time price data.
Join Our Telegram Channel
Breaking market news, AI analysis and trading signals instantly.
Join Channel