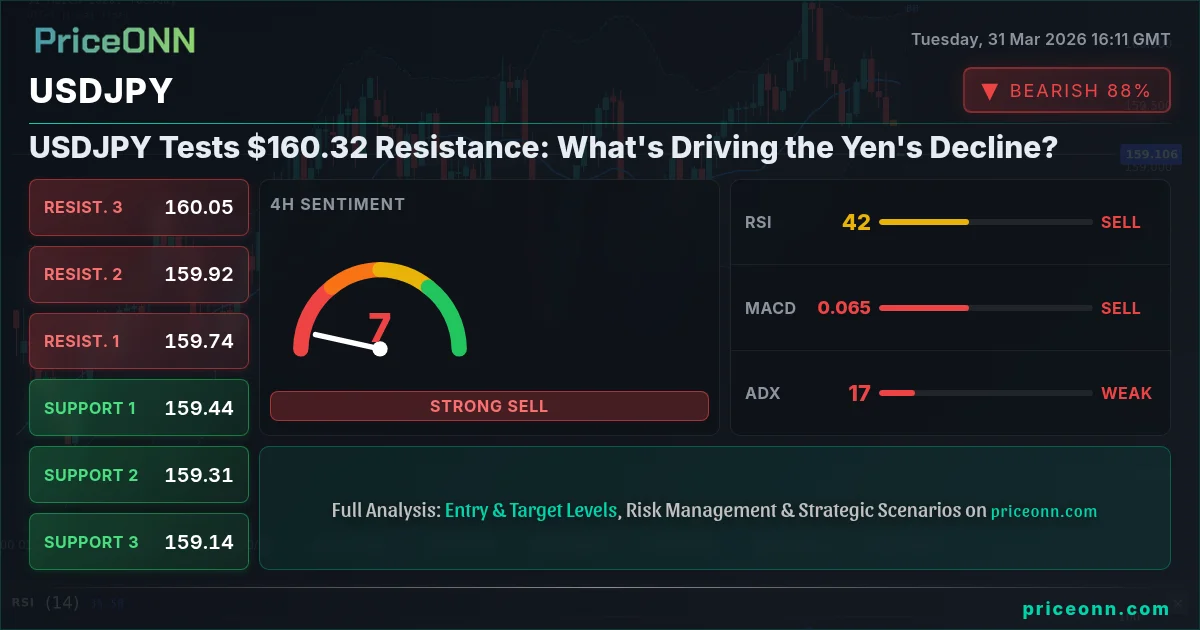
USDJPY Tests $160.32 Resistance: What's Driving the Yen's Decline?
USDJPY surged to $159.10, testing critical resistance at $160.32. With the DXY strengthening and the Bank of Japan signaling a potential policy shift, the yen faces intense pressure.
The USDJPY pair is currently trading at $159.10, a level that has seen significant attention as it hovers near a crucial resistance point. This dynamic is unfolding amidst a strengthening US Dollar Index (DXY) and growing speculation about the Bank of Japan's (BoJ) monetary policy stance. Traders are closely watching whether the pair can break through the $160.32 resistance, a move that could signal further Yen weakness and potentially test higher levels, or if current geopolitical and economic pressures will force a retracement. The interplay between US interest rate expectations, Japanese intervention fears, and broader market risk sentiment is creating a complex but compelling trading environment for this major currency pair.
- USDJPY is currently trading at $159.10, approaching the significant resistance level of $160.32.
- The US Dollar Index (DXY) shows a strong upward trend on the daily chart, currently at 100.98, providing underlying support for USD strength.
- The RSI(14) on the 1-hour chart for USDJPY is at 31.74, indicating oversold conditions that might precede a short-term bounce, though the daily trend remains bullish.
- Geopolitical tensions, particularly in the Middle East and their impact on oil prices, are creating inflationary pressures that could influence Fed policy and, by extension, USDJPY dynamics.
The current price action for USDJPY at $159.10 paints a picture of a market on the cusp of a significant move. On the 1-hour timeframe, the trend is decidedly bearish with a power of 96%, indicated by the ADX at 22.52. This suggests that while the short-term might show some volatility, the broader momentum is pushing downwards. However, this short-term bearish signal is contrasted by a daily trend that is strongly bullish, with a power of 87% and an ADX of 23.2. This divergence between timeframes is crucial; it suggests that the current dip might be a temporary correction within a larger upward trend, rather than a fundamental shift in direction. The key lies in how the pair reacts around the $159.10 mark and whether it can sustain its upward trajectory towards the critical $160.32 resistance.
Navigating the Yen's Weakness: Dollar Strength and BoJ Uncertainty
The US Dollar Index (DXY) is currently showing a strong bullish trend on its daily chart, trading at 100.98 with 100% power. This strength in the dollar is a significant factor underpinning the USDJPY's upward momentum. As the DXY rises, it naturally exerts downward pressure on other currency pairs, including USDJPY. The Fed's hawkish stance, or at least the market's anticipation of it, continues to support dollar strength. However, the narrative is complicated by the Bank of Japan. Recent reports suggest the BoJ might be signaling a shift in its ultra-loose monetary policy, driven by concerns over inflation and the weakening yen. This potential policy pivot, even if subtle, creates significant uncertainty and could be a catalyst for increased volatility in USDJPY. The market is grappling with whether the BoJ will intervene to support the yen or allow the current trend to continue, especially with USDJPY hovering near levels that have previously prompted intervention fears.
Technically, the 1-hour chart for USDJPY presents a mixed picture. While the trend is bearish with an ADX of 22.52, the RSI(14) is sitting at 31.74, deep in oversold territory. This reading, coupled with a Stochastic %K of 9.83 and %D of 23.64, suggests that a short-term bounce is possible. However, the MACD is showing negative momentum, indicating that sellers are still in control on this timeframe. The Bollinger Bands are also below the middle band, reinforcing the bearish sentiment for intraday traders. This short-term oversold condition is a key point of attention; it could offer a brief window for a counter-trend move, but it's unlikely to derail the larger bullish trend unless confirmed by fundamental shifts or a decisive break of key intraday support levels.
Geopolitical Shocks and Inflationary Headwinds
The global economic landscape is currently dominated by escalating geopolitical tensions, particularly in the Middle East. The surge in crude oil prices, with Brent crude trading at $110.39 and WTI at $104.50, is a significant inflationary driver. This rise in energy costs has broader implications, potentially forcing central banks, including the Federal Reserve, to maintain a more hawkish stance on interest rates for longer. Higher interest rates in the US typically strengthen the dollar, which, as discussed, provides a tailwind for USDJPY. The market is keenly analyzing how these inflationary pressures will play out and whether they will prompt a more aggressive response from the Fed, further widening the interest rate differential between the US and Japan. This macro backdrop is critical; it provides the fundamental justification for the dollar's strength and, consequently, the pressure on the yen.
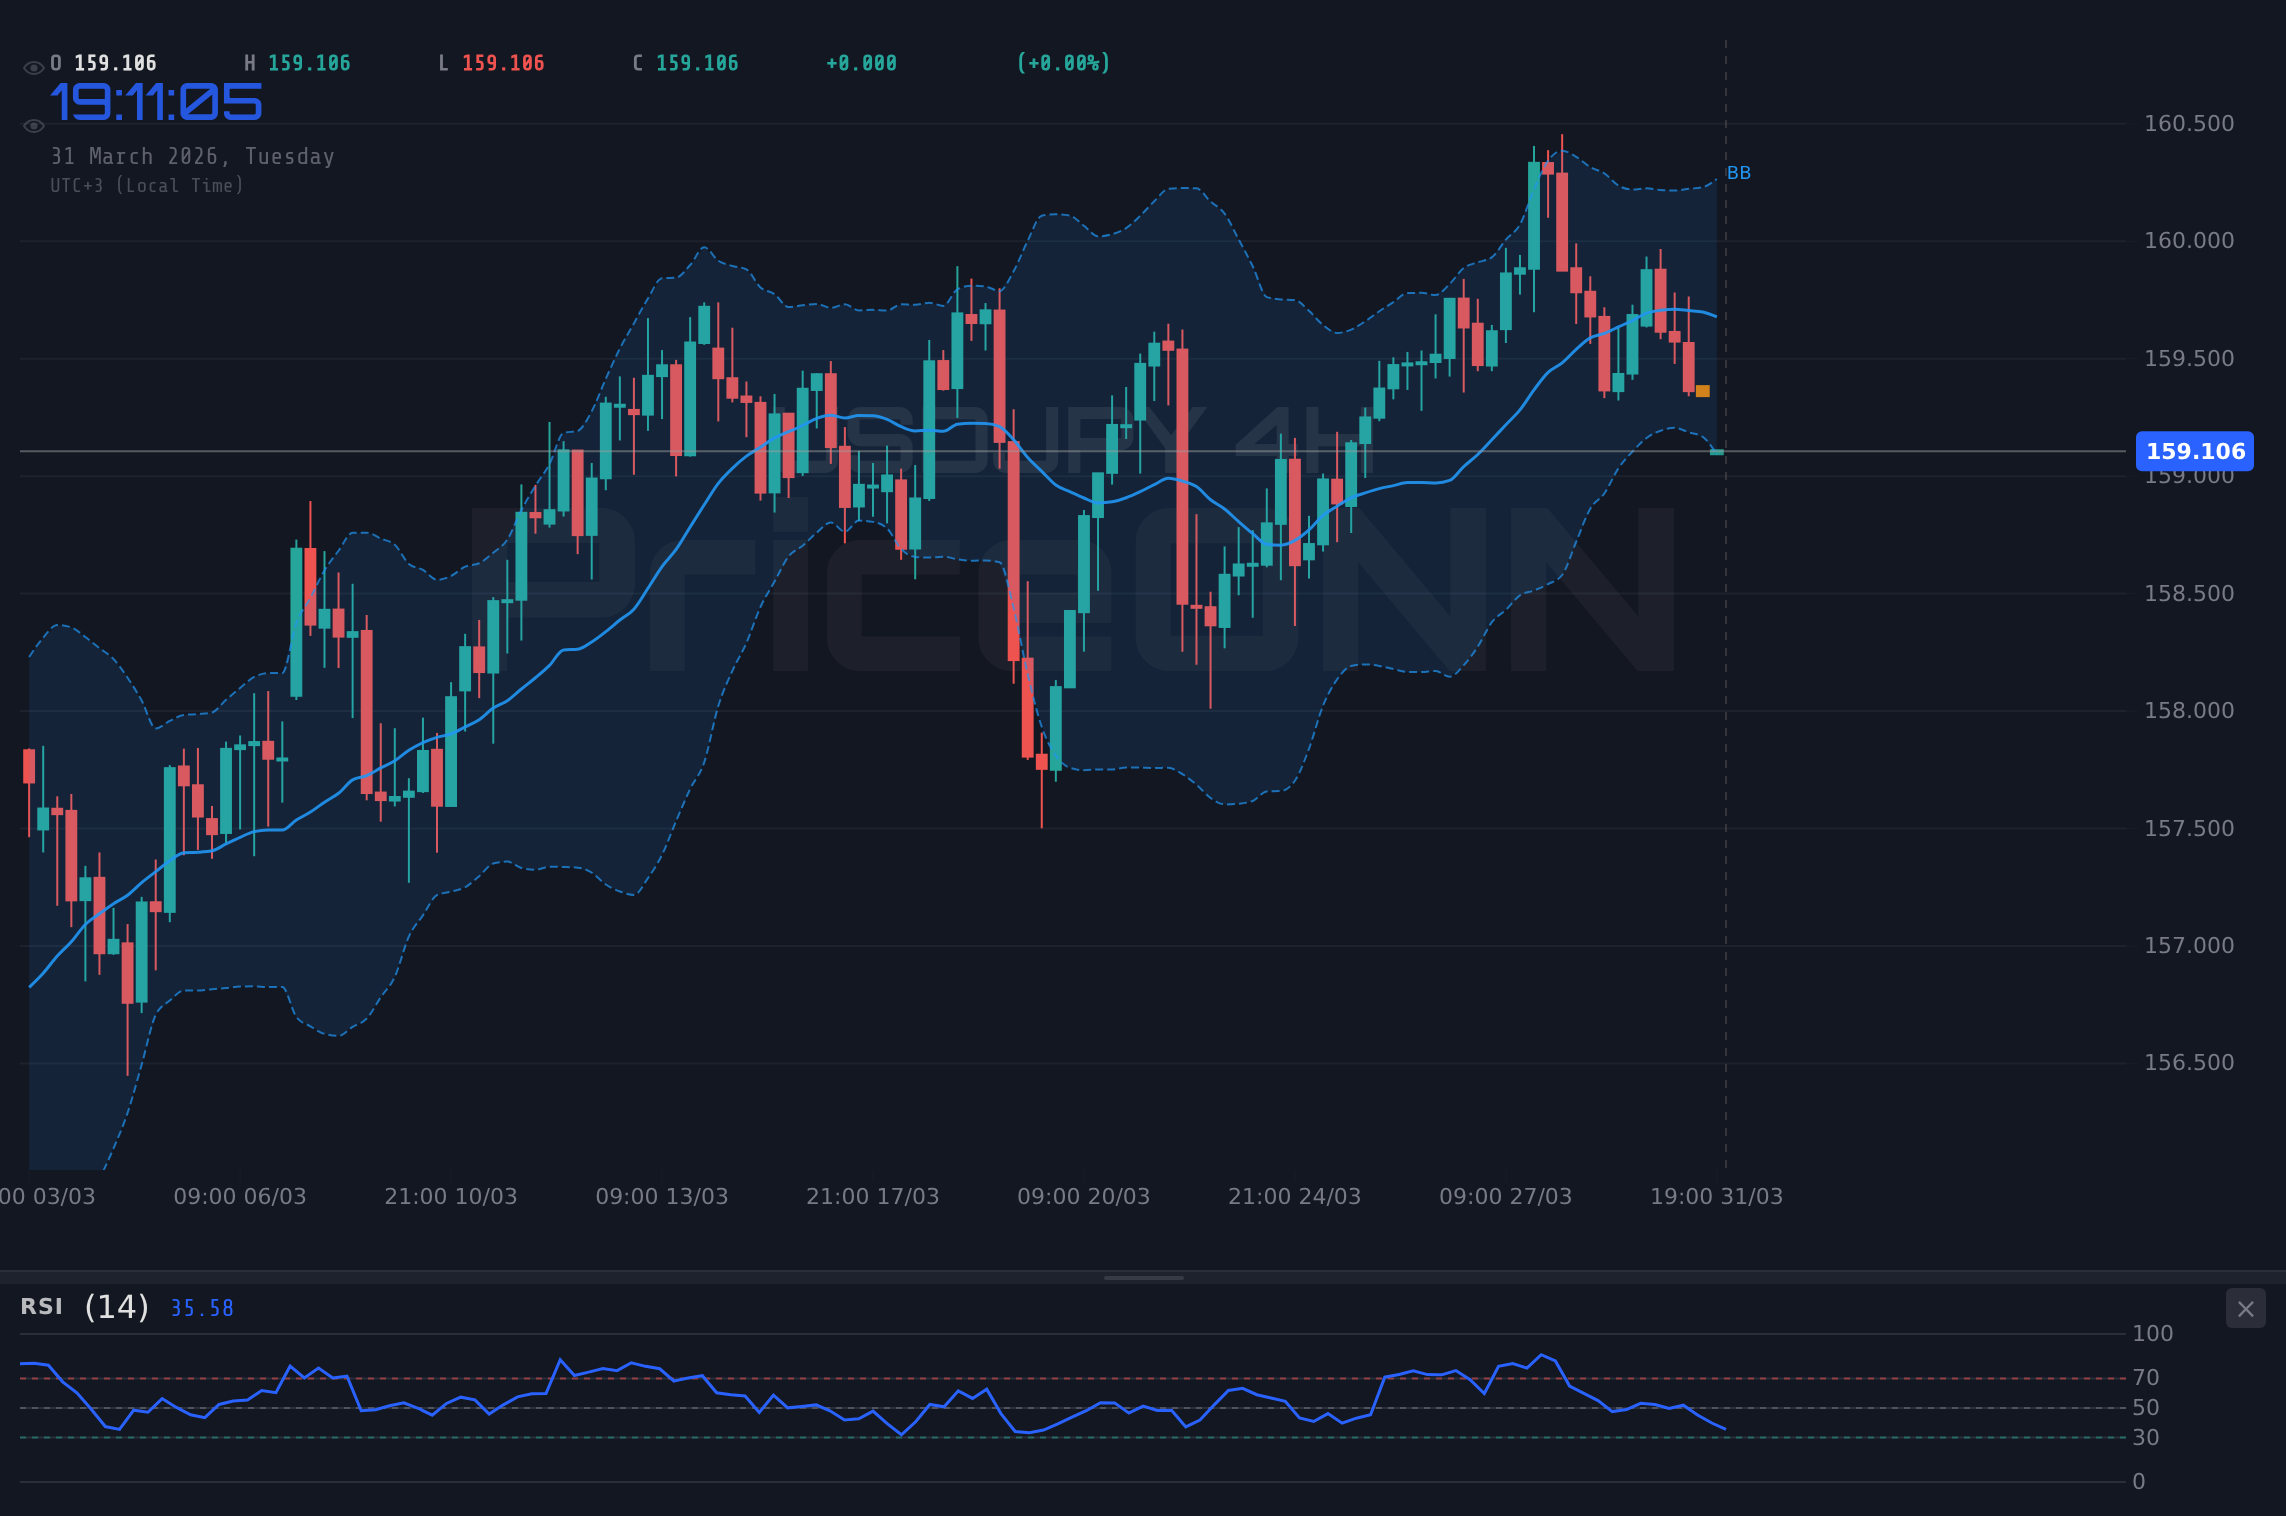
Looking at the 4-hour chart, the trend is neutral with 50% power, and the ADX is at 17.37, indicating a weak trend and a more horizontal trading range. The RSI(14) is at 42.01, suggesting room for further downside before becoming oversold on this timeframe. The MACD is below its signal line, confirming negative momentum. Stochastic K is 15.99 and D is 23.54, both in oversold territory, signaling a potential for a bounce. However, the overall signal for this timeframe is SAT (Sell), with 7 out of 8 indicators suggesting a sell. This neutral-to-bearish short-to-medium term outlook on the 4-hour chart contrasts with the strong daily bullish trend, highlighting the importance of multiple timeframe analysis for traders. The key support level on this timeframe is around $159.136, followed by $158.687.
The BoJ's Dilemma: Intervention Fears and Policy Signals
The Bank of Japan faces a challenging situation. As USDJPY approaches and potentially breaches the $160.00 level, the pressure for intervention intensifies. Historically, Japanese authorities have intervened to support the yen when it weakened excessively. However, the effectiveness and timing of such interventions are always debated. Some analysts suggest the BoJ may be signaling a gradual shift away from its ultra-loose monetary policy. This could involve ending negative interest rates or adjusting its yield curve control policy. Such a shift, even if gradual, would represent a significant change and could provide some support for the yen. The market is trying to decipher these signals, looking for concrete actions rather than mere rhetoric. The recent news that USD/JPY retreated below the 160.00 mark on Monday, closing around 159.70 after touching a year-to-date high near 160.50, illustrates this delicate balance between intervention fears and the underlying bullish trend.
On the daily chart, the trend is strongly bullish (87% power) with an ADX of 23.2, indicating a medium-strength trend. The current price of $159.10 is well above the middle Bollinger Band, suggesting an upward bias. The RSI(14) at 55.04 is in neutral territory, but showing a slight upward tendency. Stochastic K (74.53) and D (71.01) are both in the upper half of their range, with %K > %D, signaling a bullish trend. The MACD, however, shows negative momentum, which is a point of caution. Despite this, the overall signal for the daily timeframe leans towards BUY, with 5 out of 8 indicators suggesting a buy. The significant resistance level to watch on the daily chart is $160.321, followed by $160.955 and $161.455. The primary support on this timeframe is $159.187.
Correlation with Equities and Gold: A Risk-On/Risk-Off Play?
The correlation between USDJPY, major equity indices like the S&P 500 and Nasdaq 100, and gold prices (XAUUSD) offers further insight into market sentiment. Currently, the S&P 500 is trading at 6438.45, showing a strong daily rise of 1.56%, and the Nasdaq 100 is at 23339.25, up 1.82%. This suggests a 'risk-on' environment, which typically supports USDJPY as investors move away from safe-haven assets like the yen. Conversely, XAUUSD is trading at $4618.32, up a significant 2.38%. While gold is often seen as a safe haven, its recent surge alongside equities might indicate a broader inflationary concern driving both risk assets and precious metals. If risk appetite were to falter, we might see a shift where equities and USDJPY decline, while gold and potentially the yen strengthen. The current confluence of rising equities, rising gold, and a rising USDJPY suggests that the primary driver is likely dollar strength and inflation fears, rather than a clear risk-on/risk-off dynamic.
The 1-hour chart indicators are predominantly bearish, with a strong sell signal (8 out of 8 indicators). This suggests that intraday traders might be looking for opportunities to sell into strength or fade rallies. The oversold RSI at 31.74 and Stochastic readings could provide short-lived upward corrections, but the persistent negative MACD momentum and ADX at 22.52 indicate that the downtrend on this timeframe is likely to continue in the immediate short term. Key intraday support levels are $158.995 and $158.896. A break below these could accelerate the downward move on the 1-hour chart, although the daily bullish trend remains the dominant narrative.
The Path Forward: What to Watch for USDJPY
The immediate future for USDJPY hinges on several key factors. Firstly, the price action around the $159.10 level and the ability to challenge the $160.32 resistance is paramount. A decisive break above $160.32, especially on increasing volume, would confirm the continuation of the bullish trend on the daily chart and could open the door for further upside. Conversely, a failure to break resistance and a subsequent retreat below intraday support levels like $158.995 could signal a deeper correction. Secondly, market sentiment regarding the Fed's policy path will be crucial. Any indications of continued hawkishness or a delayed rate-cut cycle would likely boost the dollar and USDJPY. Finally, any explicit signals or interventions from the Bank of Japan could dramatically alter the trajectory, potentially leading to sharp yen appreciation. Traders should also keep a close eye on the DXY's movements; its current bullish trend at 100.98 provides a strong foundation for dollar strength.
The divergence in signals across different timeframes is a classic feature of markets at inflection points. The 1-hour chart signals are heavily bearish, suggesting intraday weakness, while the 4-hour chart shows a neutral to bearish leaning. Yet, the daily chart presents a robust bullish trend. This complexity means that a breakout above $160.32 on the daily chart would be a significant event, likely requiring confirmation from a shift in the shorter-term technicals or a clear fundamental catalyst. Conversely, a sustained move below the daily support at $159.187 would challenge the bullish thesis, even if the longer-term trend remains intact.
Bearish Scenario: Yen Reclaims Ground
65% ProbabilityBullish Scenario: Dollar Dominance Continues
25% ProbabilityConsolidation: Waiting for Clarity
10% ProbabilityFrequently Asked Questions: USDJPY Analysis
What happens if USDJPY breaks above the $160.32 resistance level?
A decisive break above $160.32 would confirm the bullish daily trend and could target the next resistance at $160.955. This would likely be driven by continued dollar strength and potential BoJ policy inaction or ambiguity.
Is the RSI at 31.74 a buy signal for USDJPY right now?
An RSI of 31.74 on the 1-hour chart indicates oversold conditions, suggesting a potential for a short-term bounce. However, given the strong daily bullish trend, this might be a dip to buy into rather than a signal for a sustained reversal. Confirmation from other indicators and price action is key.
How will ongoing geopolitical tensions affect USDJPY this week?
Escalating geopolitical tensions, particularly in the Middle East, are driving oil prices up and contributing to inflation fears. This generally supports the US dollar by increasing demand for safe-haven assets and potentially influencing Fed policy, thus providing an indirect tailwind for USDJPY.
Should I consider selling USDJPY if it fails to hold above $159.10?
A failure to hold $159.10 and a subsequent break below the key intraday support at $158.995 could signal a deeper correction on the shorter timeframes. Traders might consider short positions on a confirmed breakdown, targeting support levels around $158.687, but must remain aware of the dominant daily bullish trend.
Technical Outlook Summary
| Indicator | Value | Signal | Interpretation |
|---|---|---|---|
| RSI (14) | 31.74 | Bearish | Oversold on 1H, suggesting potential bounce. Daily trend remains neutral. |
| MACD | Negative Momentum | Bearish | Sellers in control on 1H; daily MACD shows negative momentum too. |
| Stochastic | K: 9.83, D: 23.64 | Bearish | Oversold on 1H, %K < %D. Suggests further downside potential. |
| ADX | 22.52 | Neutral | Medium strength trend on 1H; overall daily trend is bullish. |
| Bollinger Bands | Below Middle Band | Bearish | Suggests downward pressure on 1H and daily charts. |
Key Levels
Support Levels
Resistance Levels
Track markets in real-time
AI-powered analysis, technical indicators and real-time price data.
Join Our Telegram Channel
Breaking market news, AI analysis and trading signals instantly.
Join Channel