DXY Tests $99.86 Support Amid Powell Speech; Dollar Strength Tested
The Dollar Index (DXY) is approaching critical support at $99.86. Traders watch Powell's speech for clues on Fed policy and potential dollar direction.
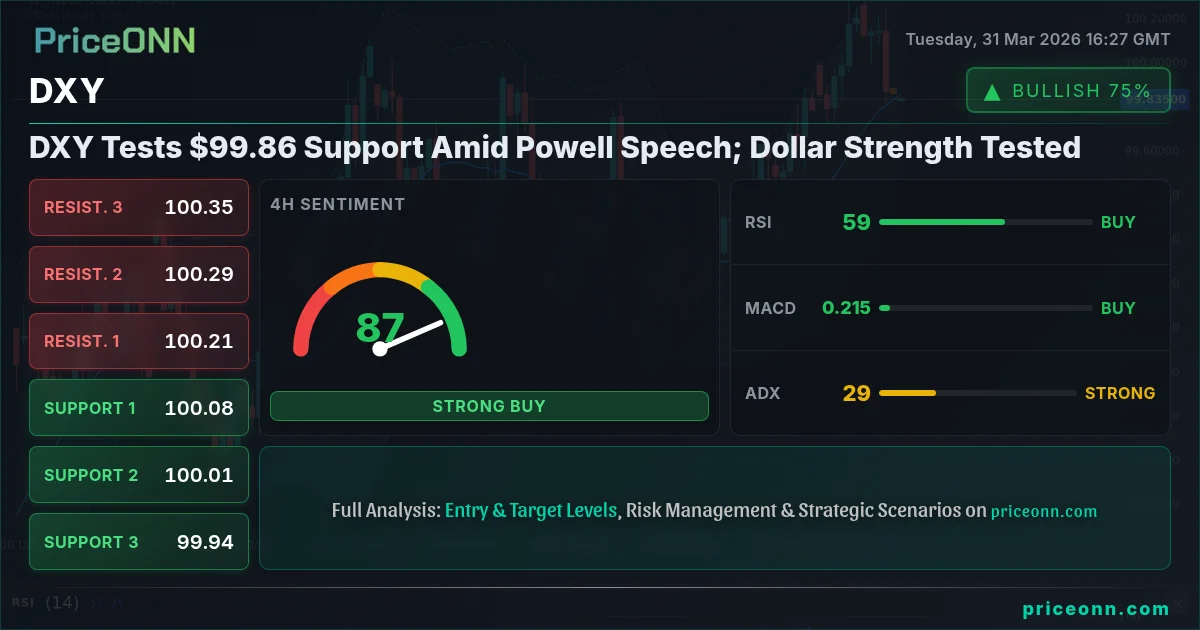
The Dollar Index (DXY) is currently navigating a pivotal moment, hovering just above the significant support level of $99.86. This strategic juncture arrives as markets keenly await insights from Federal Reserve Chair Jerome Powell's upcoming speech, a key event that could significantly sway the dollar's trajectory amidst a complex geopolitical and economic landscape. With the DXY trading at precisely $100.00, its recent push lower signals a potential shift in market sentiment, prompting a closer examination of the underlying technical and fundamental drivers.
- The DXY is testing critical support at $99.86, with the current price at $100.00.
- Powell's speech is a key focus for insights into future Fed policy and its impact on dollar strength.
- Geopolitical tensions, particularly the Middle East conflict, are pushing crude oil prices past $100, creating inflationary pressures that influence Fed decisions.
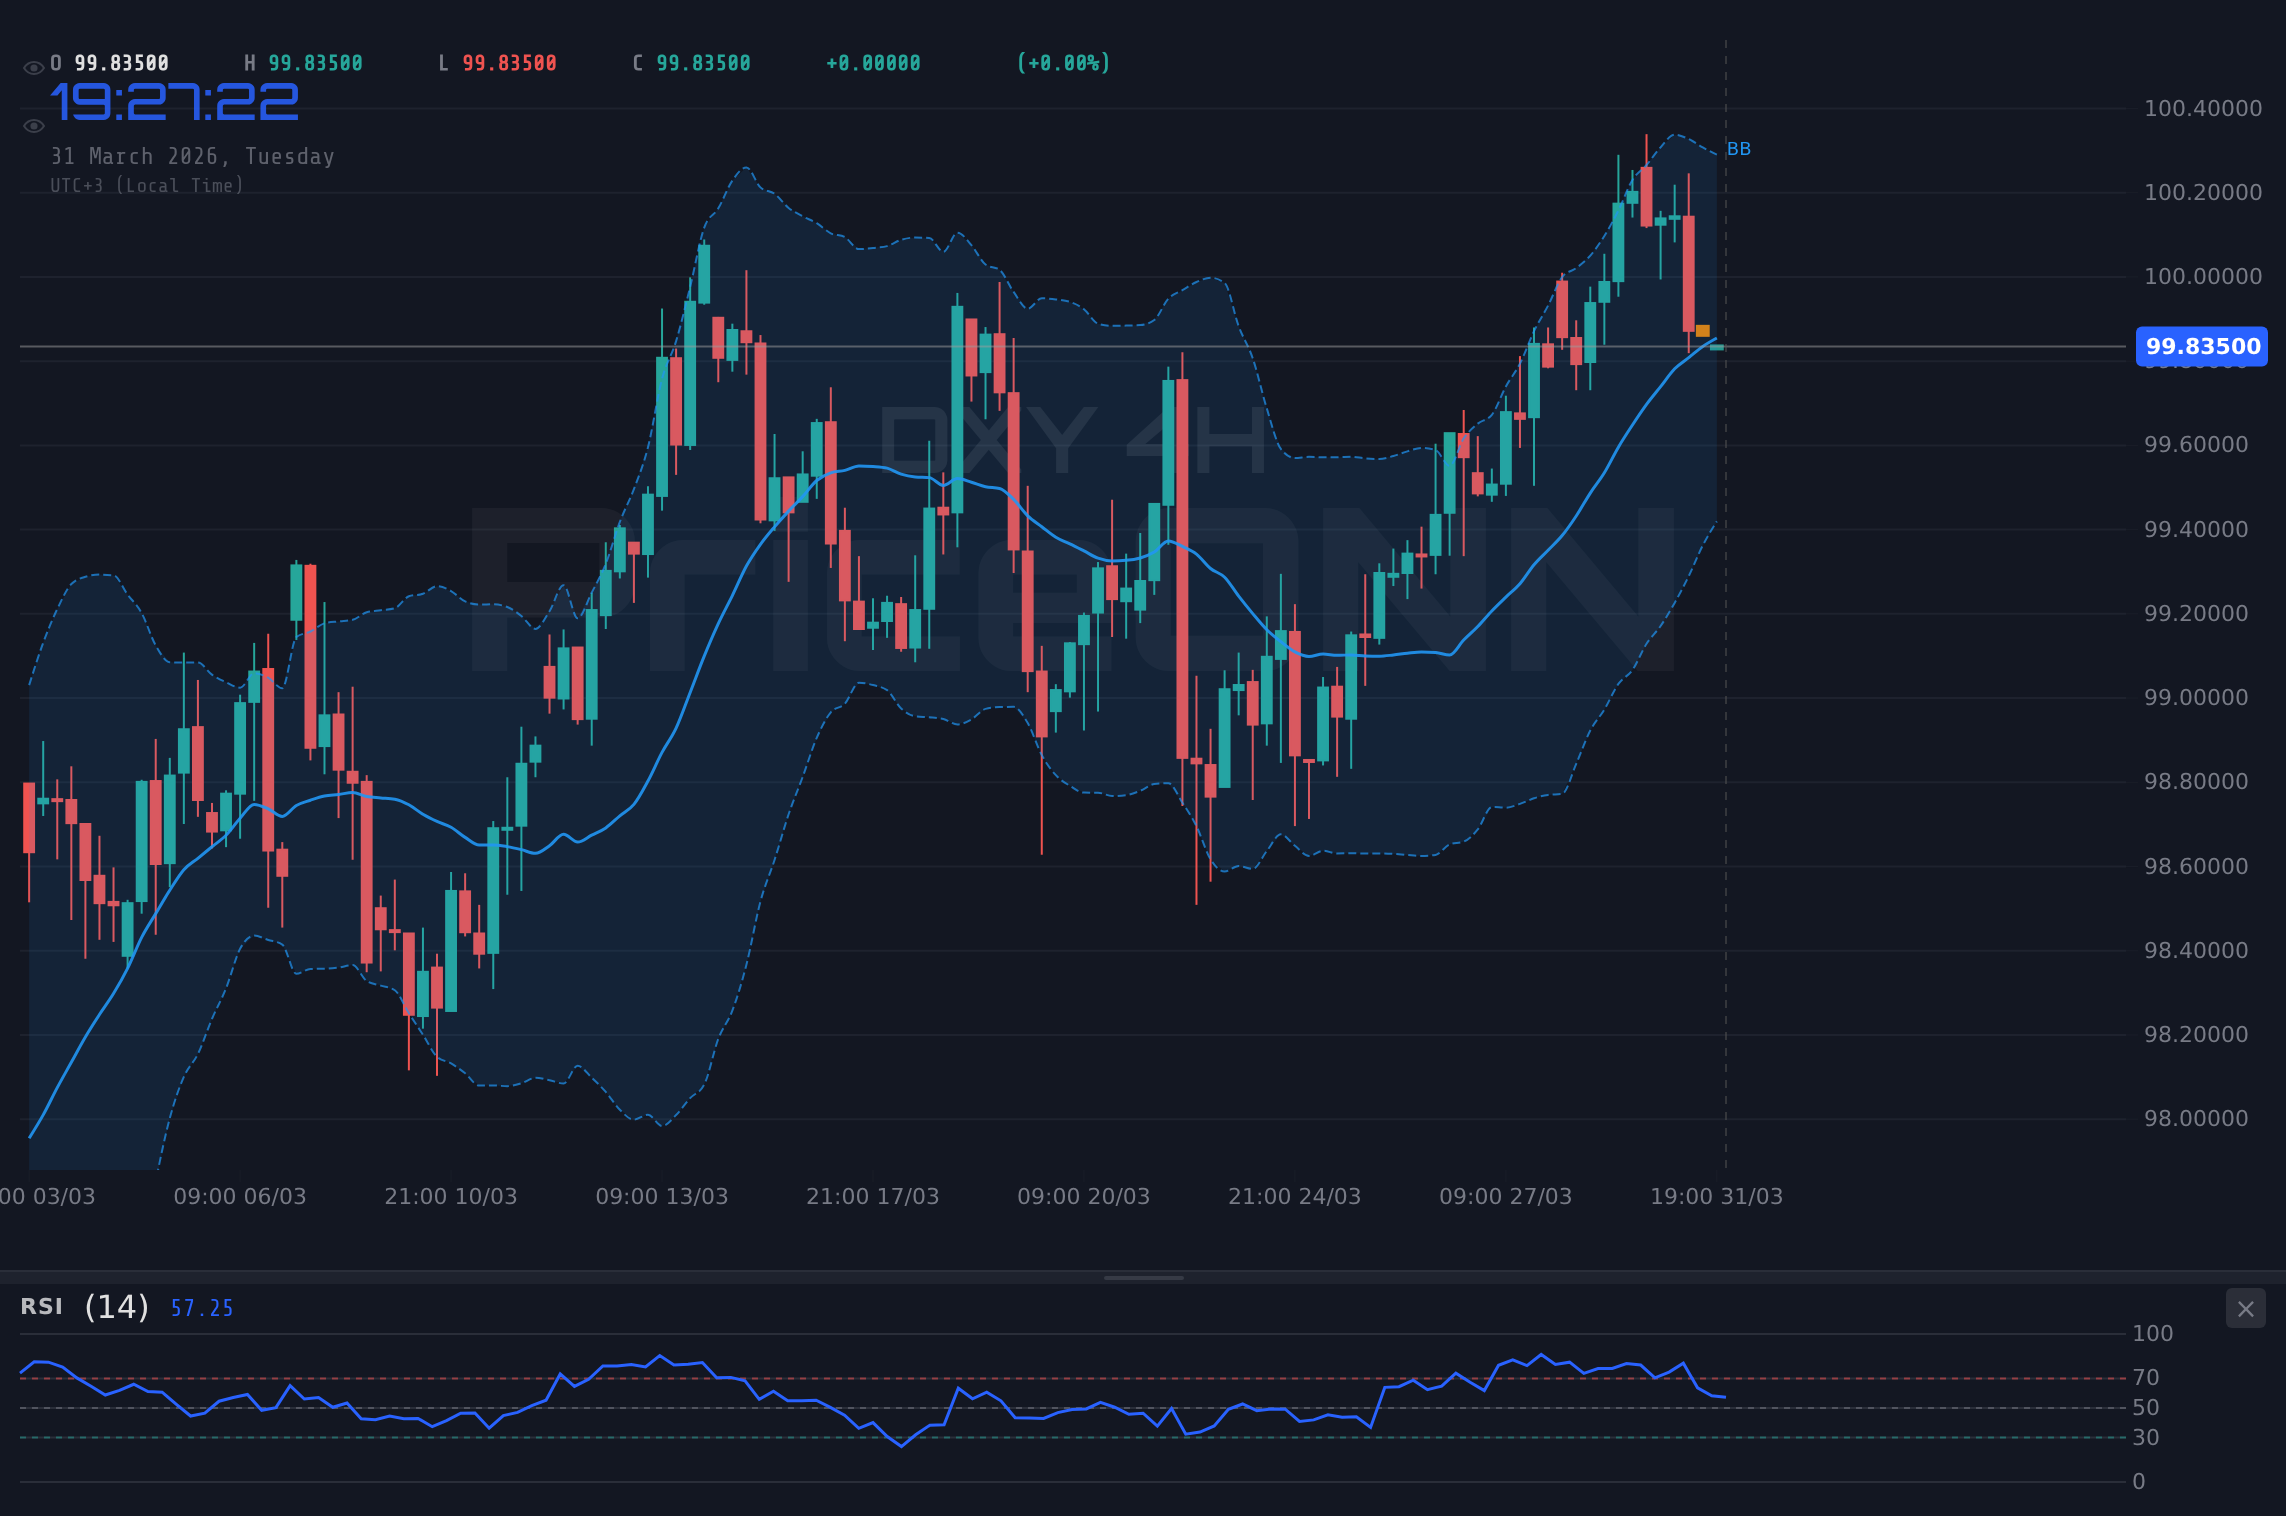
- Technical indicators show mixed signals across timeframes, with 1H and 4H showing bullish DXY trends while the daily chart suggests a potential downturn.
The narrative surrounding the US dollar is increasingly intricate, shaped by a confluence of factors ranging from domestic monetary policy expectations to global geopolitical flare-ups. The current price action for the DXY, trading at $100.00, reflects a delicate balance. While the daily chart shows a bearish signal with an ADX of 34.5 indicating a strong downtrend, the shorter timeframes (1H and 4H) present a more bullish picture with ADX readings of 28.79 and 34.5 respectively, and positive momentum signals. This divergence across timeframes suggests a market in flux, where short-term technicals are battling against a potentially stronger daily trend or broader fundamental shifts. The immediate focus remains on the $99.86 support level; a decisive break below this could signal further dollar weakness, while a hold might pave the way for a reversal, especially if Powell's remarks lean hawkish.
Why $99.86 is the Line in the Sand
The Critical Support Test
The DXY's current position at $100.00 brings the support level at $99.86 into sharp focus. This isn't just another technical level; it represents a crucial psychological and structural point that has, historically, acted as a floor during periods of dollar consolidation or correction. If the DXY were to decisively close below $99.86 on a daily basis, it would likely trigger further downside momentum, potentially targeting the next support at $99.52. The 1-hour chart, currently showing a robust uptrend with an ADX of 34.5, might struggle to maintain its upward bias if this key support fails. Conversely, a strong bounce from $99.86, especially if accompanied by hawkish undertones from Powell, could reignite dollar strength and push the index towards the resistance at $100.42, and subsequently $100.63. The Stochastic indicator on the 1-hour chart shows K=31.3 and D=35.57, signaling a bearish outlook in the very short term, which adds to the tension around this support level.
The broader market context, particularly concerning inflation and geopolitical risks, heavily influences the dollar's safe-haven appeal. Crude oil prices, for instance, have surged past $100 per barrel, a development that typically fuels inflation fears. This situation presents a dilemma for the Federal Reserve. On one hand, rising inflation necessitates a tighter monetary policy, which would normally support a stronger dollar. On the other hand, excessive geopolitical shocks could dampen global growth prospects, creating a 'risk-off' environment where the dollar benefits from safe-haven demand, but the Fed might become more cautious about aggressive rate hikes. The latest market data shows Brent crude at $110.84 and WTI at $104.96, underscoring the persistent inflationary pressure. This complex interplay means that Powell's commentary will be scrutinized for any indication of how the Fed plans to balance these competing forces.
Navigating the Fed's Tightrope Walk
Powell's Speech: The Catalyst?
All eyes are on Federal Reserve Chair Jerome Powell's upcoming address. Traders and analysts will be dissecting his every word for clues about the Fed's stance on inflation, interest rates, and the overall economic outlook. If Powell adopts a hawkish tone, emphasizing the need to combat persistent inflation and signaling potential further rate hikes or a slower pace of rate cuts, it would likely bolster the US dollar. This could provide the necessary catalyst for the DXY to rebound from the $99.86 support and aim for higher resistance levels. The daily RSI, currently at 61.27, shows a rising trend, which would align with a hawkish Fed narrative. However, if Powell expresses concerns about economic growth or the impact of geopolitical events on the global economy, it might lead to a more dovish interpretation. In such a scenario, the dollar could face renewed selling pressure, potentially breaking the $99.86 support and accelerating the downtrend indicated by the daily ADX of 34.5.
The correlation between the DXY and other major markets is a critical element in understanding the current price action. A strengthening dollar, driven by hawkish Fed rhetoric or safe-haven flows, typically exerts downward pressure on gold (XAUUSD) and silver (XAGUSD), as well as major currency pairs like EURUSD and GBPUSD. Conversely, a weaker dollar can provide a tailwind for these assets. Currently, XAUUSD is trading at $4612.09, showing a significant daily gain of 2.24%, indicating that market participants are seeking havens or hedging against inflation. XAGUSD is also strong, up 5.4% at $73.87. The EURUSD is trading at 1.15164, showing a modest gain, while GBPUSD is at 1.31797, slightly down. The divergence in these movements suggests that while the dollar is under some pressure, other factors are also at play, making the DXY's direction a crucial determinant for broader market sentiment.
Technical Indicators: A Mixed Bag Across Timeframes
Short-Term Momentum vs. Daily Trend
Examining the technical indicators reveals a complex picture. On the 1-hour timeframe, the DXY exhibits a strong bullish trend (ADX: 34.5, Power: 96%), with positive MACD momentum and RSI at 49.6 showing a slight upward bias from oversold conditions. The Stochastic oscillator, however, shows K=31.3 and D=35.57, indicating a bearish signal in the immediate term. The 4-hour chart presents a similar dynamic, with a bullish trend (ADX: 28.79, Power: 94%) and positive momentum, but the Stochastic shows K=59.48 and D=77.23, suggesting a bearish divergence as the %K line crosses below the %D line. This shorter-term bullish bias seems to be at odds with the daily chart, which displays a more bearish outlook. The daily ADX at 34.5 indicates a strong downtrend, the RSI at 61.27 is rising but still within a range that doesn't scream 'overbought', and the MACD shows negative momentum. This conflict suggests that the market is grappling with conflicting signals, and the outcome will likely hinge on confirmation from Powell's speech and any significant shifts in risk appetite.
The influence of global equity markets on the DXY cannot be overstated. The S&P 500 is up 1.61% at 6441.65, and the Nasdaq 100 has gained 1.88% to 23351.92. This resilience in US equities, despite geopolitical concerns and oil price spikes, suggests that risk appetite might be recovering, or at least holding steady for now. Typically, a strong performance in US indices can correlate with a weaker dollar as investors move out of safe-haven assets. However, the current situation is nuanced. If the Fed remains hawkish, the dollar could strengthen regardless of equity performance, especially if it signals a commitment to bringing inflation under control, even at the cost of short-term economic growth. The Dow Jones 30 is also showing strength, up 1.17% at 45727.5. This broad-based strength in US indices, coupled with the DXY testing support, creates an interesting dynamic that requires careful observation.
The Macroeconomic Backdrop: Inflation vs. Growth Concerns
Balancing Act for the Fed
The Federal Reserve is walking a fine line. On one side, persistent inflation, exacerbated by rising oil prices (Brent at $110.84, WTI at $104.96), demands a firm monetary policy stance. The Fed's mandate includes price stability, and allowing inflation to remain elevated could erode purchasing power and destabilize the economy. On the other side, escalating geopolitical tensions and potential global economic slowdowns warrant caution. Aggressively tightening policy in an environment of fragile global growth could tip the scales towards a recession, a scenario the Fed is keen to avoid. Powell's speech will be crucial in understanding how the Fed perceives this balance. Will they prioritize fighting inflation above all else, or will they signal a more data-dependent approach that considers growth risks? The market's reaction to the DXY's test of $99.86 support will undoubtedly be influenced by these macroeconomic considerations. The current daily RSI of 61.27 suggests there's room for upward movement without immediate overbought conditions, but the negative MACD momentum on the daily chart is a concern.
The interplay between the DXY and other major currencies provides further context. The EURUSD pair is currently trading at 1.15164, showing a slight upward bias, which implies some dollar weakness or euro strength relative to the dollar. The daily trend for EURUSD is bearish (ADX: 34.63), but its current upward movement suggests a potential short-term correction. Conversely, USDJPY is trading at 159.185, exhibiting a daily bullish trend (ADX: 23.2) despite a short-term bearish signal. This suggests that while the dollar might be facing headwinds globally, its strength against the Japanese Yen remains a significant factor, potentially influenced by the Bank of Japan's monetary policy divergence. GBPUSD at 1.31797 shows a strong daily bearish trend (ADX: 32.65), indicating broader weakness in the pound against the dollar, even as the dollar itself faces challenges.
Looking Ahead: Scenarios and Key Levels
Potential Paths for the Dollar Index
Given the current technical and fundamental backdrop, several scenarios could unfold for the DXY. The immediate battleground is the $99.86 support. A strong defense of this level, coupled with hawkish signals from Powell, could propel the DXY towards the resistance at $100.42 and potentially higher towards $100.63. This bullish scenario would be supported by a sustained risk-off sentiment or clear indications of further Fed tightening. On the other hand, a decisive break below $99.86, especially if Powell adopts a cautious or dovish tone, could lead to a test of the $99.52 support, followed by $99.30. This bearish scenario would be amplified if global equity markets falter significantly or if geopolitical risks escalate further, driving safe-haven flows into other assets. A neutral scenario might see the DXY consolidating between $99.86 and $100.42, awaiting clearer direction from upcoming economic data releases like Non-Farm Payrolls or CPI figures, which are crucial for gauging inflation and employment trends. The current ADX readings across timeframes highlight the indecision, with strong daily downtrend signals conflicting with shorter-term uptrend signals.
The long-term outlook for the dollar remains heavily dependent on the Fed's policy path relative to other major central banks. If the Fed maintains a hawkish stance while others pivot towards easing, the dollar could see sustained strength. However, if inflation proves more persistent than anticipated, forcing the Fed into a more aggressive tightening cycle, it could eventually dampen economic growth and potentially limit the dollar's upside. Conversely, if global growth concerns dominate and other central banks begin to tighten policy, the dollar's safe-haven appeal might wane. The current strength in commodities like gold and silver, trading at $4612.09 and $73.87 respectively, suggests that inflation hedging remains a key theme, which could keep the dollar under pressure unless the Fed signals a strong commitment to fighting it. The daily trend for DXY remains bullish with a power of 100%, but the negative MACD momentum and RSI at 61.27 suggest caution.
The technical indicators provide a fragmented view. On the daily chart, the ADX at 34.5 points to a strong trend, but the MACD histogram is negative, indicating weakening upward momentum. The RSI at 61.27 suggests room for growth but is not yet in overbought territory. On the 1-hour chart, the ADX is 34.5, also indicating a strong trend, but the Stochastic shows a bearish signal. This divergence across timeframes underscores the need for caution and confirmation. Traders will be looking for a clear break of either the $99.86 support or the $100.42 resistance to establish a more defined direction. The strong bullish signals on the 4-hour chart (ADX 28.79) are currently being challenged by the daily bearish sentiment. The DXY's ability to hold above $99.86 will be a critical test of its resilience.
Ultimately, the DXY's path forward will be dictated by a delicate interplay of monetary policy signals, inflation data, and geopolitical developments. Powell's speech represents the immediate focal point, offering a potential catalyst for a decisive move. Traders are on high alert, ready to react to any indication of the Fed's resolve in tackling inflation or its concerns about economic growth. The $99.86 support level is the immediate barrier; its defense or breach will set the tone for the coming days and weeks.
Frequently Asked Questions: DXY Analysis
What happens if the DXY breaks below the $99.86 support level?
A decisive close below $99.86 on the daily chart would likely signal further dollar weakness, potentially targeting the next support at $99.52. This bearish scenario would be reinforced if Fed Chair Powell adopts a cautious tone regarding inflation or economic growth.
Should I trade DXY at current levels around $100.00 given the mixed signals?
Trading at $100.00 presents a high-risk, high-reward scenario due to conflicting signals across timeframes. A high-probability setup would require waiting for a clear break of either the $99.86 support or the $100.42 resistance, ideally confirmed by Powell's commentary.
Is the RSI at 61.27 a strong buy signal for DXY right now?
An RSI of 61.27 on the daily chart suggests upward momentum but is not yet in overbought territory. While it indicates potential for further gains, it's not a standalone buy signal. Confirmation from other indicators and fundamental drivers, such as hawkish Fed remarks, would be needed.
How will upcoming inflation data impact the DXY this week?
Stronger-than-expected inflation data could prompt the Fed to signal a more hawkish stance, potentially boosting the DXY towards resistance levels. Conversely, disappointing inflation figures might lead to dollar weakness as rate hike expectations diminish.
Bearish Scenario: Dollar Under Pressure
60% ProbabilityNeutral Scenario: Consolidation and Waiting
30% ProbabilityBullish Scenario: Dollar Rebounds
10% Probability| Indicator | Value | Signal | Interpretation |
|---|---|---|---|
| RSI (14) Daily | 61.27 | Neutral | Rising, room to move up |
| MACD Daily | -0.21 | Bearish | Negative momentum, below signal line |
| Stochastic Daily | K:87.56, D:59.38 | Bullish | %K > %D, upward signal |
| ADX Daily | 32.94 | Strong Trend | Indicates a strong trend, direction confirmed by other indicators |
| 1H RSI | 49.6 | Neutral | Moving towards bullish territory |
| 1H Stochastic | K:31.3, D:35.57 | Bearish | %K < %D, potential downside |
The current technical picture for the DXY, while showing some short-term bullish signals, is overshadowed by a potentially stronger daily downtrend and the critical test at $99.86 support. The upcoming speech from Fed Chair Powell is the immediate wildcard, capable of injecting significant clarity or further uncertainty into the market's direction. Traders should remain vigilant, focusing on price action around key levels and listening intently for any shifts in the Fed's inflation-fighting resolve. While the immediate pressure might be on the downside, a hawkish Powell could quickly turn the tables, underscoring the need for adaptability and robust risk management in these dynamic market conditions.
Track markets in real-time
AI-powered analysis, technical indicators and real-time price data.
Join Our Telegram Channel
Breaking market news, AI analysis and trading signals instantly.
Join Channel