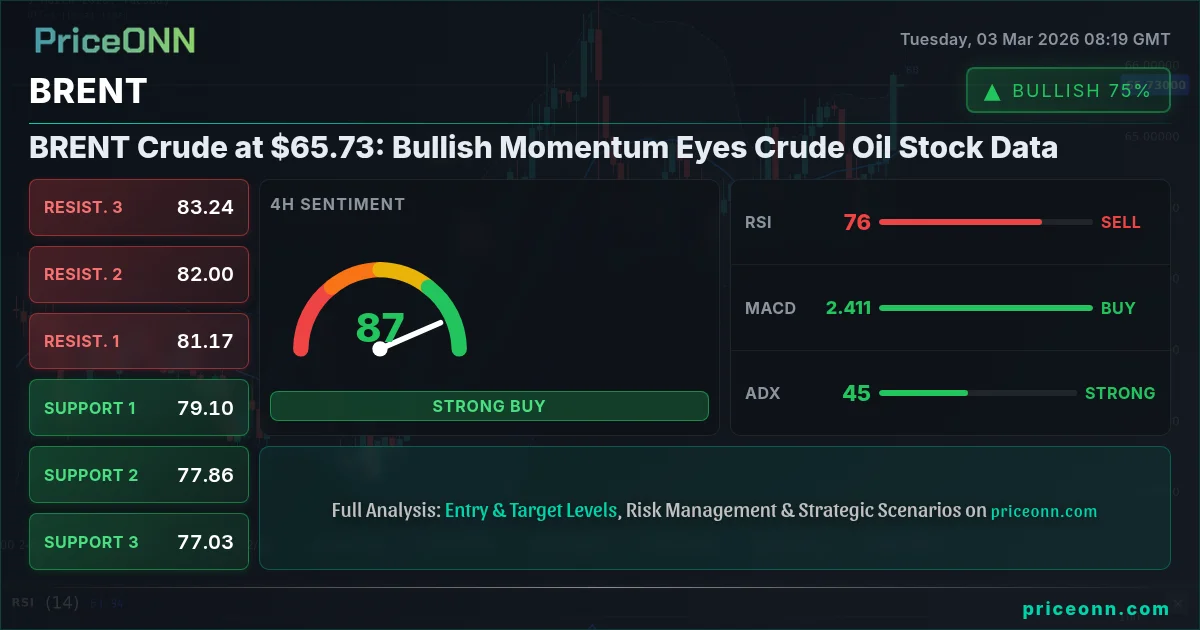
BRENT Crude at $65.73: Bullish Momentum Eyes Crude Oil Stock Data
BRENT crude oil is trading at $65.73, showing bullish momentum as traders await upcoming U.S. crude oil inventory data. Will supply constraints fuel further gains?
BRENT crude oil is exhibiting a bullish tone amid escalating tensions in the Middle East and anticipation surrounding U.S. crude oil inventory data. The energy market is closely monitoring the impact of geopolitical risks and supply disruptions on oil prices, as reflected in BRENT's current level.
- BRENT crude oil is currently trading at $65.73, showing bullish momentum.
- Key support levels for BRENT are identified at $65.20 and $64.50, providing potential buying opportunities.
- The RSI at 71.16 on the 1-hour chart indicates overbought conditions, suggesting a possible pullback.
- Geopolitical tensions in the Middle East and upcoming U.S. crude oil inventory data are key drivers influencing BRENT prices.
The recent surge in crude oil prices is partially attributed to escalating geopolitical tensions in the Middle East. As reported earlier today, a drone strike on Saudi Arabia's largest refinery and ongoing disruptions in the Strait of Hormuz have raised concerns about potential supply shortages. These events have injected a risk premium into crude oil prices, boosting BRENT to its current levels. The market is pricing in the possibility of further disruptions, which could lead to even higher prices if tensions continue to escalate. The geopolitical risk is further amplified by the fact that natural gas prices have already skyrocketed after Qatar's LNG shutdown, creating a volatile mix for global energy markets.
From a technical standpoint, BRENT's bullish momentum is supported by several factors across multiple timeframes. On the 1-hour chart, BRENT is trading near $65.73, exhibiting an overbought condition with an RSI of 71.16. While this suggests a potential pullback in the short term, the MACD histogram remains positive, indicating continued upward momentum. Traders should watch for a break above the immediate resistance at $65.41, which could pave the way for further gains towards $65.52 and $65.62. Conversely, key support levels are identified at $65.20, $65.10, and $64.99, providing potential buying opportunities on any retracements.
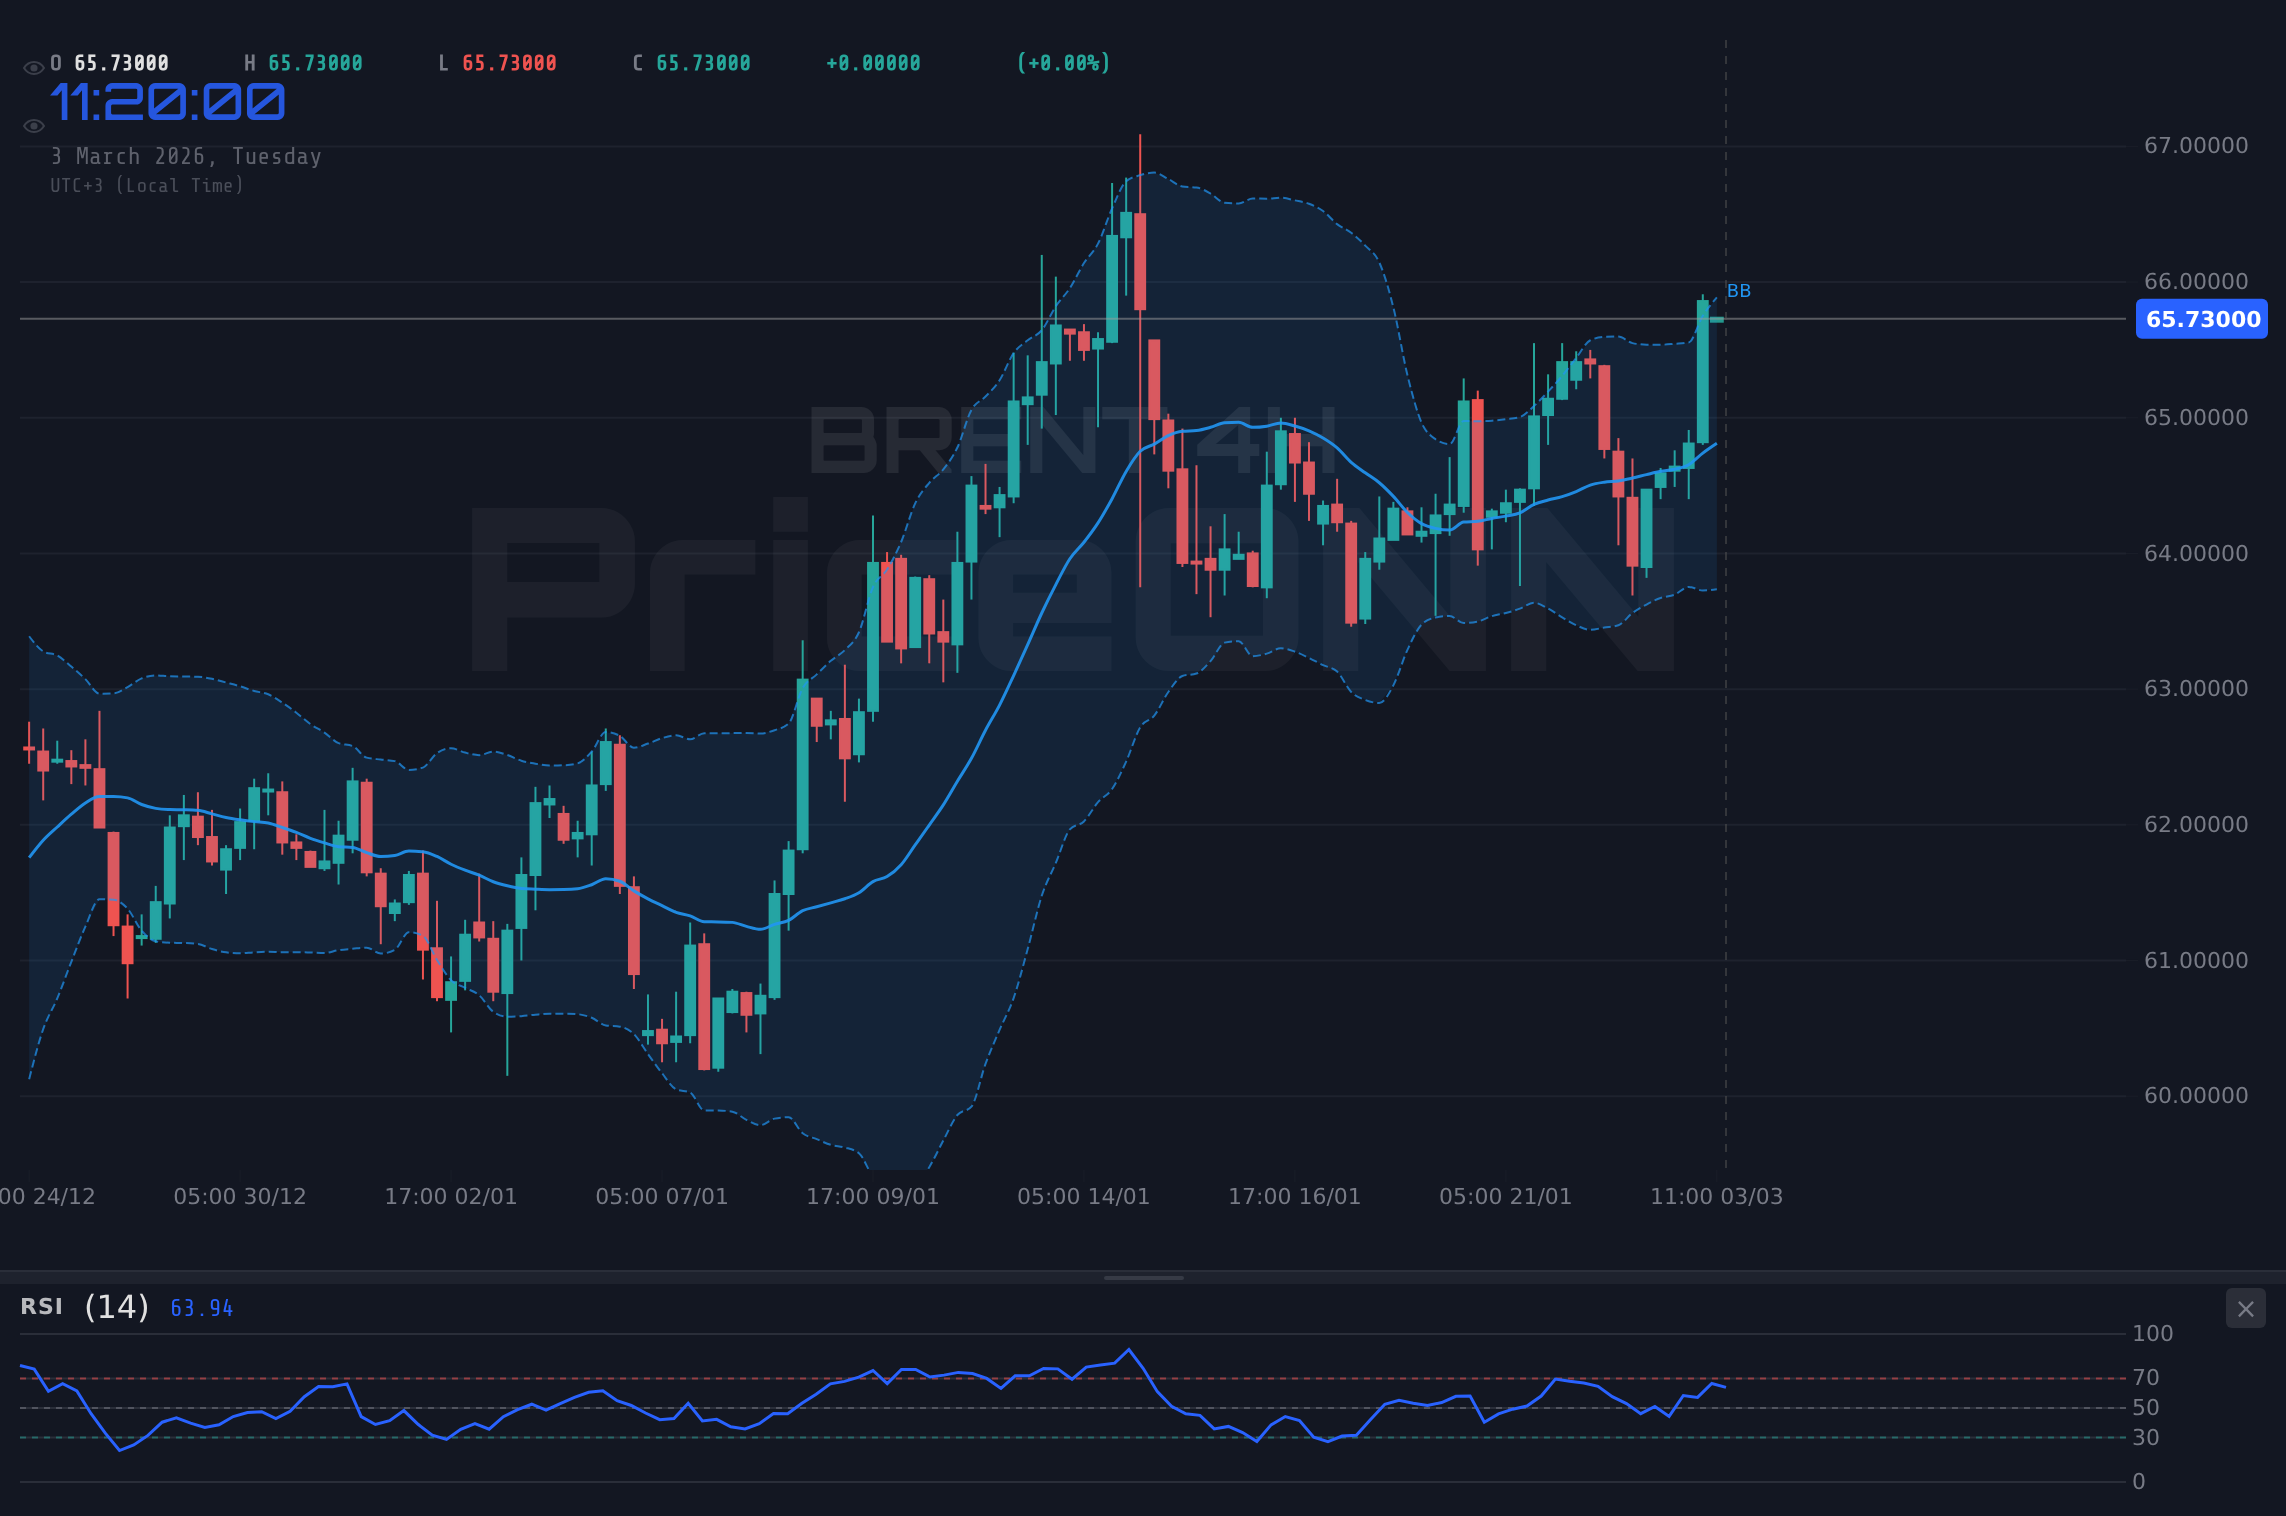
The 4-hour chart paints a similar picture, with BRENT displaying a bullish trend and trading above its middle Bollinger Band. The RSI, although not yet in overbought territory at 62.33, indicates a strong upward bias. The ADX at 13.59 suggests a weak trend, indicating that the breakout may not be fully committed yet. The market needs to see a stronger ADX reading to confirm the sustainability of the current rally. Key resistance levels to watch on this timeframe include $65.01, $65.22, and $65.52, while support can be found at $64.50, $64.20, and $63.99.
The daily chart provides a broader perspective on BRENT's bullish trend. The oil price is trading above its middle Bollinger Band, and the RSI at 59.99 suggests further upside potential. The ADX at 28.64 confirms a strong uptrend, increasing the likelihood of continued gains. Resistance levels on the daily chart are identified at $65.42, $66.36, and $67.23, while support can be found at $63.61, $62.74, and $61.80. The stochastic oscillator reading of K=54.52 and D=58.52 presents a conflicting signal with K
The upcoming U.S. crude oil inventory data, scheduled for release on Wednesday, March 4th, is a key catalyst that could significantly impact BRENT prices. The market is closely watching these figures to gauge the level of supply and demand in the U.S., which is a major consumer of crude oil. A larger-than-expected build in inventories could exert downward pressure on prices, while a draw could fuel further gains. The previous reading showed a significant build of 15.989 million barrels, and traders will be keen to see if this trend continues.
In addition to the inventory data, traders are also paying close attention to the United Kingdom Spring Forecast Statement and Eurozone Consumer Price Index (CPI) YoY, both scheduled for release today. These data points will provide insights into the economic outlook and inflationary pressures in Europe, which could indirectly impact crude oil demand. Any signs of economic weakness or declining inflation could weigh on oil prices, while strong growth and rising inflation could provide support.
Furthermore, comments from FOMC members Williams and Kashkari later today could provide clues about the Federal Reserve's future monetary policy decisions. A hawkish tone from these officials, suggesting a faster pace of interest rate hikes, could strengthen the U.S. dollar, putting downward pressure on crude oil prices. Conversely, a dovish tone could weaken the dollar and support oil prices.
The current market sentiment for BRENT is cautiously optimistic, with traders balancing the bullish impact of geopolitical tensions and supply disruptions against the potential downside risks from economic data and central bank policies. The escalating tensions in the Middle East, triggered by US-Israel actions against Iran, have boosted the US dollar as a safe haven, but at the same time has boosted oil prices on supply fears. This has created a complex dynamic for oil traders to navigate.
The correlation between BRENT and the DXY (Dollar Index) is also worth noting. With the DXY currently at 98.65 and showing a strong upward trend, BRENT could face some headwinds. Historically, a stronger dollar tends to put downward pressure on crude oil prices, as it makes oil more expensive for buyers using other currencies. However, the impact of the DXY may be offset by the aforementioned geopolitical tensions and supply concerns.
Considering the technical picture and the fundamental drivers, BRENT's near-term outlook appears to be cautiously bullish. The key level to watch is the immediate resistance at $65.41. A decisive break above this level could trigger a further rally towards $65.52 and $65.62. However, traders should also be mindful of the overbought conditions indicated by the RSI on the 1-hour chart, which could lead to a short-term pullback. The upcoming U.S. crude oil inventory data will be a critical factor in determining the direction of BRENT prices in the coming days.
Frequently Asked Questions: BRENT Analysis
Is BRENT a good buy right now?
BRENT is exhibiting bullish momentum at $65.73, but overbought conditions on the 1-hour chart suggest caution. A pullback to support around $65.20 may offer a better entry point, but monitor the upcoming inventory data.
What is the BRENT price forecast for this week?
BRENT is expected to remain volatile this week, with potential upside towards $66.36 if geopolitical tensions persist and inventory data is supportive. A break below $65.20 could lead to a test of $64.50.
What are the key support and resistance levels for BRENT?
Key support levels for BRENT are currently at $65.20, $65.10, and $64.99. Resistance levels to watch are $65.41, $65.52, and $65.62, based on the 1-hour chart analysis.
Why is BRENT moving today?
BRENT is primarily moving due to escalating geopolitical tensions in the Middle East and anticipation surrounding the upcoming U.S. crude oil inventory data, which are creating supply concerns.
Track markets in real-time
AI-powered analysis, technical indicators and real-time price data.
Join Our Telegram Channel
Breaking market news, AI analysis and trading signals instantly.
Join Channel