BRENT Eyes $102 Amid Geopolitical Fears and Supply Concerns
BRENT crude oil surges to $101.85 as Middle East tensions escalate, overshadowing IEA's supply data. Traders eye $102 resistance amid heightened volatility.
BRENT crude oil is trading near $101.85, fueled by escalating geopolitical tensions in the Middle East. The surge overshadows the International Energy Agency's (IEA) latest report, which pointed to a record supply disruption. The question now: can the bulls sustain this momentum, or will profit-taking set in?
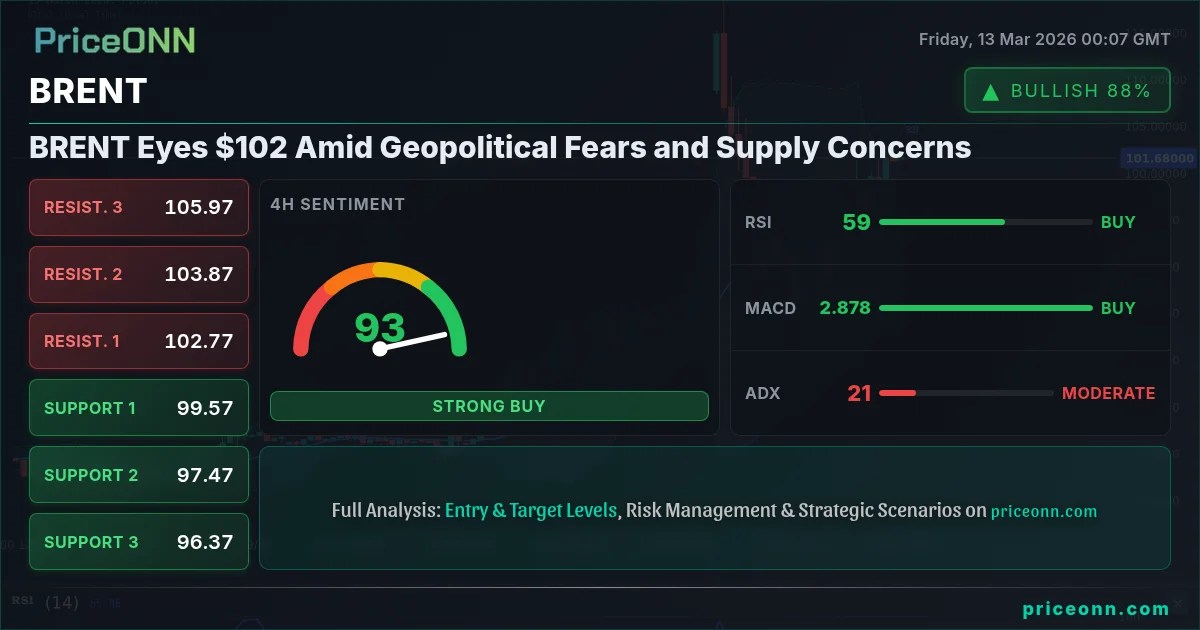
- RSI at 65.23 on the 1H chart suggests increasing buying pressure but not yet overbought conditions.
- Immediate resistance lies at $101.86, a break above which could target $102.43.
- The ADX on the daily chart is at 53.84, indicating a very strong uptrend.
- Geopolitical tensions in the Middle East are outweighing supply data, driving prices higher.
Bullish Scenario: Geopolitical Risk and Supply Constraints
The bull case for BRENT is primarily driven by geopolitical risks. The Middle East remains a powder keg, with any escalation potentially disrupting supply chains. According to Reuters, "Concerns over potential disruptions to oil supply from the Middle East have intensified following recent events." This uncertainty is reflected in the current price action, with BRENT surging past key resistance levels.
Adding fuel to the fire, the 1D chart reveals an ADX of 53.84, confirming a very strong uptrend. This suggests that the current bullish momentum is likely to continue, at least in the short term. The Stochastic oscillator, while showing a potential for a pullback with K=49.65 and D=65.55, is not yet signaling a reversal.
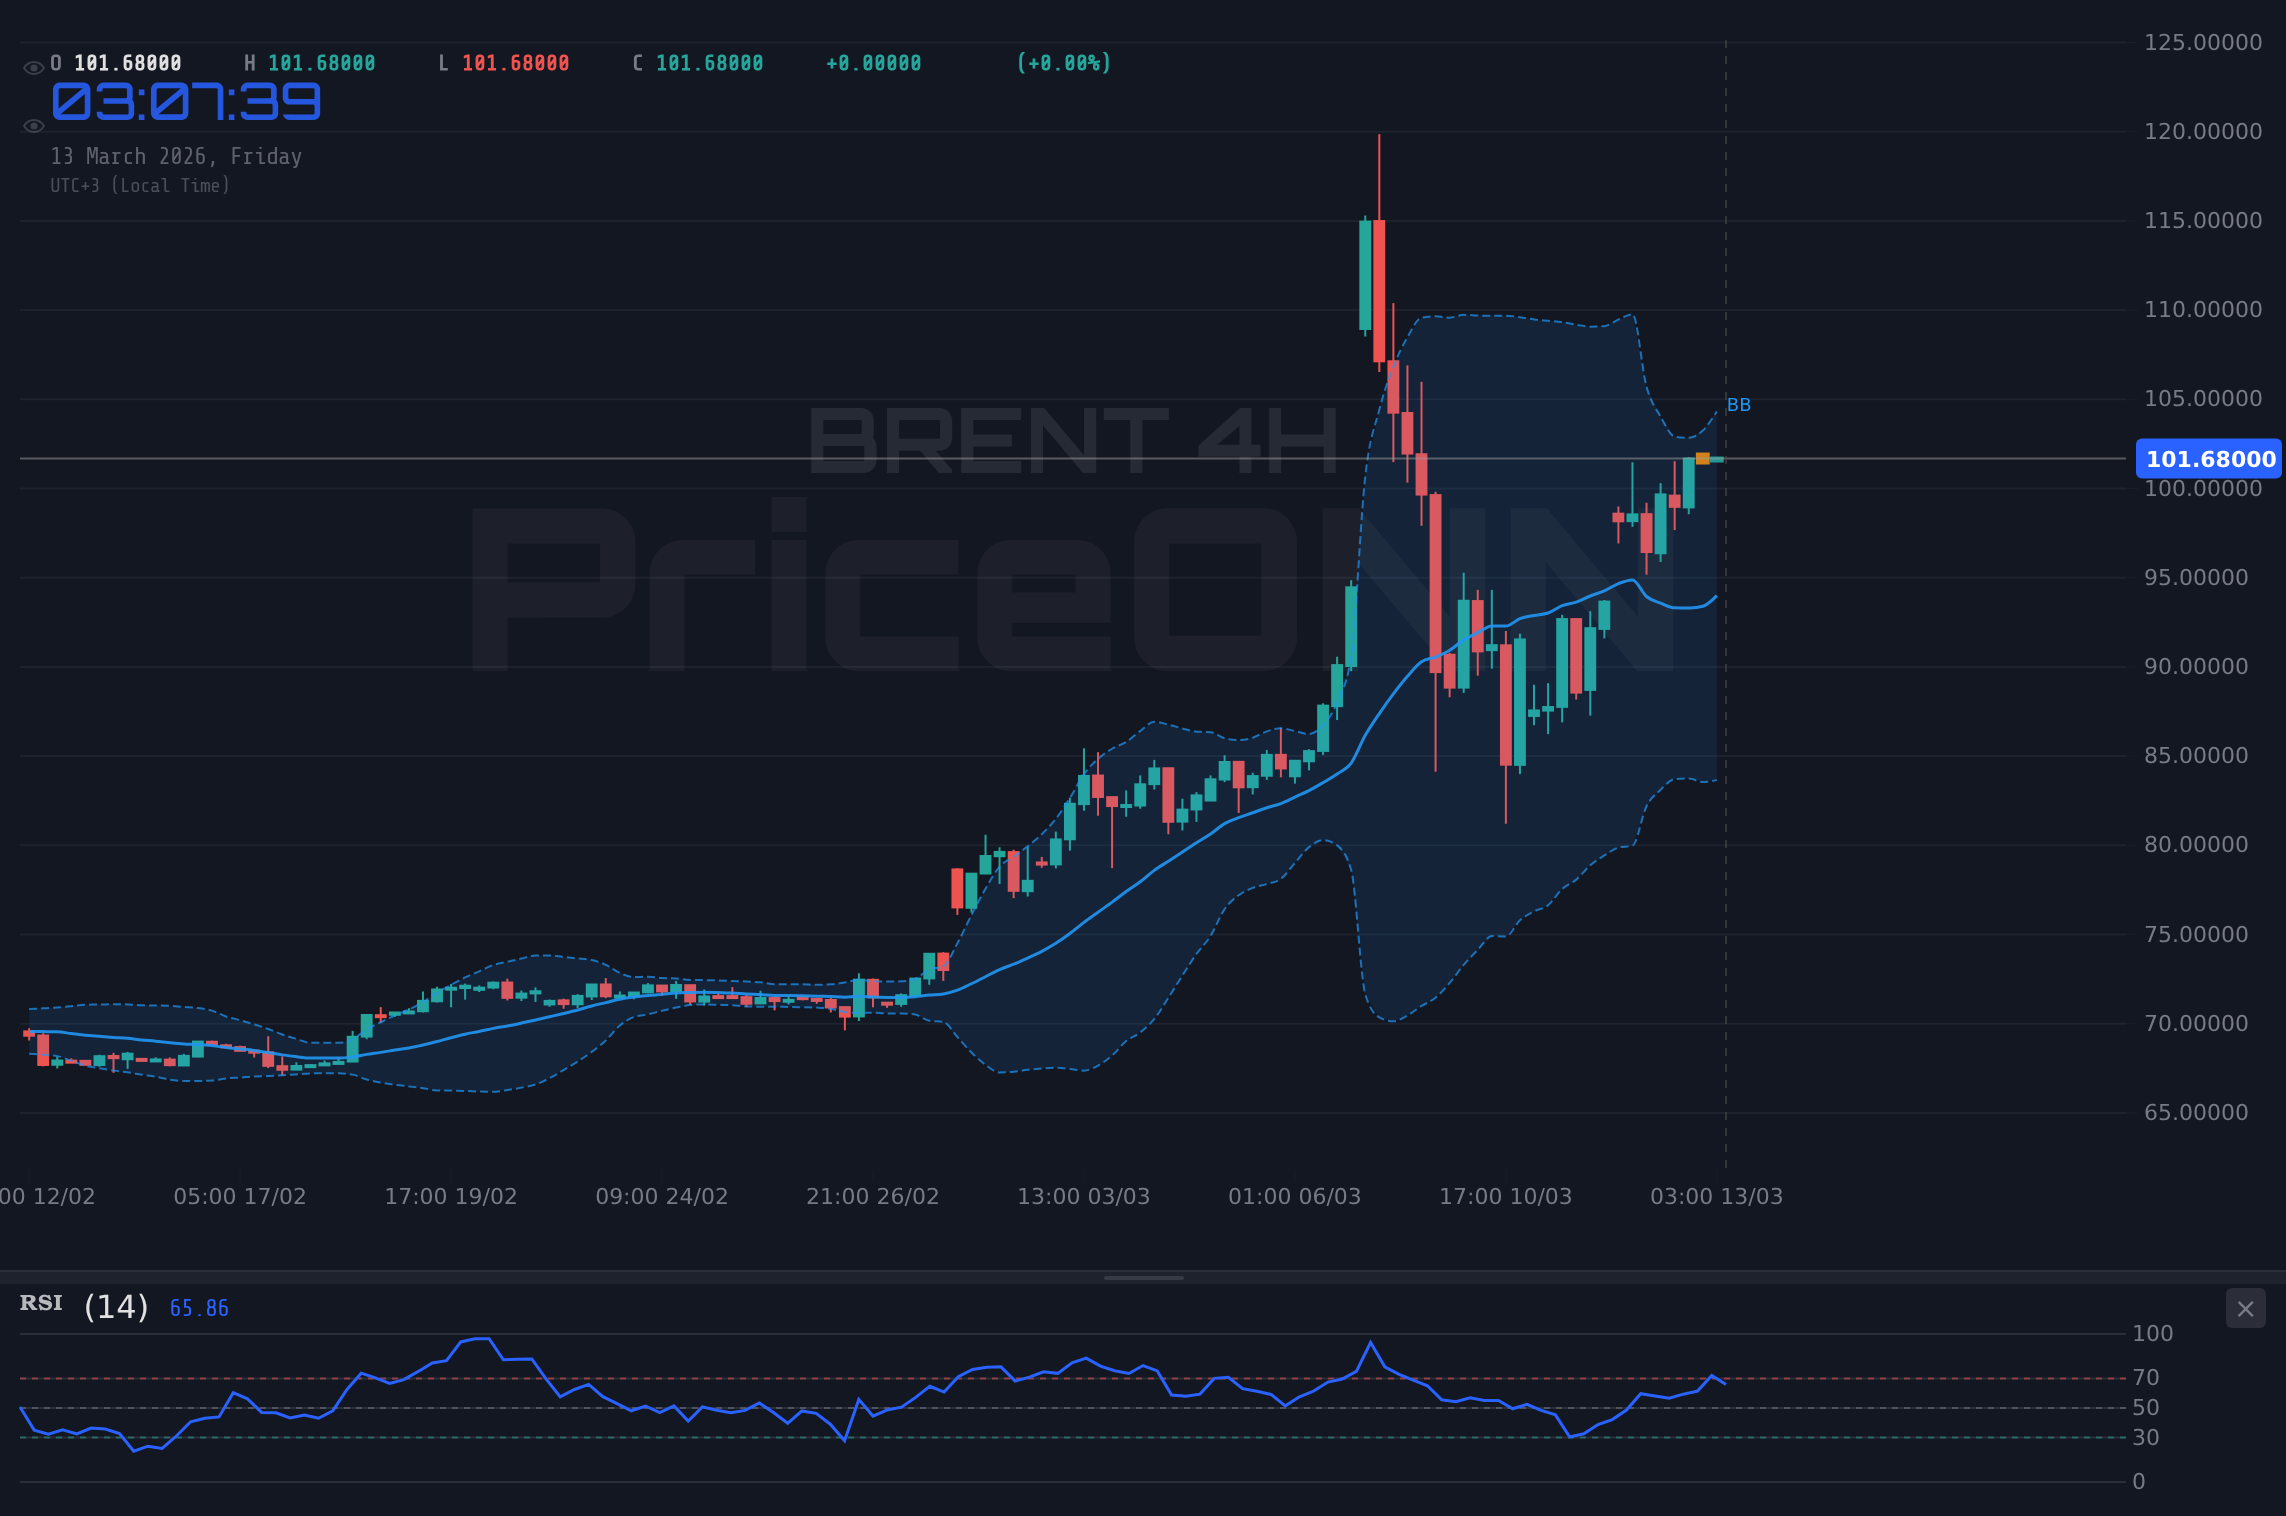
Technically, a breakout above $101.86 would open the door to further gains, with the next resistance level at $102.43. A sustained move above $102.43 could then target the $103.11 level. The 1H chart also shows the RSI at 65.23, indicating increasing buying pressure, although not yet in overbought territory. This suggests there is still room for the rally to continue.
Bearish Scenario: Profit-Taking and Economic Slowdown
The bear case for BRENT hinges on the possibility of profit-taking and a potential economic slowdown. After a significant rally, traders may look to lock in gains, which could trigger a pullback. Additionally, concerns about a global economic slowdown could dampen demand for oil, putting downward pressure on prices.
While the daily chart shows a strong uptrend, the RSI at 86.63 is flashing a warning sign. This indicates that BRENT is in overbought territory and could be due for a correction. Furthermore, the Stochastic oscillator on the 1D chart is showing a potential for a pullback. The 4H chart offers some conflicting signals. While the trend is bullish, the Stochastic is in overbought territory with K=90.23 and D=85.56, suggesting caution. The ADX at 21.25 indicates only a moderate uptrend.
From a technical perspective, failure to hold above the $100.61 support level could trigger a sell-off, with the next target at $99.93. A break below $99.93 could then lead to a test of the $99.36 level. It's also important to note that the DXY is currently at 99.41, which could put downward pressure on oil prices if the dollar continues to strengthen.
Technical Tiebreaker: Multi-Timeframe Analysis
A multi-timeframe analysis reveals a mixed picture. The 1H chart shows a bullish trend, but the RSI is approaching overbought levels. The 4H chart also shows a bullish trend, but the Stochastic is in overbought territory. The daily chart confirms the uptrend, but the RSI is flashing a warning sign. This suggests that while the overall trend is bullish, a pullback is possible in the short term.
The key level to watch is $101.86. A sustained break above this level would confirm the bullish momentum and open the door to further gains. However, failure to hold above the $100.61 support level could trigger a sell-off. Traders should also pay close attention to the DXY, as a stronger dollar could put downward pressure on oil prices.
The market sentiment appears to be driven by geopolitical tensions and supply constraints, which are outweighing concerns about economic slowdown. According to Bloomberg, "Oil prices are soaring as Middle East conflict triggers record supply disruption." This suggests that the bullish momentum is likely to continue, at least in the short term. However, traders should be prepared for a potential pullback, especially if the RSI remains in overbought territory.
Fundamental Drivers: Geopolitics vs. Macroeconomics
The fundamental drivers of BRENT are currently split between geopolitical risks and macroeconomic factors. The ongoing tensions in the Middle East are creating uncertainty about supply, which is supporting prices. At the same time, concerns about a global economic slowdown are weighing on demand, putting downward pressure on prices. The interaction between these two forces will likely determine the direction of BRENT in the coming weeks.
The upcoming economic data releases will be crucial in shaping market sentiment. The previous reading for the high impact USD event on Tuesday, March 10th was 3.91. Traders will be closely watching the upcoming USD and GBP data releases on Friday, March 13th. The previous readings for these events were 4.3 and 0.1 respectively. Any significant deviations from expectations could trigger sharp moves in BRENT.
The recent news that WTI crude oil is eyeing $100 as geopolitical tensions trump IEA release underscores the dominance of geopolitical factors. However, it's essential to remember that these tensions can be fleeting, and a resolution could lead to a rapid reversal in prices. Therefore, traders should carefully manage their risk and avoid getting caught on the wrong side of the market.
The Importance of Risk Management
In the current volatile market environment, risk management is paramount. Traders should carefully assess their risk tolerance and avoid overleveraging their positions. It's also important to have a clear exit strategy in place, with well-defined stop-loss orders. Patience is key, and traders should wait for their setup to develop before entering the market.
Frequently Asked Questions: BRENT Analysis
What happens if BRENT breaks above $101.86 resistance?
If BRENT breaks above the immediate resistance at $101.86, the next target would be $102.43. A sustained move above $102.43 could then lead to a test of the $103.11 level, according to the 1H chart analysis.
Should I buy BRENT at current levels of $101.85 given RSI at 65.23?
With the RSI at 65.23 on the 1H chart, buying at current levels is risky. While the trend is bullish, the RSI suggests increasing buying pressure, but not yet overbought. Wait for a potential pullback or breakout confirmation before entering a long position.
Is RSI at 86.63 a sell signal for BRENT right now?
An RSI of 86.63 on the 1D chart indicates that BRENT is in overbought territory and could be due for a correction. While it's not a definitive sell signal, it warrants caution and suggests that profit-taking may be imminent.
How will the upcoming USD and GBP data releases on March 13th affect BRENT this week?
The upcoming USD and GBP data releases on Friday, March 13th, could significantly impact BRENT. Any significant deviations from expectations could trigger sharp moves in BRENT, depending on whether the data supports or undermines the current bullish sentiment.
Technical Outlook Summary
| Indicator | Value | Signal |
|---|---|---|
| RSI (14) | 65.23 | Neutral |
| MACD Histogram | Positive | Bullish |
| Stochastic | 95.87 | Bullish |
| ADX | 53.84 | Strong Trend |
| Bollinger | Upper Band | Watch |
Key Levels
Support Levels
Resistance Levels
Track markets in real-time
AI-powered analysis, technical indicators and real-time price data.
Join Our Telegram Channel
Breaking market news, AI analysis and trading signals instantly.
Join Channel