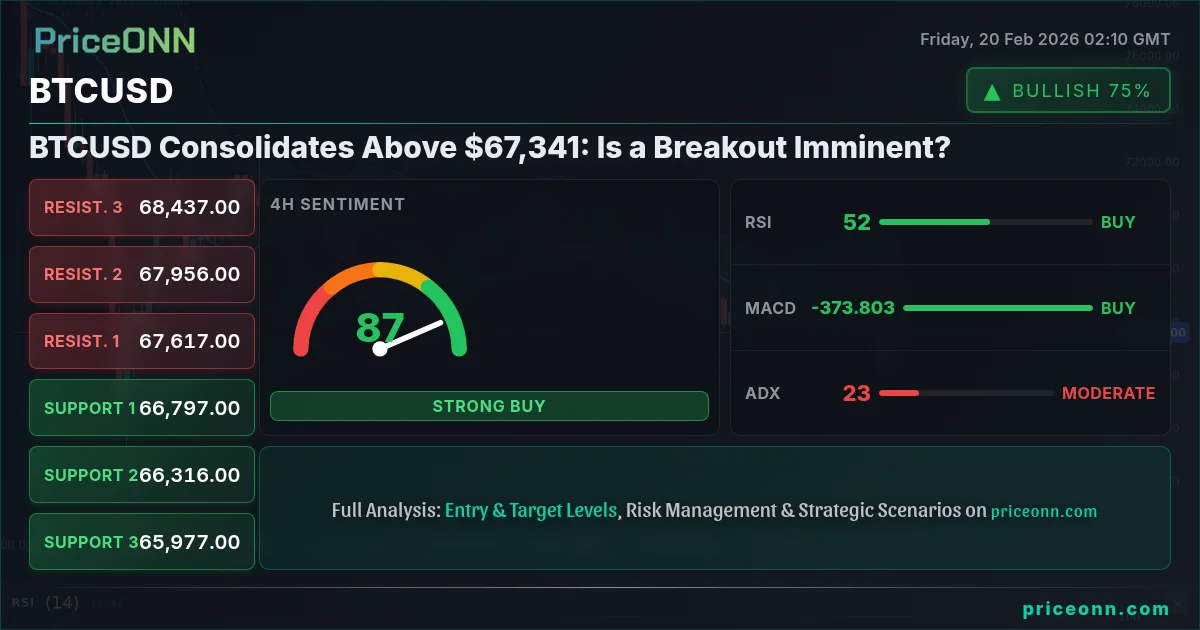
BTCUSD is currently holding steady at $67,341, indicating a consolidation phase that could precede a breakout. As traders assess market conditions, the sentiment is mixed, with bulls and bears both preparing for their next moves.
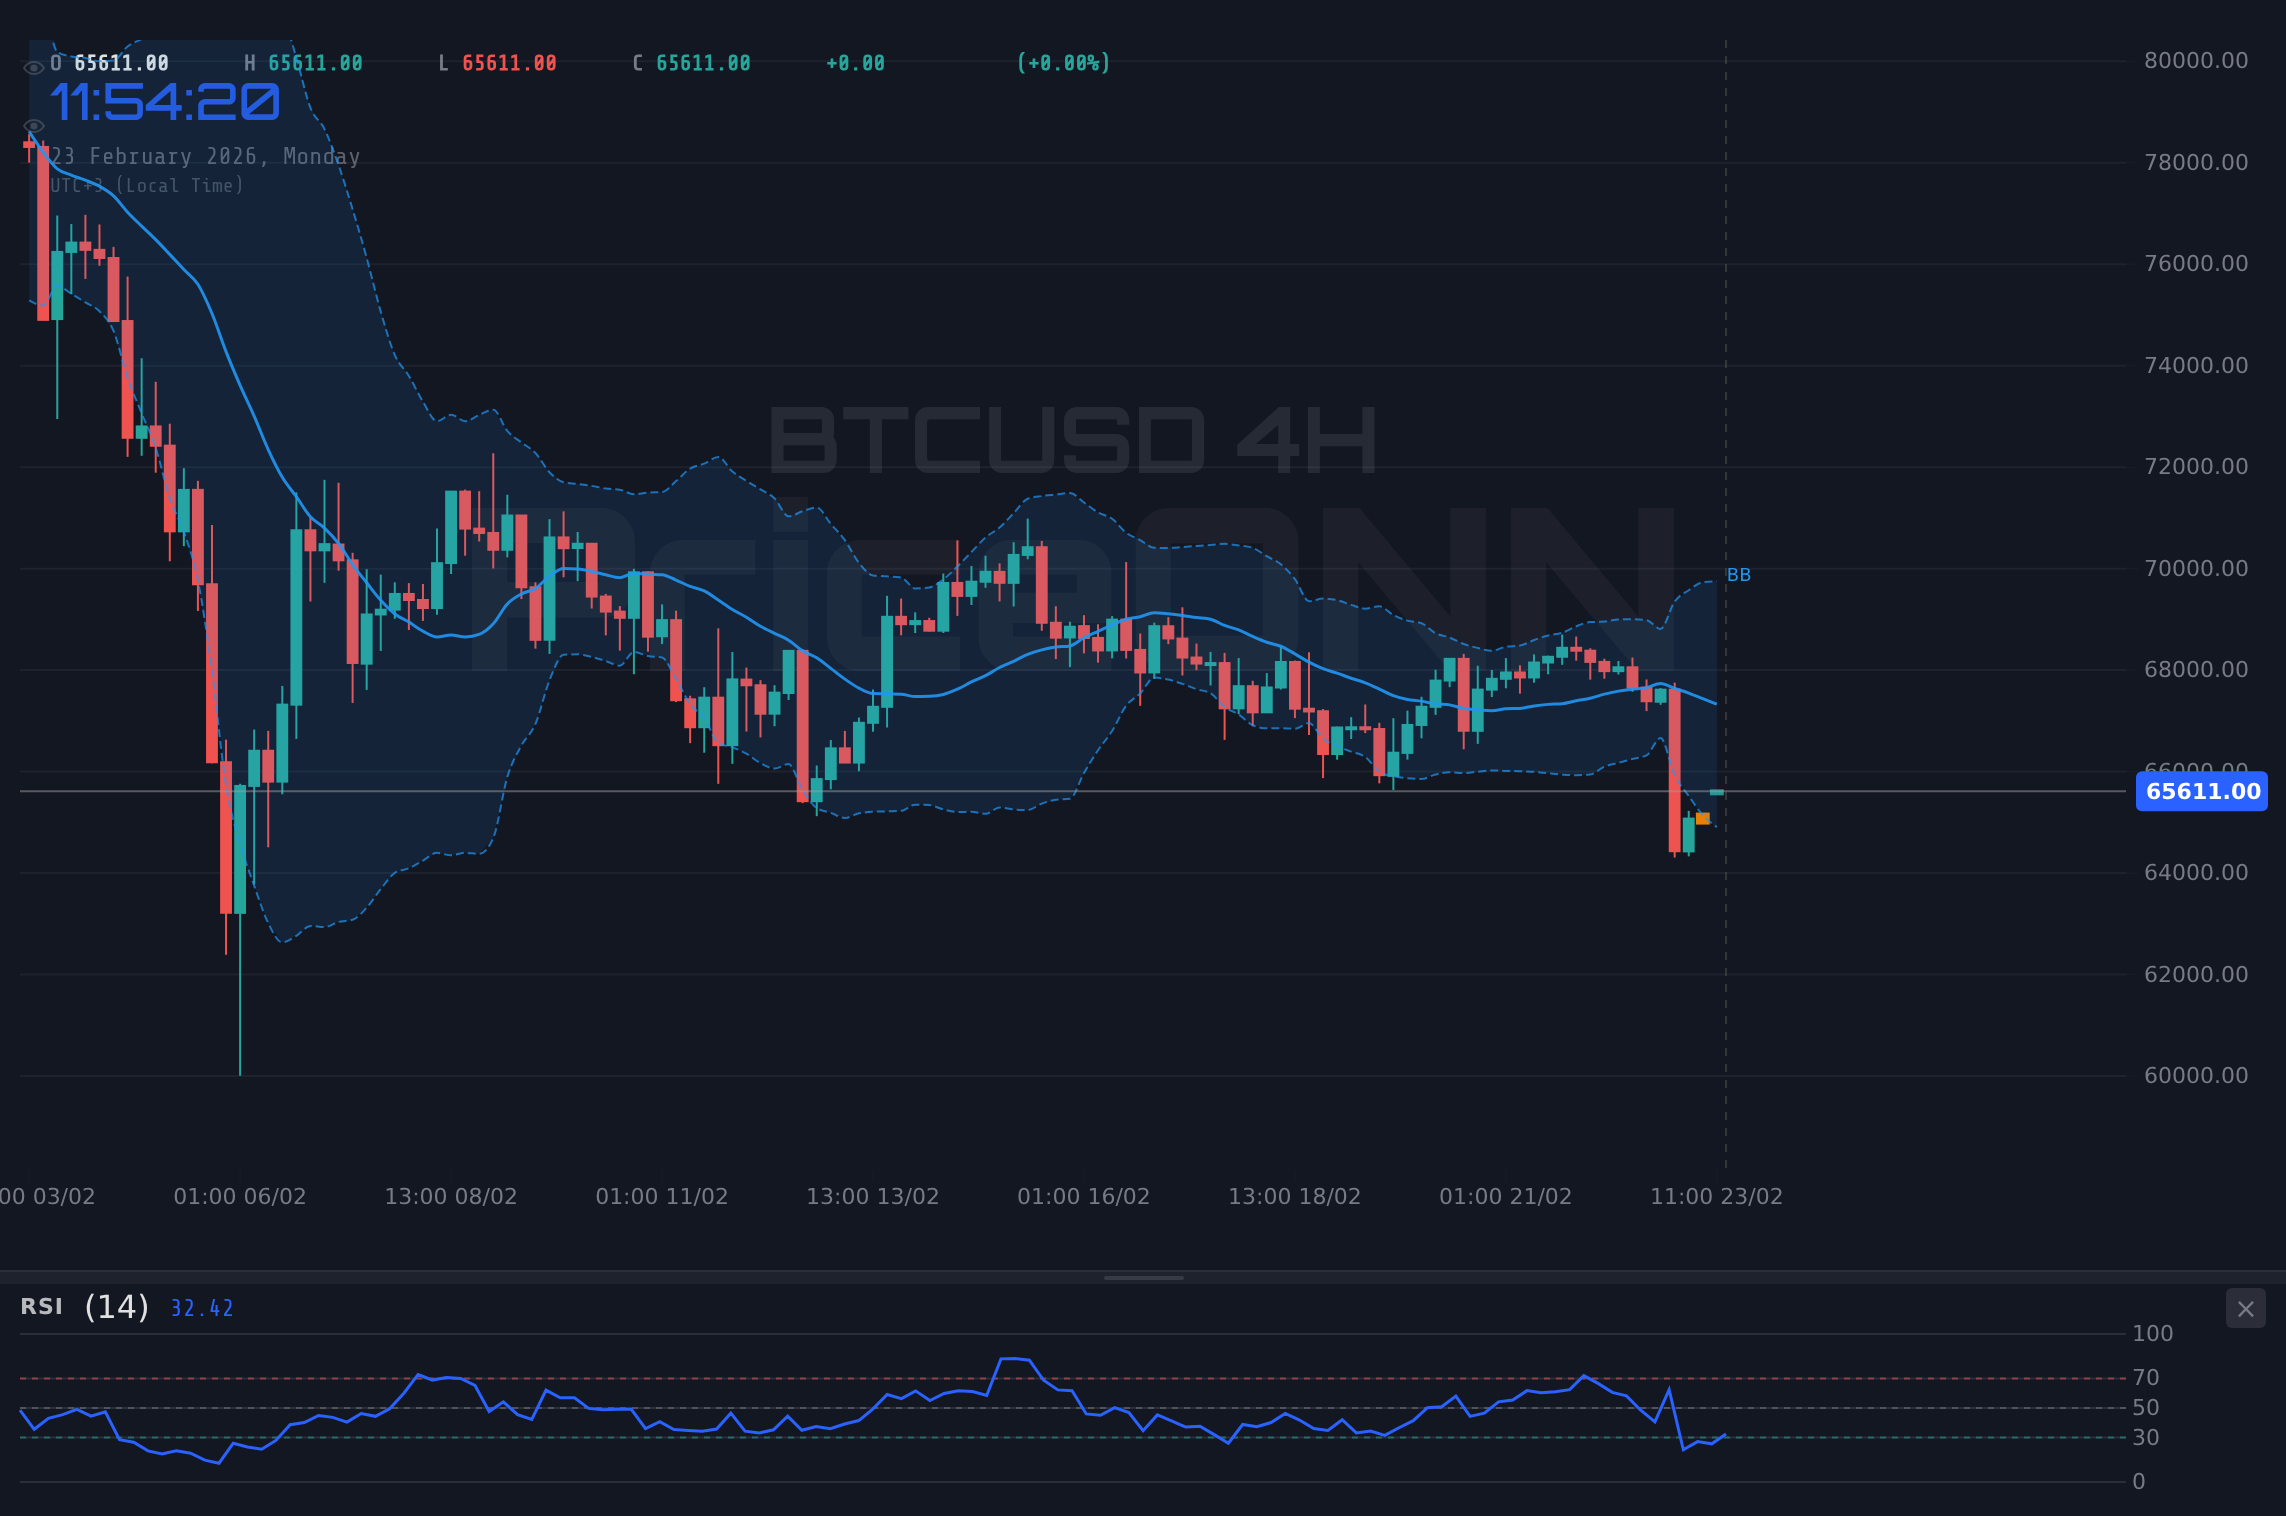
The current price action shows BTCUSD maintaining above the critical $67,000 level, which could signal bullish momentum if a breakout occurs.
Time Horizon: This analysis targets swing traders, focusing on 4-hour and daily charts.
Market Conditions and Sentiment
As we analyze the current market, it's crucial to note that the Dollar Index (DXY) has been showing signs of strength, currently trading at 97.68. A rising dollar typically puts pressure on Bitcoin and other cryptocurrencies. This correlational dynamic could impact the price action of BTCUSD as we move forward.
Be cautious - while the consolidation above $67,000 looks promising, the DXY's strength may create downward pressure unless market sentiment shifts.
Technical Analysis
Looking at the 1-hour timeframe, we observe a neutral trend with a strength of 50%. The support levels are primarily below the current price, with S1 at $66,964.33, S2 at $66,696.67, and S3 at $66,441.33. On the resistance side, R1 is set at $67,487.33, R2 at $67,742.67, and R3 at $68,010.33.
Trade Plan
Scenario A: Trend Continuation (Primary)
- Direction: Long
- Entry Trigger: H4 close above $67,487
- Target 1: $67,742 (~255 pips)
- Target 2: $68,010 (~668 pips)
- Stop / Invalidation: H4 close below $66,964
Scenario B: Pullback / Reversal (Alternative)
- Condition: $66,964 support holds + RSI divergence
- Entry Trigger: H4 close above $67,000 + volume increase
- Target: $67,487 zone
- Invalidation: Close below $66,441
News Risk: Volatility may increase ahead of upcoming data releases. Consider reducing position size.
Technical Summary
| Indicator | Value | Signal | Interpretation |
|---|---|---|---|
| RSI (14) | 59.18 | Neutral | Indicating potential upward movement |
| MACD | Positive | Bullish | Momentum supports a bullish trend |
| ADX | 14.7 | Weak | Trend strength is low |
As we look at the current market conditions, BTCUSD's stability above the $67,000 mark is encouraging for bullish traders. However, caution is necessary as external factors like the DXY's performance could sway the market sentiment. Always remember that proper risk management is key, and prepare for potential scenarios!
Track markets in real-time
AI-powered analysis, technical indicators and real-time price data.
Join Our Telegram Channel
Breaking market news, AI analysis and trading signals instantly.
Join Channel