BTCUSD Увеличился на 1.3%: Технический анализ и ключевые уровни
BTCUSD в настоящее время торгуется на уровне $70,837.00, показывая увеличение на 1.3% сегодня, что указывает на бычий импульс.
Недавний рост Bitcoin до $70,837.00 привлек внимание трейдеров и инвесторов, отражая растущее бычье настроение на рынке.
BTCUSD в настоящее время испытывает сильный восходящий импульс с значительными уровнями поддержки ниже.
Обзор Технического Анализа
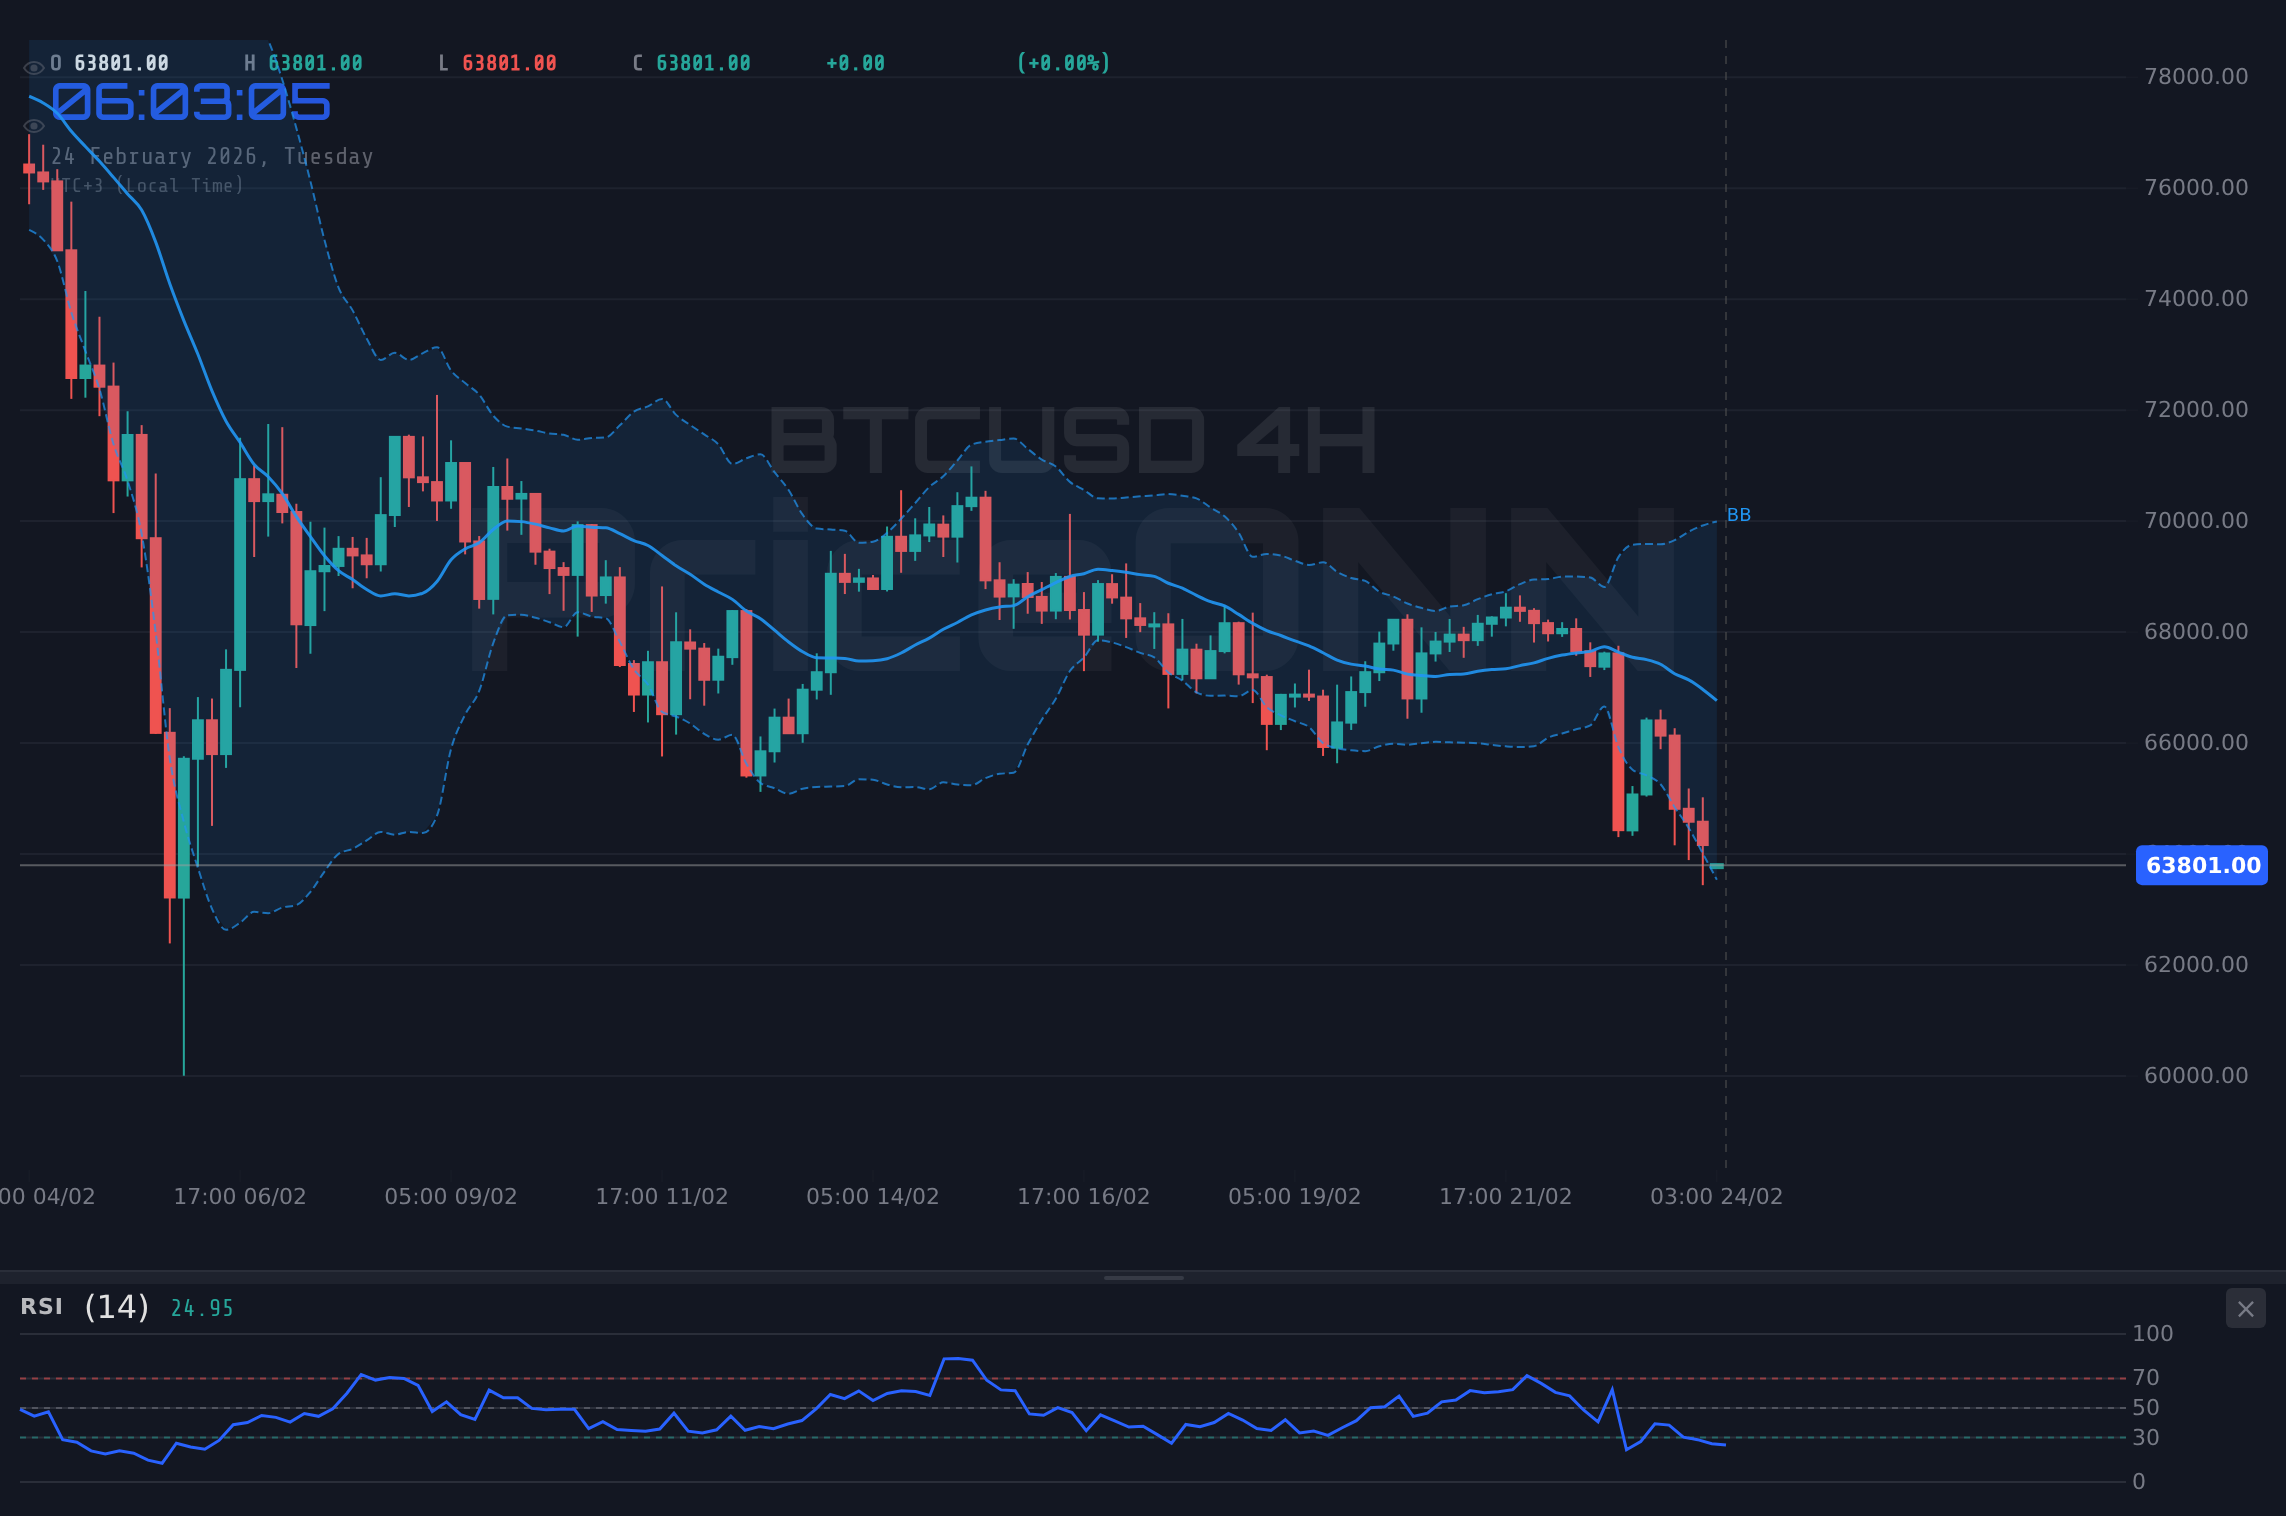
Bitcoin продемонстрировал впечатляющую устойчивость, и его цена сейчас составляет $70,837.00. Этот бычий тренд можно объяснить различными факторами, включая рост институционального принятия и благоприятные макроэкономические условия. Давайте погрузимся в технические детали.
Ключевые Технические Индикаторы
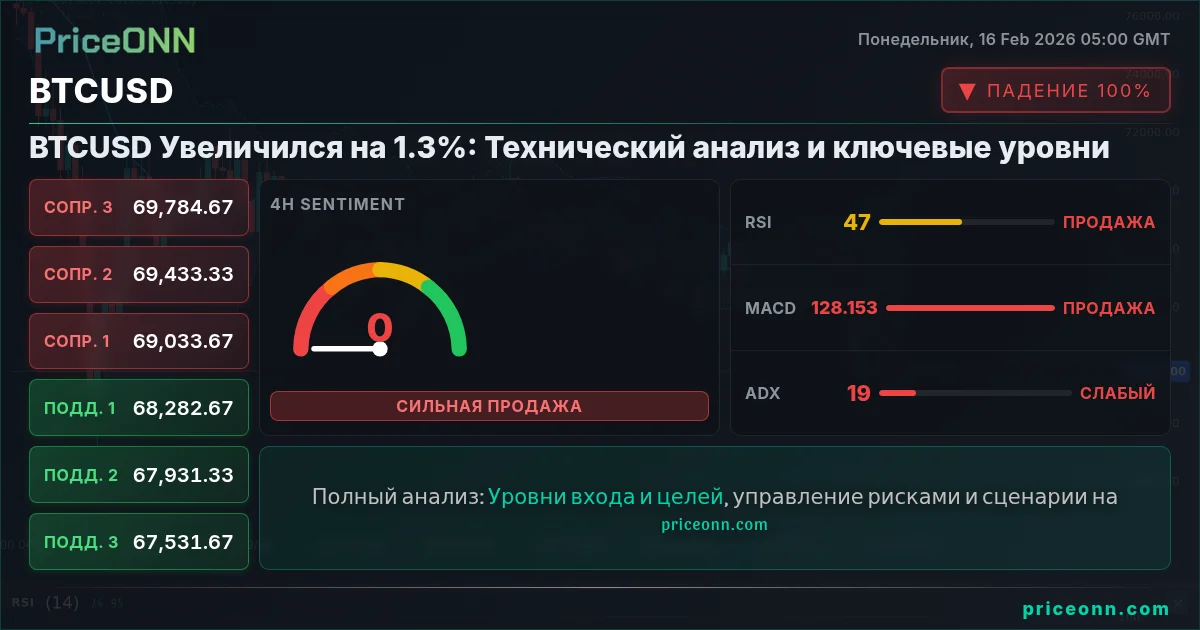
Уровни Поддержки и Сопротивления
Торговые Сценарии
Торговый План
Сценарий A: Продолжение Тренда (Основной)
- Склонность: Бычья
- Триггер Входа: Закрытие выше $70,930
- Цель 1: $71,500 (+0.94%)
- Цель 2: $72,000 (+1.59%)
- Стоп/Недействительность: Закрытие ниже $69,254
Сценарий B: Коррекция
- Условие: Поддержка на уровне $69,254 сохраняется
- Триггер Входа: Закрытие выше $70,000
- Цель: $71,000
- Недействительность: Закрытие ниже $68,500
Риск новостей: Предстоящие экономические данные могут вызвать волатильность; рассмотрите возможность корректировки размеров позиций.
Предстоящие Экономические События
Техническое Резюме
| Индикатор | Значение | Сигнал |
|---|---|---|
| RSI (14) | 71.56 | Бычье |
| MACD | Положительный | Бычье |
| ADX | 39.08 | Сильный Тренд |
В заключение, ценовое движение Bitcoin вокруг $70,837.00 указывает на сильный бычий импульс с четкими уровнями поддержки и сопротивления, которые трейдеры должны внимательно отслеживать.
Отслеживайте рынки в реальном времени
ИИ-анализ и данные в реальном времени.