
Brent Petrol 92.54 Dolar: Geçen Haftanın Düşüşü ve İzlenecek Kilit Seviyeler
Brent ham petrol, haftayı 92.54 dolar civarında kapatarak önemli bir haftalık düşüş yaşadı. Bu analiz, teknik göstergeleri, destek/direnç seviyelerini ve olası senaryoları inceliyor.
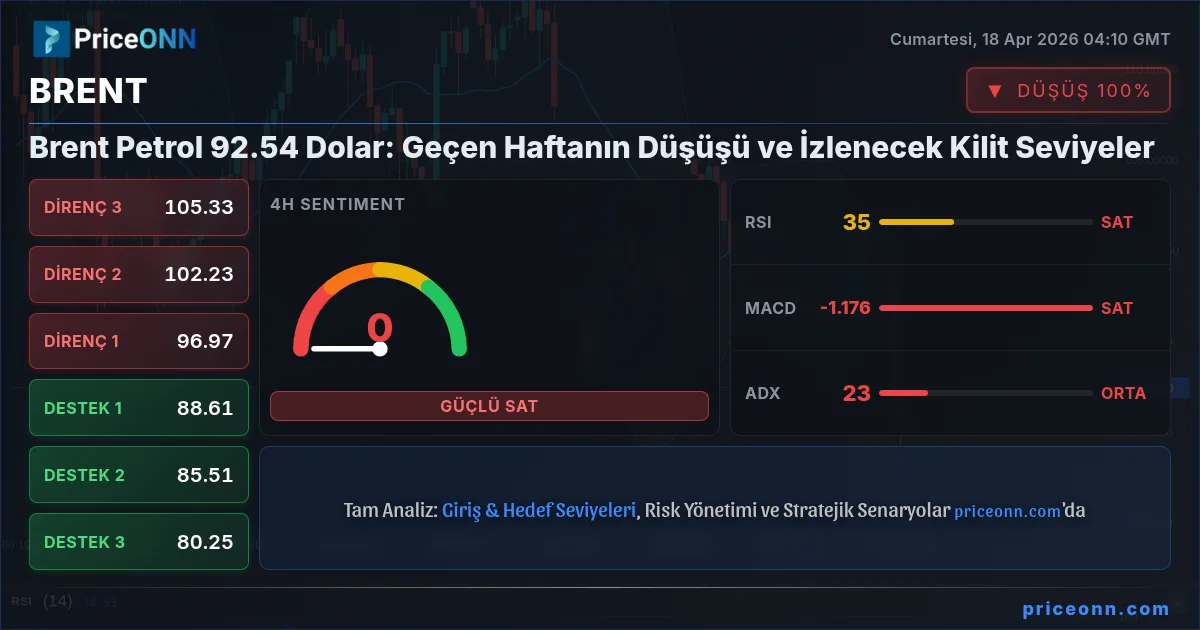
Dalgalı bir haftayı 92.54 dolardan kapatan Brent ham petrol, son zirvelerinden keskin bir düşüş kaydetti. Geçtiğimiz yedi gün, emtianın kritik psikolojik seviyeleri kırması ve önemli destek bölgelerini test etmesiyle önemli fiyat hareketlerine sahne oldu. Bu inceleme, geçen haftanın olaylarını mercek altına alıyor, teknik göstergeleri analiz ediyor ve önümüzdeki günlerde volatil enerji piyasalarında yön bulmaya çalışan yatırımcılar için bir yol haritası sunuyor. Jeopolitik gerilimler, ekonomik veriler ve piyasa duyarlılığı arasındaki etkileşimi anlamak, Brent'in bir sonraki hamlesini çözmek için kritik öneme sahip.
- Brent petrol, keskin bir haftalık düşüşün ardından haftayı 92.54 dolardan kapattı.
- 89.58 dolar kritik destek seviyesi olarak görülürken, 85.51 dolar daha önemli bir taban oluşturuyor.
- İzlenecek direnç seviyeleri 93.64 ve 96.97 dolar olup, 101.86 dolar önemli bir engel teşkil ediyor.
- 38.43 seviyesindeki RSI, daha fazla aşağı yönlü potansiyele işaret ederken, 37.6 ADX güçlü bir düşüş trendinin hakim olduğunu gösteriyor.
- Jeopolitik tansiyonun azalması ve arz/talep dinamiklerindeki değişimler, fiyatları etkileyen ana faktörler.
Geçen Hafta: Brent İçin Sert Bir Tersine Dönüş
Geçen hafta, petrol piyasalarındaki volatiliteyi hatırlatan keskin bir ders oldu. Haftalarca süren jeopolitik gerilimler ve arz kesintisi endişelerinin Brent petrolünü 100 doların üzerine taşımasının ardından, ani bir tersine dönüş yaşandı. Diplomatik çözüm umutları ve kilit nakliye yollarının yeniden açılmasına yönelik raporlar, anlatıyı dramatik bir şekilde değiştirdi. Bu duyarlılık değişimi, Brent'in haftalık zirvesi olan 100.31 dolardan 87.27 dolara düşmesiyle önemli bir satış dalgasını tetikledi. 92.54 dolarlık kapanış fiyatı, bu sert aşağı yönlü baskıyı yansıtıyor ve birçok yatırımcıyı önceki yükseliş trendinin sürdürülebilirliğini sorgulatıyor.
Hızlı düşüş, önceki kazanımları sildi ve Brent'i teknik olarak önemli bir bölgeye taşıdı. Bu hareket sadece küçük bir düzeltme değildi; fiyata eklenen risk primlerinin önemli ölçüde yeniden değerlendirilmesini temsil ediyordu. Küresel petrol arzı için kritik bir darboğaz olan Hürmüz Boğazı ile ilgili haberler, kilit rol oynadı. Diplomatik kanallar aracılığıyla veya basitçe acil tehditlerin azalması yoluyla gerilimlerin tırmanmasının durduğuna dair raporlar, spekülatif uzun pozisyonları ürkütmeye yetti. Piyasa, önemli bir arz kesintisi riskini fiyatlamışken, bu pozisyonları agresif bir şekilde kapatmaya başladı.
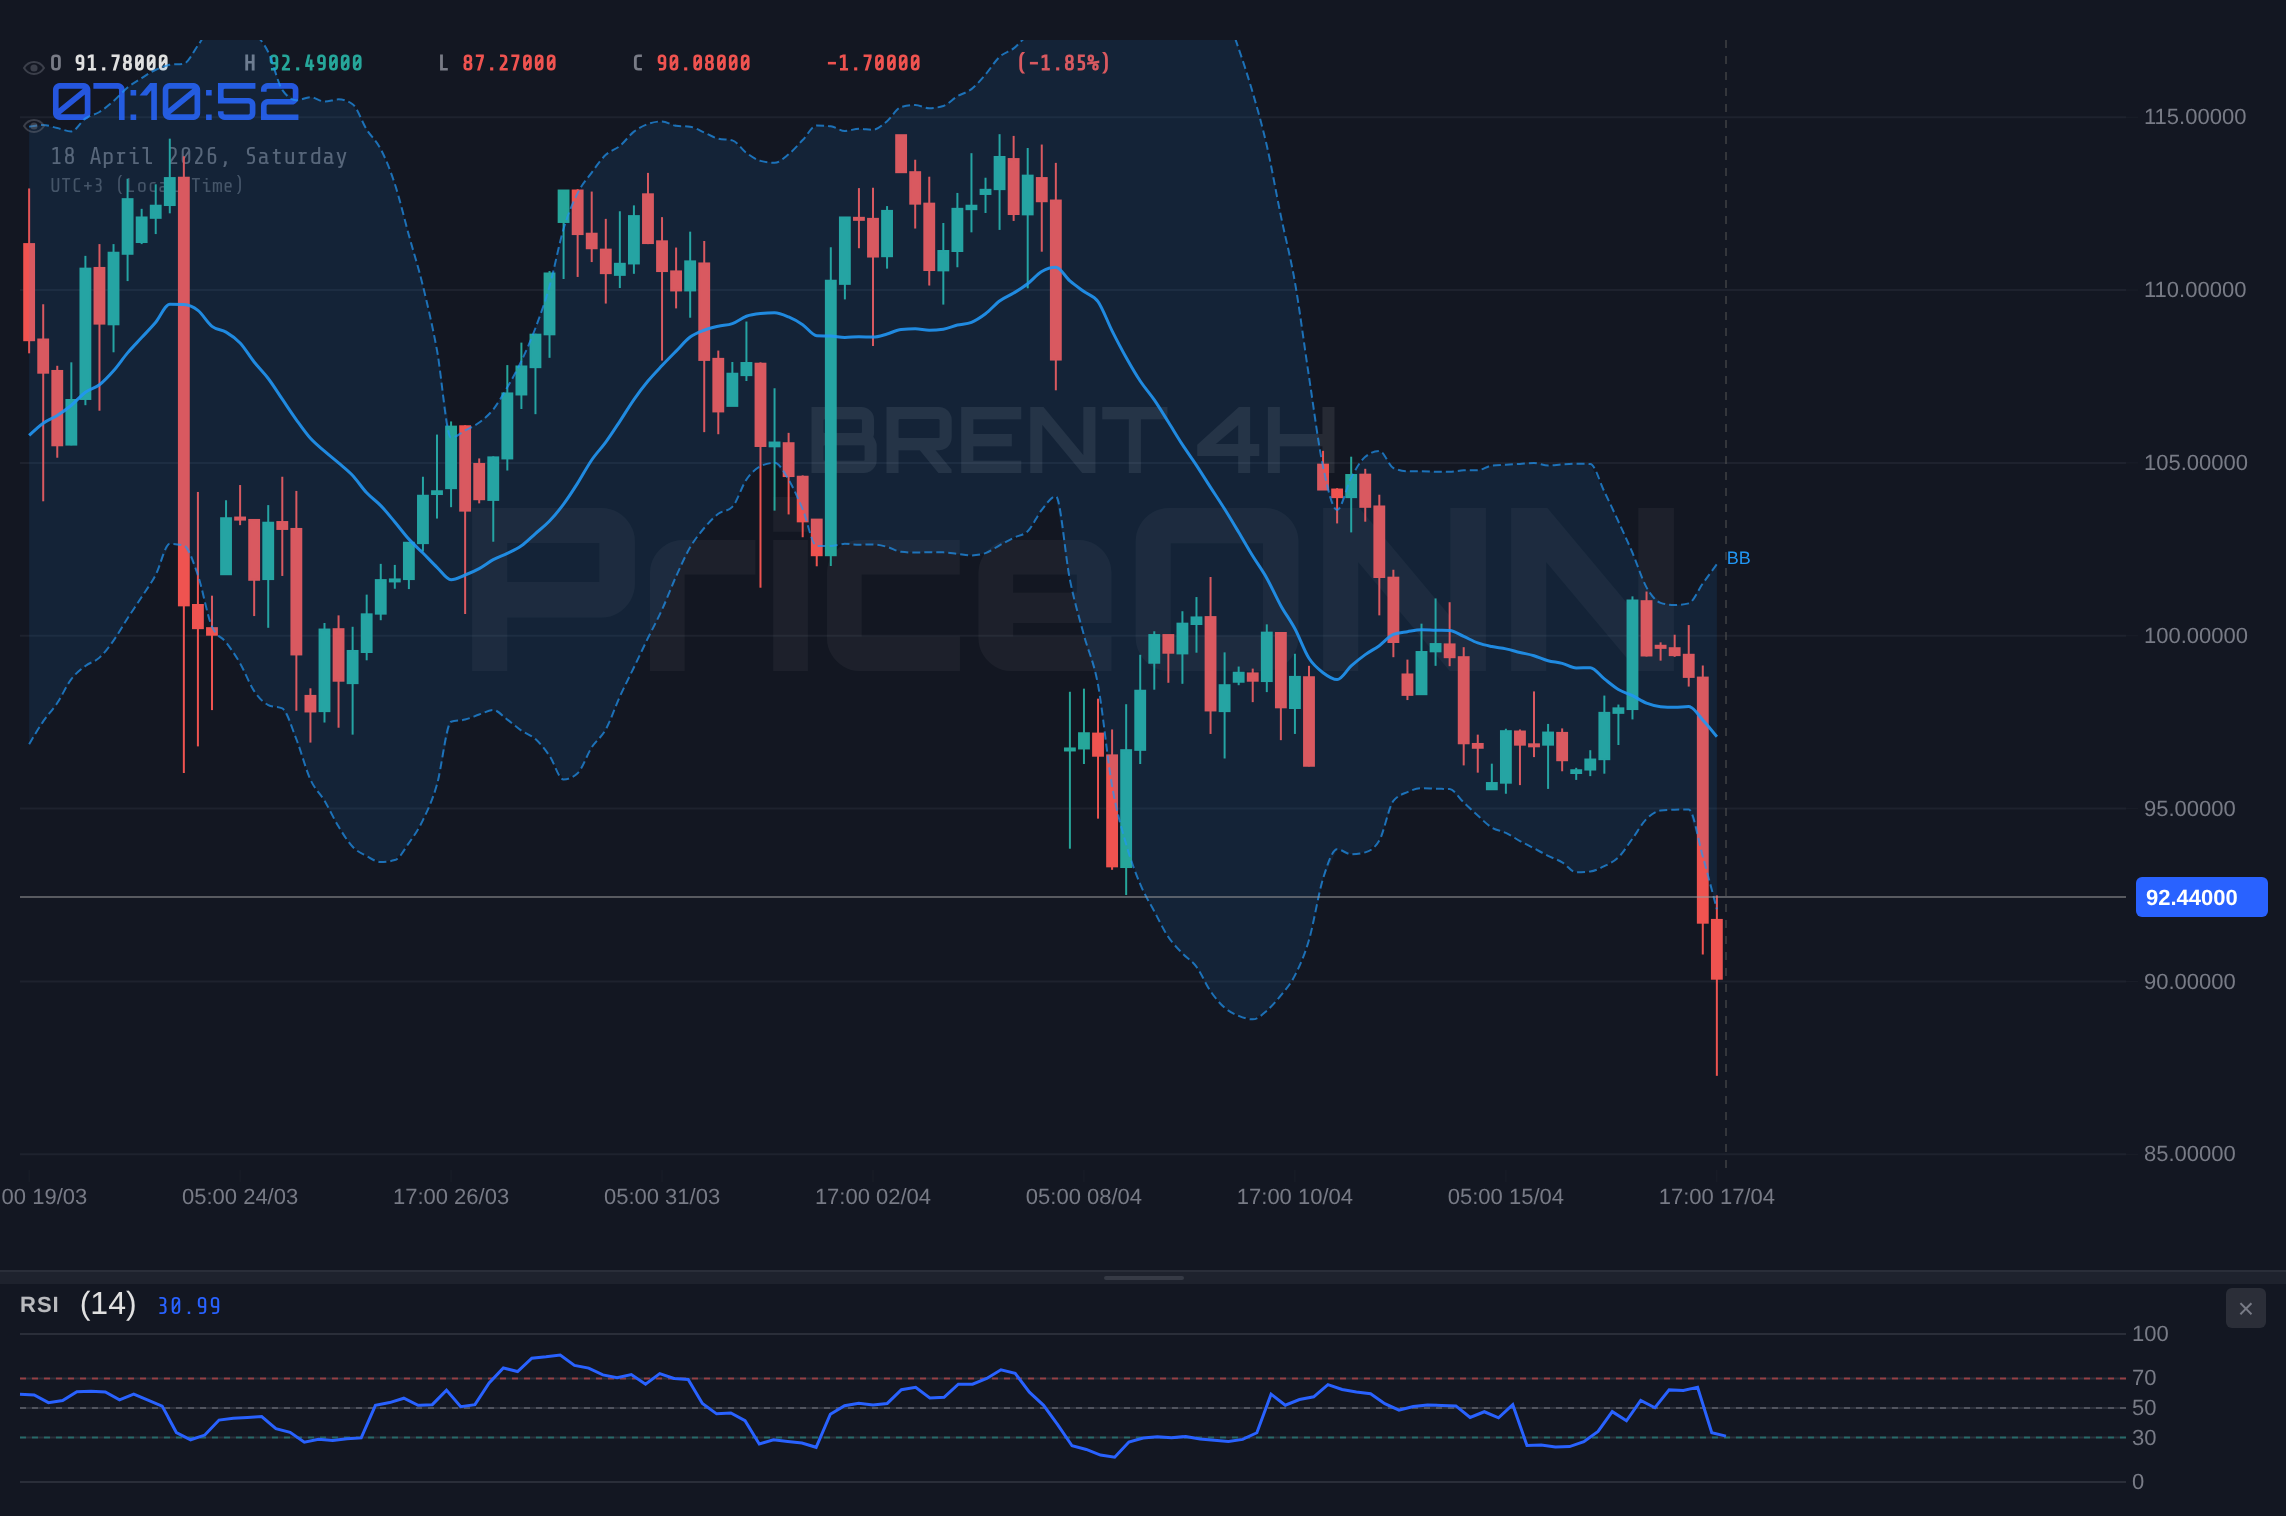
Uzun pozisyonların bu hızlı şekilde kapatılması, piyasanın temel yapısı tarafından daha da güçlendirildi. Fiyatlar düşmeye başladıkça, zarar durdur (stop-loss) emirleri tetiklendi ve bu da bir satış baskısı zincirleme etkisine yol açtı. Bu, duyarlılığın, özellikle jeopolitik manşetlere zaten duyarlı olan bir piyasada, temel arz endişelerini ne kadar hızlı geçersiz kılabileceğinin klasik bir örneğidir. Düşüşün hızı, algılanan tehdit azaldığında, temel arz ve talep temelleri bir gecede dramatik bir şekilde değişmemiş olsa bile, risk primlerinin ne kadar çabuk buharlaşabileceğini vurguluyor. Birkaç gün önce güçlü yükseliş momentumu gösteren 1H ve 4H grafikleri, tükenmişlik ve potansiyel bir tersine dönüş tablosu çizmeye başladı.
Teknik Göstergeler Aşağı Yönlü Baskıyı İşaret Ediyor
Teknik göstergeleri incelemek, geçen hafta Brent'in fiyat hareketine hakim olan düşüş eğiliminin daha net bir resmini sunuyor. 1 saatlik grafikte Göreceli Güç Endeksi (RSI) şu anda 38.43 seviyesinde. Henüz derin satış bölgesinde olmasa da, bu okuma açıkça düşüş eğilimini gösteriyor ve momentumun hala satıcılardan yana olduğunu ima ediyor. Ortalama Yön Endeksi (ADX) güçlü bir şekilde 37.6 seviyesinde bulunuyor ve sağlam bir düşüş trendinin yerleştiğini teyit ediyor. Bu, boğaların kontrol sahibi olduğu bir piyasa değil; daha ziyade ayılar kontrolü ele geçirmiş ve fiyatları aşağı çekiyor.
MACD göstergesi bu düşüş görünümünü daha da destekliyor. Negatif momentum gösteriyor, MACD çizgisi sinyal çizgisinin altında işlem görüyor. Bu sapma, düşüş hareketinin sağlam olduğunu ve sadece sığ bir düşüş olmadığını gösteriyor. 1 saatlik grafikteki Bollinger Bantları da düşüş eğilimi gösteriyor; fiyat orta bandın altında işlem görüyor, bu da zayıflık ve daha fazla aşağı yönlü potansiyel anlamına geliyor. Stokastik Osilatör, 43.63 K değeri ve 24.15 D değeri ile, satış bölgesinden uzaklaşırken kısa vadeli bir toparlanma ihtimalini ima etse de, genel trend göstergeleri güçlü bir şekilde düşüş eğilimini koruyor.
4 saatlik zaman dilimine bakıldığında tablo ağırlıklı olarak düşüş eğilimini koruyor. 35.15 seviyesindeki RSI, emtiayı satış bölgesinde tutuyor ve kısa vadeli bir toparlanmanın muhtemel olduğunu gösteriyor, ancak genel trendi geçersiz kılmıyor. Buradaki ADX, 22.5 ile biraz daha zayıf, orta derecede güçlü bir düşüş trendini gösteriyor ancak hala aşağı yönlü momentumu teyit ediyor. MACD negatif momentum göstermeye devam ediyor. Bollinger Bantları fiyatın altında konumlanmış, düşüş eğilimini pekiştiriyor. Günlük grafikte, 43.94 RSI hala düşüş momentumuna işaret ediyor, ancak daha kısa zaman dilimlerine göre daha az aşırı. Günlük grafikteki 34.16 ADX özellikle dikkat çekici; güçlü ve yerleşik bir düşüş trendini işaret ediyor. Bu çoklu zaman dilimlerindeki düşüş sinyallerinin birleşimi, Brent petrolü için en az dirençli yolun, geçici karşı trend rallileri olasılığına rağmen, kısa ve orta vadede aşağı yönlü olduğunu gösteriyor.
Kilit Seviyeleri Yönetmek: Destek ve Direnç Bölgeleri
Brent 92.54 dolardan işlem görürken, yatırımcıların izlemesi gereken birkaç kilit seviye bulunuyor. Aşağı yönde, anlık destek 91.28 dolarda, ardından daha önemli bir psikolojik seviye olan 90.24 dolarda yer alıyor. Bunun altında, 89.58 dolar işareti kritik bir tabanı temsil ediyor. 89.58 doların altında kararlı bir kırılma, sert satışların devam ettiğini ve potansiyel olarak 85.51 dolar civarındaki bir sonraki ana destek bölgesini hedefleyebileceğini gösterebilir. Bu seviye tarihsel olarak güçlü bir konsolidasyon alanı olarak işlev görmüştür ve buranın kırılması, piyasa duyarlılığında ve temellerinde önemli bir değişimi gösterecektir.
Yukarı yönde, anlık direnç 92.98 dolarda bulunuyor. Alıcılar fiyatları bu seviyenin üzerine çıkarabilirse, bir sonraki önemli engel 93.64 dolar olacaktır. Bu direncin kırılması, psikolojik 95.00 dolar seviyesini devreye sokarak daha fazla yükselişi teşvik edebilir. Ancak, daha zorlu direnç daha yukarıda yatıyor. 96.97 dolar civarındaki bölge daha önce destek olarak işlev görmüş ve şimdi güçlü bir direnç bölgesi sunuyor. 96.97 doların üzerinde sürdürülebilir bir hareket, mevcut düşüş trendini geçersiz kılmak ve potansiyel bir tersine dönüş sinyali vermek için gerekecektir. Bunun ötesinde, eski bir zirve olan 101.86 dolar seviyesi, herhangi bir sürdürülebilir yükseliş toparlanması için önemli bir hedef olarak duruyor, ancak mevcut teknik iklimde bu pek olası görünmüyor.
Özellikle 92.54 dolar ile 93.64 dolar arasındaki aralık özellikle ilgi çekici. Fiyatın kapandığı bölgeyi ve ilk direnç katmanını temsil ediyor. 93.64 doların üzerine kararlı bir şekilde kırılamaması, fiyatın hızla geri çekilmesine neden olabilir ve teknik göstergelerde gözlemlenen düşüş eğilimini pekiştirebilir. Tersine, 93.64 doların üzerinde güçlü bir kapanış, tercihen artan hacimle, satıcılardan potansiyel bir panik satışının ilk işareti olabilir ve 96.97 dolara doğru kısa vadeli bir toparlanma rallisinin kapısını aralayabilir. Bu seviyeler ile hakim piyasa duyarlılığı arasındaki etkileşim, Brent petrolünün yakın vadeli yönünü belirleyecektir.
Jeopolitik ve Ekonomik Verilerin Rolü
Geçen hafta Brent petrolündeki dramatik fiyat dalgalanması, jeopolitik anlatılardaki değişimlerden büyük ölçüde etkilendi. Orta Doğu'da, özellikle Hürmüz Boğazı ile ilgili gerilimlerin azaldığına dair raporlar, satışların birincil katalizörü oldu. Arz kesintisi riski azaldığında, piyasa fiyatlara yansıtılan risk primini düşürme eğilimindedir. Bu, spekülatif uzun pozisyonlar pozisyonlarını kapattıkça genellikle keskin ve hızlı fiyat düşüşlerine yol açar.
Piyasanın tepkisi, petrol fiyatlarının jeopolitik olaylara karşı hassasiyetini vurguluyor. Kesin bir kesinti olmasa bile, sadece artan risk *algısı* bile fiyatları önemli ölçüde etkileyebilir. Tersine, azalan risk algısı da eşit derecede güçlü, ancak tersine bir etkiye sahip olabilir. Önümüzdeki günler, bölgeden gelen haber akışını izlemek için kritik olacaktır. Gerilimlerin yeniden tırmanması, yükseliş eğilimini hızla yeniden alevlendirebilirken, devam eden diplomatik ilerleme veya yeni olayların olmaması, yatırımcıların diğer temel etkenlere odaklanmasıyla fiyatların daha da düşmesine neden olabilir.
Jeopolitik manşetlerin ötesinde, daha geniş ekonomik faktörler önemli rol oynamaya devam ediyor. ABD Doları'nın DXY tarafından ölçülen gücü, Brent gibi emtialar için önemli bir ters korelasyon olmaya devam ediyor. DXY geçen hafta dalgalanmalar göstererek 97.9 civarında işlem gördü. Genellikle, güçlenen bir DXY, petrol fiyatları üzerinde aşağı yönlü baskı uygular. Ayrıca, merkez bankası politikaları ve enflasyon verilerinden etkilenen küresel ekonomik büyüme beklentileri, petrol talebini belirleyecektir. Son ekonomik takvim, bazı enflasyon verileri (örneğin, bir olay için USD rakamı 2.6) kalıcı fiyat baskılarına işaret ederken, diğerleri ılımlı büyümeye işaret ediyordu. Bu belirsizlik, yatırımcıların uzun vadeli talep görünümünü değerlendirme çabalarına bir katman daha karmaşıklık katıyor.
Korelasyon Analizi: DXY, Hisse Senetleri ve Brent'in Yolu
Brent'in diğer büyük piyasa araçlarıyla nasıl korele olduğunu anlamak, kapsamlı bir ticaret stratejisi için gereklidir. Dolar Endeksi (DXY), kritik bir barometre görevi görüyor. Geçen hafta, Brent en keskin düşüşlerini yaşarken, DXY 97.9 civarında dalgalı bir hareket gösterdi. Tipik olarak, güçlenen bir DXY, petrol fiyatları üzerinde aşağı yönlü baskı uygular ve bunun tersi de geçerlidir. Dolar yükseliş trendini sürdürürse, bu Brent'te potansiyel bir toparlanma için bir engel olabilir. Yatırımcılar, önümüzdeki hafta DXY'nin yerini koruma veya daha da yükselme yeteneğini yakından izleyecekler.
Hisse senedi piyasaları da değerli bir bağlam sağlıyor. S&P 500 (SP500) ve Nasdaq (Nasdaq100) endeksleri geçen hafta güç gösterdi; SP500 6572.87, Nasdaq ise 26682.75 seviyesinden kapandı. Genel olarak, hisse senetlerinde güçlü bir risk iştahı, sağlıklı bir talep ile sağlam bir küresel ekonomiyi ima ettiği için daha yüksek petrol fiyatlarıyla ilişkilidir. Tersine, hisse senetlerinde bir satış, yatırımcılar daha riskli varlıklardan uzaklaştıkça genellikle petrol düşüşüyle aynı zamana denk gelir. Hisse senetlerinin keskin bir düşüş yaşarken direnç göstermesiyle oluşan son ayrışma dikkat çekiyor. Bu, petrolün şu anda geniş piyasa duyarlılığından ziyade belirli arz/talep faktörleri ve jeopolitik risk primleri tarafından daha fazla yönlendirildiğini gösterebilir veya emtialardan bir rotasyon sinyali verebilir.
Petrol fiyatları ile enflasyon beklentileri arasındaki ilişki merkezi bir tema olmaya devam ediyor. Brent'in fiyatı, küresel enflasyon hesaplamalarında önemli bir girdidir. Petrol fiyatları yükseldiğinde, enflasyonist baskılara katkıda bulunabilir ve merkez bankalarını daha sıkı para politikaları benimsemeye teşvik edebilir. Tersine, düşen petrol fiyatları enflasyon endişelerini hafifletmeye yardımcı olabilir. Piyasa, daha düşük petrol fiyatlarının daha geniş ekonomik görünüm ve potansiyel merkez bankası tepkileri üzerindeki etkisini ölçmek için yaklaşan ekonomik verileri, özellikle enflasyon raporlarını inceleyecektir. Petrol fiyatları, enflasyon ve para politikası arasındaki bu geri besleme döngüsü, izlenmesi gereken kritik bir dinamiktir.
Ticaret Senaryoları: Olasılıkları Haritalama
Düşüş Senaryosu: Düşüş Trendi Devam Ediyor
65% OlasılıkNötr Senaryo: 92.54 Dolar Civarında Konsolidasyon
25% OlasılıkYükseliş Senaryosu: Destekten Toparlanma
10% OlasılıkGeleceğe Bakış: Gelecek Hafta Neler İzlenmeli
Gelecek işlem haftasına bakarken, Brent petrolü için odak noktası, düşüş momentumunun devam edip etmeyeceği veya fiyatın mevcut seviyeler etrafında istikrarlı bir zemin bulup bulmayacağı olacak. Teknik tablo, özellikle kısa vadeli zaman dilimlerindeki güçlü ADX ve düşüş eğilimli RSI okumaları, daha fazla düşüşün olası olduğunu gösteriyor. Ancak, 89.58 dolar ve 85.51 dolar gibi kritik destek seviyelerine yakınlık, özellikle jeopolitik gerilimler yeniden ortaya çıkarsa veya önemli ekonomik veriler daha güçlü bir talep görünümüne işaret ederse bir taban sağlayabilir.
Yatırımcılar, anlık savaş alanı olarak 91.28 ila 93.64 dolar aralığını yakından izleyecekler. 93.64 doların üzerine kararlı bir şekilde kırılamaması, fiyatın daha düşük destekleri yeniden test etmesine neden olabilirken, bu seviyenin üzerine güçlü bir hareket kısa pozisyon kapatma rallisini başlatabilir. DXY'nin hareketi ve yaklaşan ekonomik takvim, özellikle büyük ekonomilerden gelen önemli enflasyon veya istihdam rakamları, piyasa duyarlılığını şekillendirmede kritik olacaktır. Piyasanın bu veri noktalarına tepkisi ve bunların petrol için mevcut düşüş anlatısını güçlendirip güçlendirmediği veya çürütüp çürütmediği anahtar olacaktır.
Özellikle yeni katalizörlerin olmaması durumunda, bir konsolidasyon aşaması olasılığı da önemli olmaya devam ediyor. Böyle bir senaryoda, Brent belirli bir aralıkta işlem görebilir ve aralık içi ticaret stratejileri için fırsatlar sunabilir. Ancak, ADX gibi güçlü trend sinyalleri göz önüne alındığında, konsolidasyon dönemi, sürdürülebilir bir kararsızlık döneminden ziyade daha fazla yönlü bir hareketin öncüsü olabilir. Risk yönetimi çok önemli olacak; yatırımcıların kilit destek ve direnç seviyelerine saygı duymaları ve piyasayı kovalamaktan kaçınmaları, önemli pozisyonlar almadan önce fiyat hareketinin yönü teyit etmesine izin vermeleri tavsiye edilir.
| Gösterge | Değer | Sinyal | Yorum |
|---|---|---|---|
| RSI (14) | 38.43 | Düşüş | Aşağı yönlü momentumu ve daha fazla düşüş potansiyelini gösteriyor. |
| MACD | Negatif Momentum | Düşüş | MACD çizgisi sinyal çizgisinin altında, satış baskısını gösteriyor. |
| Stokastik | K:43.63, D:24.15 | Nötr | Satış bölgesinden uzaklaşıyor, ancak trend göstergeleri düşüş eğiliminde. |
| ADX | 37.60 | Güçlü Trend | 1H grafiğinde güçlü bir düşüş trendinin hakim olduğunu teyit ediyor. |
| Bollinger Bantları | Fiyat Orta Bandın Altında | Düşüş | Zayıflık ve daha fazla aşağı yönlü potansiyeli gösteriyor. |
Sıkça Sorulan Sorular: BRENT Analizi
BRENT'in 90.24 dolar destek seviyesinin altına kırması durumunda ne olur?
Brent petrolünde 90.24 doların altına bir kırılma, düşüş trendini pekiştirecek, potansiyel olarak zarar durdur emirlerini tetikleyecek ve 89.58 dolar destek seviyesine doğru düşüşleri hızlandıracaktır. Bu, jeopolitik korkuların azalması ve potansiyel olarak daha zayıf talep görünümlerinin yönlendirdiği devam eden aşağı yönlü momentumu gösterecektir.
RSI 38.43 iken mevcut 92.54 dolarlık seviyelerden BRENT alınmalı mı?
38.43 RSI ve ADX 37.6 ile gösterilen güçlü düşüş trendi göz önüne alındığında, 92.54 dolardan alım yapılması önerilmez. Kısa vadeli bir toparlanma satış bölgesinden mümkün olsa da, 93.64 doların üzerine bir kırılma gibi daha net bir yükseliş onayı ortaya çıkana kadar risk/ödül oranı elverişli değildir.
37.6'daki ADX şu anda BRENT için bir satış sinyali mi?
37.6'lık bir ADX okuması, güçlü bir düşüş trendinin hakim olduğunu doğrular, doğrudan bir satış sinyali olmasa da, herhangi bir toparlanmanın güçlü satış baskısıyla karşılaşma olasılığının yüksek olduğunu gösterir. Bu seviye, yatırımcıların geri çekilmelerde kısa pozisyon fırsatları araması veya doğrulanmış bir trend dönüşünü beklemesi gerektiğini ima eder.
Bu hafta açıklanacak enflasyon verileri BRENT fiyatlarını nasıl etkiler?
Beklenenden yüksek enflasyon verileri, enflasyona karşı korunma aracı olarak Brent gibi emtialara olan talebi artırabilir ve potansiyel olarak fiyatları destekleyebilir. Tersine, daha zayıf enflasyon veya ekonomik yavaşlamaya işaret eden veriler, talep beklentilerini azaltabilir ve özellikle merkez bankalarını para politikası gevşetme politikalarını düşünmeye sevk ederse Brent üzerinde daha fazla aşağı yönlü baskı oluşturabilir.
Piyasaları canlı takip edin
AI destekli analizler, teknik göstergeler ve anlık fiyat verileri.
Telegram Kanalımıza Katılın
Son dakika piyasa haberleri, AI analizleri ve trading sinyalleri.
Kanala Katıl