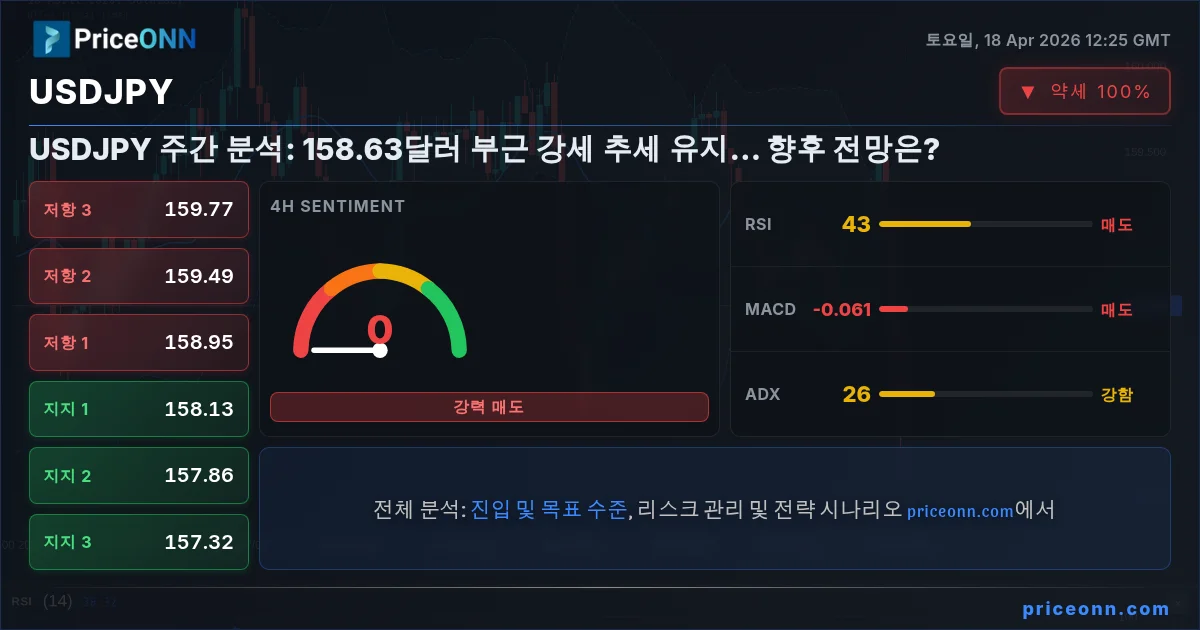
USDJPY Insight Card

The USDJPY currency pair concluded last week trading near the pivotal $158.63 mark, a level that has become a focal point for traders and analysts alike. As we step into a new trading week, the overarching bullish trend remains intact, yet faces significant headwinds and confluence of technical indicators that suggest a period of consolidation or potential reversal could be on the horizon. This analysis delves into the intricate interplay of macroeconomic factors, central bank policies, and technical chart patterns that are shaping the outlook for USDJPY, providing a comprehensive view of the forces at play and the key levels to monitor. We will explore the conditions that could propel the pair higher towards the 160.00 psychological level, the scenarios that might lead to a bearish retracement, and the neutral range where price action could become range-bound. Understanding these dynamics is crucial for navigating the upcoming trading sessions with a clear strategy.

⚡ Key Takeaways
  • USDJPY is trading near $158.63, with the 1H RSI at 46.66 indicating bearish momentum within a broader bullish trend.
  • Critical support for USDJPY lies at $158.22, while resistance is observed around $158.55, according to 1H data.
  • The 4H chart shows ADX at 38.1 suggesting a strong trend, but conflicting signals from Stochastic and RSI require careful observation.
  • The overarching bullish trend on the 1D chart is challenged by negative momentum on the 1H and 4H MACD, highlighting a potential divergence that warrants attention.

Last week was a testament to the persistent strength of the US Dollar against the Japanese Yen, even amidst shifting global sentiment and fluctuating risk appetite. The USDJPY pair demonstrated remarkable resilience, largely driven by the divergence in monetary policy expectations between the Federal Reserve and the Bank of Japan. While the Fed has maintained a hawkish stance, signaling a potential delay in rate cuts due to persistent inflation, the Bank of Japan continues to navigate its ultra-loose policy, albeit with subtle hints of a potential shift on the horizon. This policy divergence has been a primary driver for the pair's upward trajectory, pushing it towards levels not seen in decades. The ongoing carry trade, where investors borrow in a low-interest-rate currency (JPY) to invest in a higher-yield currency (USD), continues to provide fundamental support.

The economic calendar provided some crucial data points that influenced market sentiment. While specific US economic releases were mixed, the prevailing narrative around inflation and the Fed's reaction function remained dominant. Investors parsed through employment figures and inflation data, seeking clues about the future path of US interest rates. Any indication of sticky inflation or a robust labor market tends to reinforce the Fed's cautious approach, thereby bolstering the dollar. Conversely, signs of economic cooling could prompt speculation about a sooner-than-expected rate cut, potentially creating headwinds for USD.

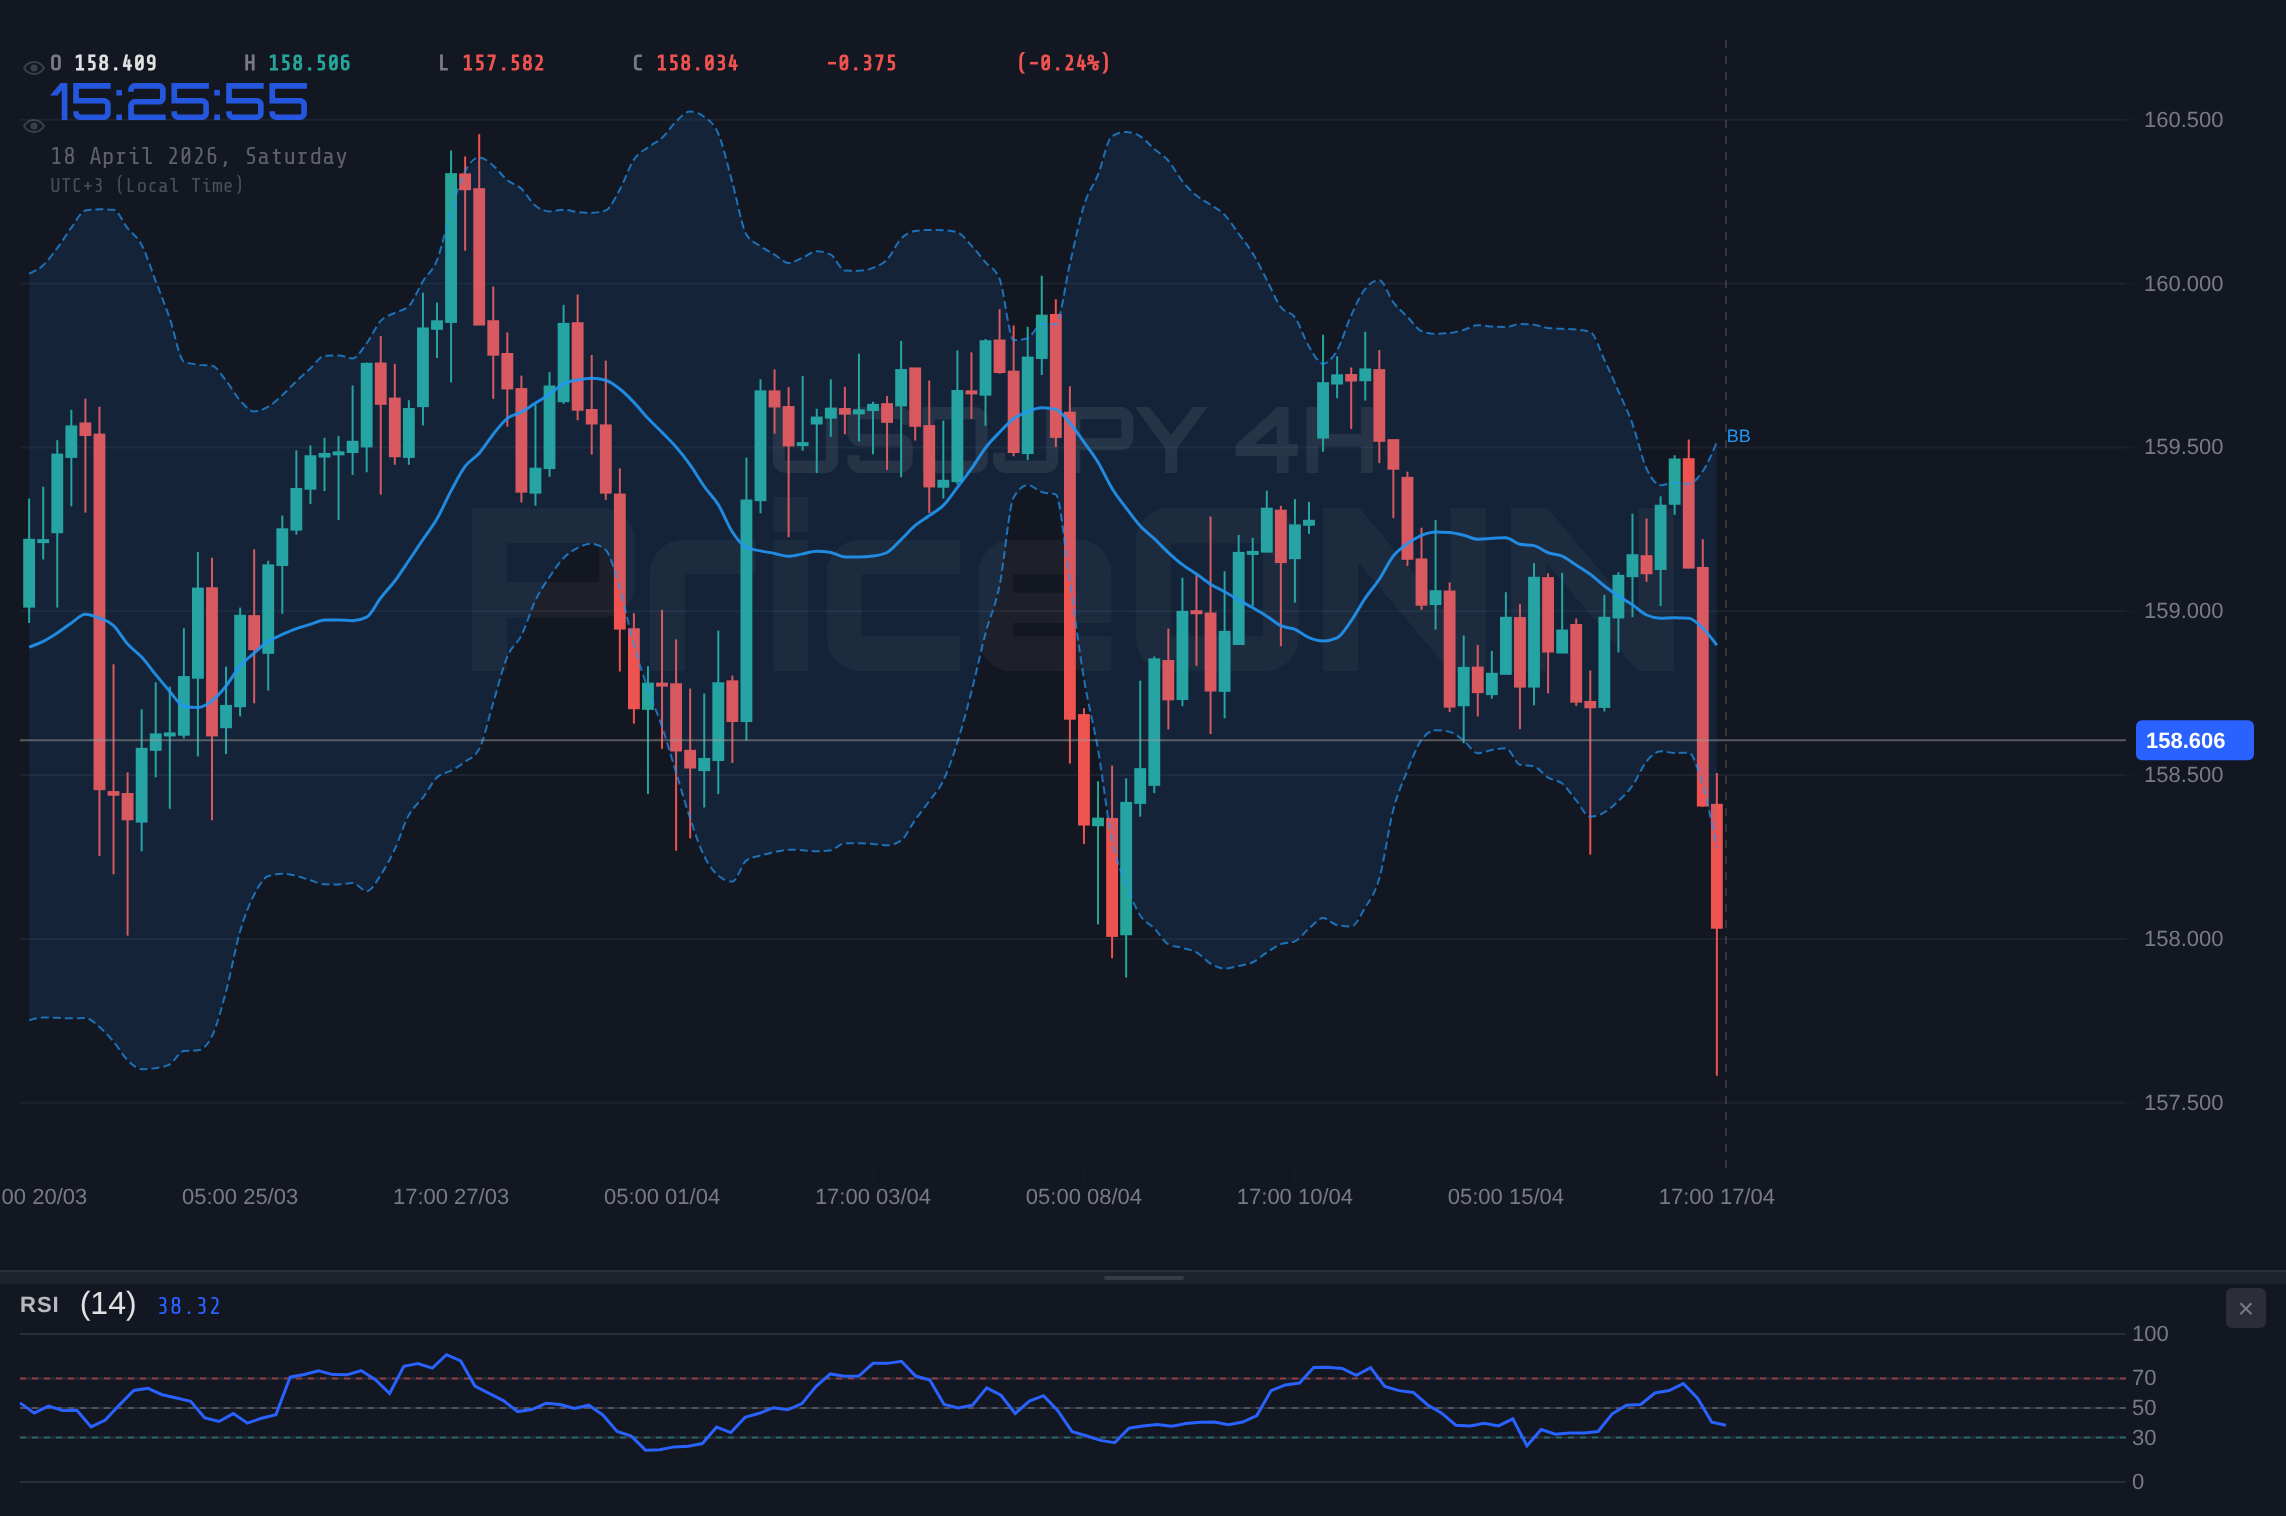
USDJPY 4H Chart - USDJPY Weekly: Bullish Trend Holds Near $158.63 – What's Next?
USDJPY 4H Chart

From a technical standpoint, USDJPY has been carving out a bullish trend on the longer timeframes, particularly evident on the daily chart where the trend strength is rated at 83%. However, a closer examination of the shorter timeframes, such as the 1-hour and 4-hour charts, reveals a more nuanced picture. The 1H chart indicates a neutral trend with a power of 50%, supported by an RSI of 46.66 and negative MACD momentum. This suggests that while the long-term bias remains bullish, intraday trading dynamics show a potential for a pause or even a short-term pullback. The ADX at 35.55 on the 1H chart indicates a strong trend, but its directionality is being challenged by the conflicting signals from other oscillators. This internal conflict within the technical indicators is precisely what creates the current market tension.

The 4-hour timeframe presents a similar dichotomy. While the ADX at 38.1 signals a strong trend, the RSI(14) at 42.75 suggests a downward bias, and the MACD is showing negative momentum. The Stochastic oscillator, however, gives a bullish signal with %K above %D. This divergence among indicators on the 4H chart means that short-term direction is highly uncertain. Traders are likely waiting for a clearer signal or a decisive break of key levels before committing to significant positions. The battle between bullish long-term conviction and bearish short-term signals is creating a choppy trading environment, where price action can be erratic.

The daily chart, however, paints a more confident bullish picture, with a trend strength of 83% and positive MACD momentum. The RSI(14) at 48.98 is in neutral territory, but the overall setup suggests that buyers have been in control over the past few weeks. The Bollinger Bands on the daily chart are positioned above the middle band, indicating an upward bias. Yet, even on this longer timeframe, the Stochastic oscillator shows a potential bearish signal with %K falling below %D, and the ADX at 22.43 indicates a trend that, while present, is not overwhelmingly strong. This suggests that the bullish move might be losing some steam, and a period of consolidation is plausible before the next significant leg higher or a notable correction.

Considering the current price of $158.63, the immediate support levels on the 1H chart are found at $158.22, $158.01, and $157.89. These are the levels where a short-term bounce might occur if the price experiences immediate selling pressure. Conversely, resistance on the 1H chart is located at $158.55, $158.66, and $158.87. A decisive breach above the $158.87 resistance could signal an acceleration of the bullish momentum, potentially targeting higher psychological levels. The battle between these immediate support and resistance zones will likely dictate the intraday price action.

On the 4H chart, the support levels are more substantial, situated at $158.13, $157.86, and $157.31. A break below the $157.31 level would significantly weaken the bullish outlook and could signal a deeper correction. Resistance on the 4H chart is higher, at $158.95, $159.49, and $159.76. These levels represent more significant hurdles for the bulls, and a sustained move above $159.76 would strongly indicate a continuation of the bullish trend, setting the stage for a test of the 160.00 handle.

The daily support levels are even more critical, found at $158.48, $157.84, and $157.44. The $158.48 level is particularly important as it aligns closely with the current trading range and acts as the immediate floor. A daily close below this level could trigger significant selling pressure. On the resistance side, the daily levels are at $159.52, $159.93, and $160.56. The $159.52 level is the first significant resistance to watch, and a break above it would open the door for a potential move towards the psychologically important 160.00 mark. The $159.93 level represents a very strong resistance, and clearing it would be a major bullish signal.

The recent news flow, particularly regarding the US dollar's performance and its correlation with rising oil prices, adds another layer of complexity. As reported, oil prices remain elevated, which typically fuels inflation concerns. This could keep the Federal Reserve on a hawkish path, indirectly supporting USDJPY. However, the impact of high energy prices on consumer spending and economic growth is a double-edged sword. While it might bolster the dollar through inflation expectations, it could also dampen economic activity, leading to a reassessment of Fed policy. The ongoing geopolitical tensions, although currently easing in some regions, remain a background risk that could trigger safe-haven flows, potentially benefiting the Yen in certain scenarios, though the dominant trend has favored the dollar.

The question of whether AUD is projected to get stronger than the Yen over the next week is an interesting one, highlighting the interdependencies within currency markets. While the immediate focus is on USDJPY, the relative strength of other major currencies against the Yen is also relevant. If the Australian Dollar, for instance, shows signs of significant strengthening due to commodity prices or RBA policy shifts, it could impact the broader Yen sentiment. However, currently, the USDJPY pair's trajectory is primarily dictated by the Fed-BoJ policy divergence and the carry trade dynamics. Any significant shift in the Yen's strength against the Australian Dollar would likely be a secondary effect, unless it signals a broader change in global risk sentiment or a major shift in Japanese monetary policy.

The technical picture is currently in a state of flux, characterized by conflicting signals across different timeframes. On the 1-hour chart, the RSI at 46.66 and negative MACD momentum suggest short-term weakness, with support at $158.22 and $158.01. The ADX at 35.55 indicates a strong trend, but the Stochastic giving a bullish signal (K > D) adds to the confusion. This setup suggests that while bears might be attempting to regain control on an intraday basis, the underlying long-term bullish trend remains a significant factor. The key for intraday traders will be to watch for a decisive break of either the immediate support or resistance levels.

The 4-hour chart offers a slightly different perspective. The ADX at 38.1 still points to a strong trend, but the RSI at 42.75 and negative MACD momentum lean bearish in the medium term. However, the Stochastic is bullish (%K > %D), and the overall signal is neutral, reflecting the indecision in the market. Support levels at $158.13 and $157.86 are critical. A failure to hold these levels could trigger a more significant decline, potentially testing the daily support at $157.44. Resistance at $158.95 and $159.49 will be the immediate hurdles for any bullish recovery.

The daily chart, as mentioned, retains a bullish bias with a trend strength of 83%. However, the Stochastic oscillator is showing a bearish signal (K

The key to navigating this complex market lies in watching specific price action and confirmation signals. The $158.50 level is currently acting as a critical pivot. A sustained move below this level on the 1-hour chart could initiate a short-term downtrend targeting $158.22 and potentially $158.01. Conversely, a decisive break and hold above $158.80 could signal a resumption of the bullish trend, aiming for $159.49 and beyond. The market sentiment analysis, which shows a mixed picture with strong long-term bullish conviction but short-term bearish pressures, reinforces the need for caution and adherence to risk management principles. The interplay between the dollar's strength, driven by Fed policy expectations, and any potential intervention or policy shifts from the Bank of Japan will be the overarching theme.

The current technical signals present a fascinating battleground. While the daily chart suggests a continuation of the bullish trend, the shorter timeframes are flashing warning signs. The RSI(14) on the 1H chart at 46.66 indicates bearish momentum, while the daily RSI at 48.98 is neutral. The MACD on the 1H and 4H charts is negative, contrasting with the positive MACD on the daily chart. Stochastic oscillators are also giving conflicting signals across timeframes, with some in overbought territory and others suggesting further downside. This technical divergence is a classic sign of a market in transition, where the next directional move will likely be triggered by a fundamental catalyst or a significant break of a key technical level.

The potential for a neutral, range-bound scenario cannot be ignored. If neither the bulls nor the bears can decisively break through their respective barriers, USDJPY could find itself consolidating between key support and resistance levels for an extended period. This would likely occur if upcoming economic data fails to provide a clear direction for Fed policy or if geopolitical events create uncertainty that dampens risk appetite without a clear safe-haven preference. In such a scenario, traders would focus on the boundaries of the range – specifically, the $158.22 support and the $158.87 resistance on the 1H chart – looking for opportunities to trade the range or waiting for a breakout.

The probability of each scenario playing out depends heavily on upcoming economic data and central bank commentary. Currently, the technical picture on the daily chart leans bullish, but the short-term indicators are painting a more cautious, if not bearish, short-term outlook. This suggests that the most likely scenario in the immediate short term (intraday to few days) is a period of consolidation or a mild bearish retracement, perhaps targeting the $158.00 handle. However, the underlying bullish trend remains strong, suggesting that any pullback might be an opportunity for buyers to re-enter the market at more attractive levels, especially if the Fed maintains its hawkish stance.

Looking ahead, the key events to watch will be any significant shifts in the Federal Reserve's rhetoric regarding inflation and interest rates. Any data that suggests inflation is cooling faster than expected could lead to a reassessment of Fed policy and put pressure on the dollar. Conversely, stronger-than-expected inflation or employment data would likely reinforce the bullish case for USDJPY. The Bank of Japan's policy stance also remains a critical factor; any hints of a move away from negative interest rates, however subtle, could cause significant volatility. Geopolitical developments, particularly those impacting oil prices and global risk sentiment, will also play a role in shaping currency market dynamics.

USDJPY is at a critical juncture. The long-term bullish trend is supported by fundamental drivers, but short-term technical indicators are showing signs of exhaustion and potential reversal. Traders should exercise caution, paying close attention to the key levels around $158.22 (support) and $158.87 (resistance) for intraday direction. A sustained break above $159.49 on the 4H chart would confirm a bullish continuation, while a decisive close below the daily support at $158.48 would signal a potential shift in momentum. Patience and disciplined risk management will be paramount in navigating the choppiness that is likely to characterize the upcoming trading week.

Bullish Scenario: The Climb Continues

35% Probability
Trigger: Sustained break and daily close above $159.52 resistance.
Invalidation: Daily close below $157.44 support.
Target 1: $159.93 (Psychological level, test of previous highs)
Target 2: $160.56 (Significant daily resistance, potential upside extension)

Bearish Scenario: The Pullback Deepens

45% Probability
Trigger: Daily close below $158.48 support, confirmed by negative 4H MACD crossover.
Invalidation: Daily close above $159.93 resistance.
Target 1: $157.84 (Key 4H support level)
Target 2: $157.44 (Significant daily support, potential for extended fall)

Neutral Scenario: Range-Bound Consolidation

20% Probability
Trigger: Price action remains confined between $158.22 support and $158.87 resistance on the 1H chart.
Invalidation: Clear break of either the $158.22 support or $158.87 resistance.
Target 1: $158.00 (Mid-range consolidation target)
Target 2: $159.00 (Upper range boundary test)

Frequently Asked Questions: USDJPY Analysis

What happens if USDJPY breaks below the $158.48 daily support level?

A daily close below $158.48 would invalidate the immediate bullish outlook and could trigger a significant pullback. This scenario would likely target the next key support at $157.84, potentially extending towards $157.44 as sellers gain control.

Should I consider buying USDJPY near the current $158.63 levels given the mixed signals?

Caution is advised due to conflicting signals across timeframes. A confirmed bullish setup would require a daily close above $159.52, targeting $159.93. Waiting for such confirmation or a clear pullback to stronger support levels like $157.84 would offer a better risk-reward ratio.

Is the RSI at 46.66 on the 1H chart a sell signal for USDJPY?

An RSI of 46.66 on the 1H chart indicates bearish momentum in the short term, but it is not yet in oversold territory. Combined with negative MACD momentum, it suggests potential for further downside intraday, but confirmation from a break of key support levels is needed before considering a short position.

How will upcoming US inflation data affect USDJPY this week?

Higher-than-expected inflation data would likely reinforce the Fed's hawkish stance, supporting USDJPY and potentially pushing it towards resistance levels like $159.52. Conversely, softer inflation could lead to speculation of Fed rate cuts, weakening the dollar and USDJPY.

💎

Navigating the complexities of USDJPY requires a blend of technical precision and fundamental awareness. While the long-term bullish trend remains a significant factor, the current technical divergence necessitates a cautious approach.

Disciplined risk management and a focus on confirmed signals will be crucial. Patience often rewards the prepared trader, and the market will likely offer clear opportunities for those who wait for the right setup.

📊 Indicator Dashboard
IndicatorValueSignalInterpretation
RSI (14)46.66BearishWeakening momentum on 1H, neutral on 1D.
MACD-0.491BearishNegative momentum on 1H/4H, positive on 1D.
StochasticK=50.2, D=27.5BullishConflicting signals across timeframes, potential for reversal.
ADX35.55Strong TrendStrong trend indicated on 1H, but direction debated.
Bollinger BandsMiddle BandNeutralPrice hovering around middle band on 1H, above on 1D.
▲ Support
S1 (1H)158.22
S2 (4H)157.86
S3 (1D)157.44
▼ Resistance
R1 (1H)158.55
R2 (4H)158.95
R3 (1D)159.52

What I'm Watching This Week:

  • Federal Reserve Rhetoric: Any hints about inflation and future rate policy will be critical. Signs of sticky inflation could boost USDJPY, while softer data might pressure it.
  • Daily Close Above $158.55: A decisive daily close above this level on USDJPY would signal short-term bullish momentum, potentially targeting $158.95.
  • Break Below $158.22: A failure to hold the $158.22 support on the 1H chart could initiate a deeper pullback towards $157.86.

The journey of USDJPY is far from over, and this week promises to be another chapter in its fascinating market narrative. While the bullish trend has been dominant, the current technical divergences and the ever-present influence of macroeconomic data suggest that volatility will remain a key characteristic. Traders who remain vigilant, adhere to their risk parameters, and wait for clear setups will be best positioned to capitalize on the opportunities that emerge from this dynamic market landscape.