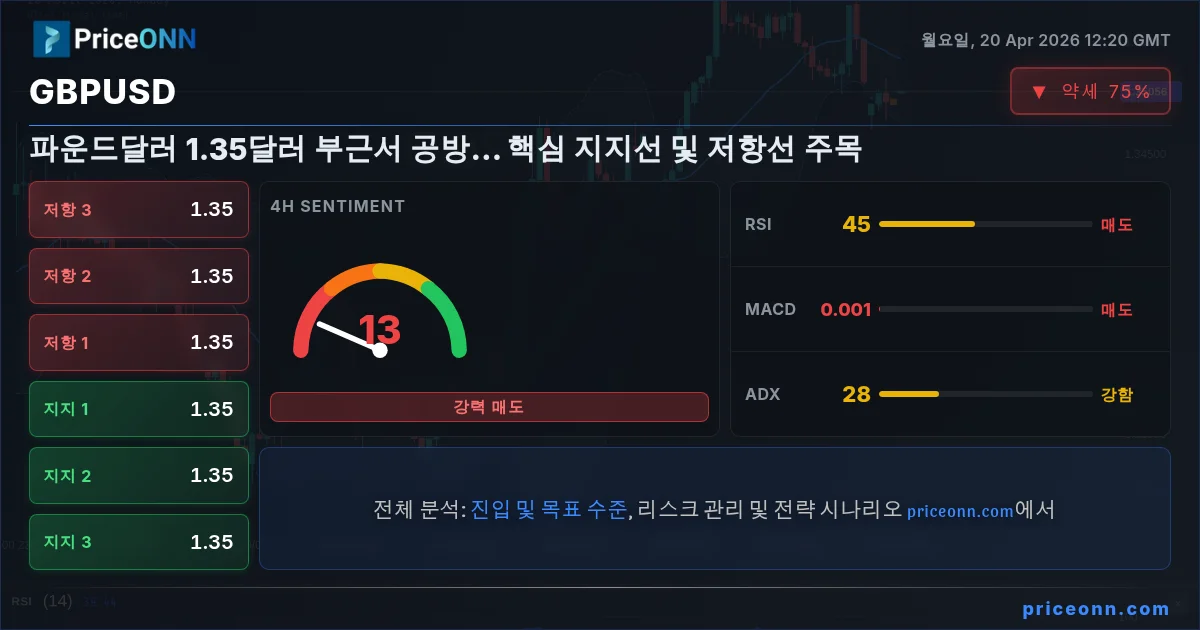
GBPUSD Insight Card

The narrative surrounding GBPUSD has centered on its ability to hold the crucial $1.35 level. While geopolitical tensions have recently eased, potentially softening the US Dollar's grip, the market is now keenly focused on the technical underpinnings that will dictate the pair's next significant move. With the daily chart showing a mixed picture and key indicators flashing conflicting signals, understanding the confluence of price action, support, and resistance becomes paramount for any trader looking to navigate this currency pair.

⚡ Key Takeaways
  • With RSI at 51.82 on the 1H chart, bulls are showing some upward momentum, but the broader trend remains neutral, indicating caution is warranted.
  • Critical support for GBPUSD sits at $1.34791 on the daily chart, a level that has shown resilience but could trigger further downside if broken decisively.
  • The MACD histogram on the 1H chart shows positive momentum, suggesting short-term buying pressure, but this is contrasted by the 4H chart's negative momentum, highlighting a divergence that needs resolution.
  • Broader market sentiment, influenced by DXY movements and upcoming economic data, will be key in determining whether GBPUSD can break higher or succumbs to bearish pressures.

Navigating the $1.35 Confluence Zone

GBPUSD is currently hovering around the $1.35 psychological mark, a level that has served as a critical pivot point in recent trading sessions. The pair's ability to maintain this vicinity, despite varying market conditions, underscores its significance. Looking at the 1-hour chart, the trend is officially neutral with a 50% strength, but the underlying indicators paint a more nuanced picture. The RSI(14) at 51.82 suggests a slight upward bias, indicating that buyers are tentatively stepping in. Simultaneously, the MACD is showing positive momentum, with the MACD line above its signal line. This combination might tempt short-term traders, but the Stochastic Oscillator, with %K at 91.57 and %D at 74.32, is deep in overbought territory on this timeframe, flashing a warning signal for potential pullbacks. The ADX at 16.88 points to a weak trend, suggesting that any move might lack sustained conviction. This mixed bag of signals on the shortest timeframe highlights the indecision that currently characterizes the intraday trading environment for GBPUSD.

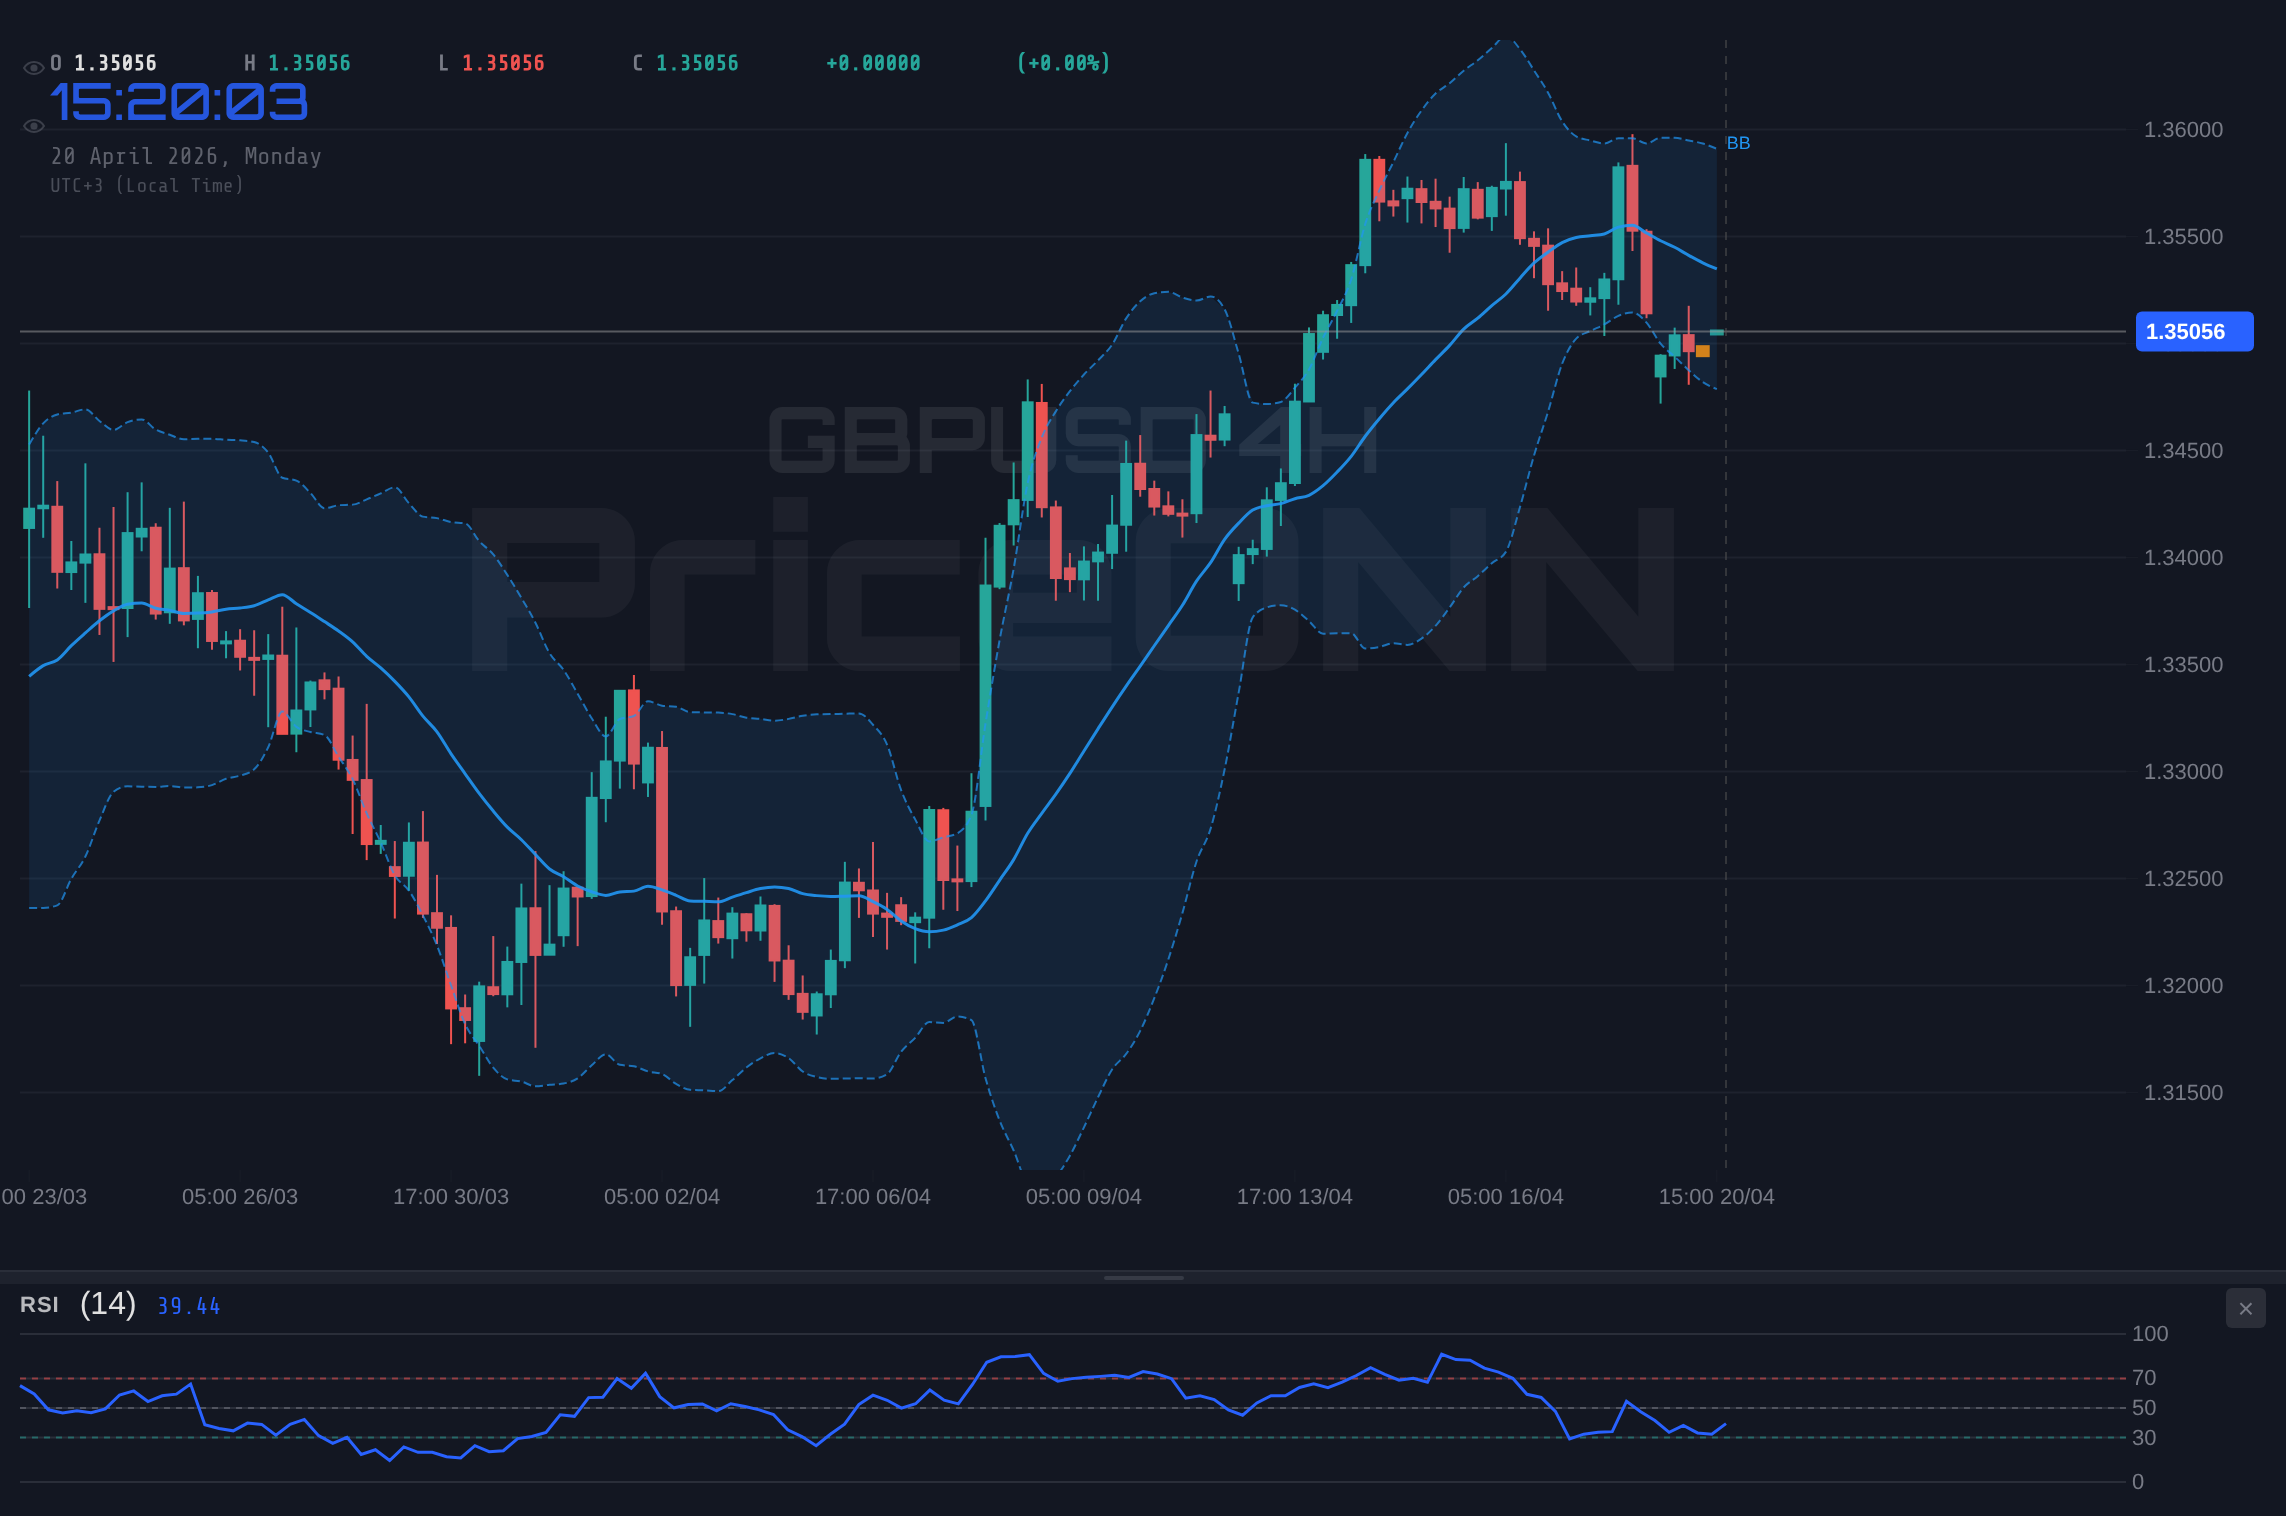
However, when we expand our view to the 4-hour timeframe, the technical landscape shifts. Here, the trend is still classified as neutral with 50% strength, but the ADX at 27.5 indicates a more defined trend is attempting to establish itself, albeit with moderate force. The RSI(14) dips to 45.22, moving away from the overbought zone and signaling a potential bearish lean, which aligns with a downward momentum indicated by the MACD being below its signal line. The Stochastic Oscillator also presents a bearish signal, with %K at 20.86 and %D at 35.81, firmly in oversold territory and suggesting a potential rebound is due, but the directionality remains uncertain. The Bollinger Bands on this timeframe are currently above the middle band, implying a generally upward bias, yet the overall 'General Signal' leans towards 'SELL' (2 Buy, 6 Sell, 0 Neutral). This contrast between the 1-hour's tentative bullishness and the 4-hour's cautious bearish lean creates a complex trading environment, demanding traders to be highly selective.

GBPUSD 4H Chart - GBPUSD Holds Near $1.35: Key Levels for Traders to Watch
GBPUSD 4H Chart

The daily chart offers the longest-term perspective, and it also presents a neutral trend with 50% strength. The RSI(14) is at 57.25, sitting comfortably in the neutral zone and showing an upward tendency, which is generally a positive sign for the bulls. The MACD is positive, indicating bullish momentum is present on this longer timeframe. The Stochastic Oscillator, however, shows %K at 77.18 and %D at 89.39, firmly in overbought territory and signaling a potential reversal downwards. This is a classic case of conflicting signals across different timeframes. The ADX at 23.88 suggests a moderately strong uptrend is in play, which seems to contradict the overbought Stochastic. The 'General Signal' for the daily chart leans heavily 'BUY' (7 Buy, 1 Sell, 0 Neutral), suggesting that from a longer-term perspective, buyers have the edge. This discrepancy across timeframes is precisely why traders must exercise caution and look for confluence before committing to a trade. The $1.35 level is thus a battleground, with short-term signals offering minor support and longer-term signals hinting at underlying strength, but daily indicators like Stochastic are screaming for a pullback.

Macroeconomic Crosswinds and Correlative Strength

The performance of GBPUSD cannot be viewed in isolation; it is intrinsically linked to the broader macroeconomic landscape, particularly the movements of the US Dollar Index (DXY) and global risk sentiment, often reflected in equity markets like the S&P 500 and Nasdaq. Currently, the DXY is trading at 97.99, showing a slight upward bias on the day. Historically, a strengthening DXY tends to exert downward pressure on pairs like GBPUSD, as it signifies increased demand for the US dollar relative to other major currencies. On the 1-hour chart, the DXY exhibits a neutral trend with a 50% strength, but the 4-hour and daily charts show a clearer picture: the 4-hour trend is neutral (50% strength) while the daily trend is bearish (50% strength). This suggests that while there might be short-term fluctuations, the longer-term outlook for the dollar itself is not overwhelmingly bullish, which could provide some underlying support for GBPUSD.

The S&P 500 is currently trading at 6572.87, showing a notable daily gain of 0.74%. This positive movement in equities generally indicates a healthier risk appetite in the market. When risk appetite grows, investors often move away from safe-haven assets like the US dollar and potentially towards higher-yielding currencies or riskier assets. For GBPUSD, this correlation suggests that a sustained rally in the S&P 500 could translate into upward pressure on the pair, especially if it coincides with dollar weakness. Conversely, a sharp downturn in the S&P 500, currently showing a bearish trend on the daily chart (Power: 100%), could trigger a flight to safety, boosting the DXY and subsequently weighing on GBPUSD. The Nasdaq, trading at 26563.5, is also showing a daily decline, which adds to the mixed signals regarding overall market sentiment. This interplay between equity markets and currency pairs is crucial; a growing divergence between stock market performance and GBPUSD's movement might signal a temporary decoupling or a shift in underlying drivers.

Geopolitical developments also play a significant role. Recent news indicates easing Middle East tensions and falling crude oil prices, which typically reduces demand for the US dollar as a safe haven. However, the market seems to be reacting to renewed US-Iran tensions, with Brent crude oil surging past $95 and WTI crude oil also showing significant gains. This escalation could reignite safe-haven demand for the dollar, potentially pushing the DXY higher and creating headwinds for GBPUSD. If the Strait of Hormuz closure fears materialize, crude oil prices could indeed eye $100, creating inflationary pressures that central banks might need to address, further complicating the currency landscape. The market's sensitivity to such events means that even small shifts in geopolitical rhetoric can cause significant volatility across asset classes, impacting the GBPUSD pair.

⚡ Key Takeaways

The potential for renewed escalation in the Middle East, as indicated by rising oil prices and ship interceptions, poses a significant risk to global stability. Any further flare-up could trigger safe-haven flows into the US Dollar, potentially pressuring GBPUSD lower despite current technical support levels.

Key Levels and Trading Scenarios for GBPUSD

Understanding the critical support and resistance levels is fundamental for forming a trading strategy around the $1.35 level. On the daily chart, the immediate support is observed at $1.34791. This level has been tested and held previously, making it a significant floor. Below this, further support lies at $1.34442 and then $1.33848. These levels represent potential downside targets should the price break below the current $1.35 handle. On the resistance side, the immediate hurdle stands at $1.35734. Breaking above this level would be a crucial step for the bulls, potentially opening the path towards higher targets. Further resistance is seen at $1.36328 and $1.36677. These levels are key areas where price action might stall or reverse, especially if broader market sentiment shifts.

▲ Support
S11.34791
S21.34442
S31.33848
▼ Resistance
R11.35734
R21.36328
R31.36677

Given the conflicting signals across timeframes and the current geopolitical uncertainty, a multi-scenario approach is essential. The 'General Signal' on the 1-hour chart leans 'SELL', the 4-hour leans 'SELL', while the daily leans 'BUY'. This suggests a potential short-term bearish bias tempered by longer-term bullish undertones. The ADX readings also provide context: 16.88 on 1H (weak trend), 27.5 on 4H (stronger trend), and 23.88 on 1D (moderate trend). The stronger trend on the 4-hour chart, coupled with the bearish signal from the Stochastic Oscillator, might suggest a higher probability for a bearish move in the short to medium term, despite the daily chart's bullish inclination. Traders must carefully weigh these conflicting data points.

The current market condition, with ADX readings suggesting a trend is attempting to form but is not yet decisively established across all timeframes, points towards potential volatility. The Stochastic Oscillator on the daily chart is deep in overbought territory (77.18/89.39), a classic warning sign that a pullback is likely, even if the longer-term trend remains bullish. This suggests that the $1.35 level might face renewed selling pressure if the daily overbought condition begins to exert its influence. The RSI on the 1-hour chart (51.82) and daily chart (57.25) shows room for upward movement, but the 4-hour RSI (45.22) indicates weakness. This divergence is critical; it highlights that while intraday momentum might favor buyers, the intermediate-term picture is less convincing. Therefore, a break below the immediate support at $1.34791 could be the catalyst for a move towards the next support levels, especially if DXY strengthens or risk-off sentiment prevails.

Conversely, a sustained break and hold above the first daily resistance level at $1.35734 could signal a continuation of the longer-term bullish trend indicated by the daily chart's 'BUY' signal and positive MACD. This scenario would likely require a weakening of the US Dollar (a falling DXY below 97.9) and a positive shift in global risk appetite, possibly accompanied by a rally in equity markets like the S&P 500. The overbought conditions on the daily Stochastic would need to resolve through price consolidation or a slight pullback before a strong upward move could be sustained. If GBPUSD manages to clear $1.35734, the next target would be $1.36328, a level that has previously acted as a significant resistance zone.

Bearish Scenario: Testing Support Below $1.35

65% Probability
Trigger: Close below daily support at $1.34791
Invalidation: Sustained break and hold above daily resistance $1.35734
Target 1: $1.34442 (4H support)
Target 2: $1.33848 (Daily support)

Neutral Scenario: Consolidation Around $1.35

25% Probability
Trigger: Price action remains range-bound between $1.34791 and $1.35734
Invalidation: Clear break of either daily support or resistance levels
Target 1: $1.35200 (Mid-range consolidation)
Target 2: $1.35500 (Upper range consolidation)

Bullish Scenario: Breaking Resistance Above $1.35

10% Probability
Trigger: Sustained daily close above resistance $1.35734
Invalidation: Close below daily support $1.34791
Target 1: $1.36328 (Daily resistance)
Target 2: $1.36677 (Further daily resistance)

Frequently Asked Questions: GBPUSD Analysis

What happens if GBPUSD breaks below the daily support at $1.34791?

A decisive break below $1.34791 would invalidate the bullish sentiment and likely trigger a move towards the next support level at $1.34442. This scenario becomes more probable if the DXY strengthens significantly or risk-off sentiment prevails, pushing GBPUSD towards the $1.33848 area.

Should I buy GBPUSD at current levels around $1.35 given the conflicting signals?

Given the mixed signals across timeframes and the overbought Stochastic on the daily chart, entering long positions around $1.35 requires extreme caution. A more prudent approach would be to wait for a confirmed break above $1.35734 resistance or a clear bounce from $1.34791 support, ideally with confirmation from other indicators and a favourable DXY trend.

Is the RSI at 57.25 on the daily chart a bullish signal for GBPUSD?

An RSI of 57.25 on the daily chart is generally considered neutral to slightly bullish, indicating room for upward movement before reaching overbought territory. However, it must be viewed in conjunction with other indicators; the daily Stochastic Oscillator is already in overbought territory, suggesting that the RSI's bullish potential might be limited in the short term.

How will upcoming US economic data affect GBPUSD this week?

Upcoming high-impact US data, such as employment figures and inflation reports, are critical catalysts. Stronger-than-expected US data could boost the DXY, pressuring GBPUSD lower, while weaker data might trigger dollar weakness and support a move higher for GBPUSD, especially if the UK economy shows resilience.

The current technical setup for GBPUSD at the $1.35 level presents a complex trading environment, characterized by conflicting signals across different timeframes. While the daily chart offers a glimmer of long-term bullish potential, the immediate pressures from the 1-hour and 4-hour charts, coupled with an overbought Stochastic on the daily, suggest that caution is the prevailing sentiment. The key takeaway is that the $1.34791 support level is critical; a break below it could initiate a more significant bearish move, targeting $1.34442 and potentially $1.33848. Conversely, a sustained move above $1.35734 resistance, backed by a weakening DXY and positive risk sentiment, could pave the way for further upside towards $1.36328. Traders must remain vigilant, manage risk effectively, and await clearer directional confirmation before committing capital.

💎

Volatility creates opportunity - those prepared will be rewarded.

With disciplined risk management, navigating these choppy waters is achievable. Patience and a clear strategy are key to capitalizing on market movements.

📊 Indicator Dashboard
IndicatorValueSignalInterpretation
RSI (14)57.25NeutralDaily RSI shows room for upward movement.
MACD Histogram+0.00038BullishPositive momentum on daily chart.
StochasticK: 77.18, D: 89.39BearishDaily Stochastic is overbought, signaling potential pullback.
ADX23.88BullishModerate strength uptrend on daily chart.
BollingerMiddle BandWatchPrice is above the middle band on daily chart.