
Brent Ham Petrol 96.55 Dolar Seviyesinde Dirençle Karşılaştı: Hareketin Arkasındaki Nedenler Neler?
Brent Ham Petrol şu anda 96.55 dolardan işlem görüyor ve 99.41 dolar direnç seviyesine yaklaşıyor. Petrol piyasasındaki bu kritik dönüm noktasını şekillendiren temel faktörleri ve teknik sinyalleri keşfedin.
Küresel enerji piyasası sürekli bir değişim içinde ve Brent Ham Petrol'deki son hareketler, jeopolitik gerilimlerin, makroekonomik değişimlerin ve temel arz-talep dinamiklerinin nasıl iç içe geçtiğine dair ilgi çekici bir vaka çalışması sunuyor. Brent'in 96.55 dolardan işlem görmesi ve önemli direnç seviyelerini test etmesiyle, her yatırımcının zihnindeki soru sadece fiyatın nereye gittiği değil, aynı zamanda *neden* olduğudur. Bu, yeniden yükseliş öncesi geçici bir duraklama mı, yoksa temel göstergeler daha önemli bir düzeltme mi sinyali veriyor? Bu analiz, Brent'in seyrini etkileyen karmaşık faktörleri derinlemesine inceleyerek, yolunu şekillendiren temel dinamikleri ortaya çıkarmak için basit fiyat hareketlerinin ötesine geçiyor. Bu analizde brent ham petrol teknik analiz detaylıca ele alınacaktır.
- Brent Ham Petrol şu anda 96.55 dolardan işlem görüyor ve 1 saatlik grafikte ADX 28.83 ile güçlü bir yukarı yönlü ivme gösteriyor, ancak 99.41 dolar civarında önemli bir direnç bölgesiyle karşı karşıya.
- Brent ve WTI'deki son yükseliş, öncelikle petrol fiyatlarındaki keskin artıştan (%4.45 Brent, %4.46 WTI) kaynaklanıyor ve Hürmüz Boğazı ile ilgili son haberlerde belirtildiği gibi jeopolitik endişelerle korelasyonlu.
- Günlük grafikte Brent'in RSI'ı 48.37 ile temkinli bir yaklaşım önerirken, 32.19'daki ADX güçlü bir düşüş trendine işaret ediyor, bu da dikkatli yorumlama gerektiren çelişkili sinyaller yaratıyor.
- Özellikle enflasyon ve imalatla ilgili ABD'den gelecek yaklaşan ekonomik veriler, Fed politikası ve genel piyasa duyarlılığı üzerindeki potansiyel etkiyi yakından izleyen yatırımcılarla birlikte Brent için bir sonraki yönlü hareketin belirlenmesinde kritik öneme sahip olacak.
Brent Ham Petrol'ün 99.41 dolar direnç seviyesine tırmanmasıyla petrol fiyatlarındaki son yükseliş, piyasanın jeopolitik olaylara duyarlılığının keskin bir hatırlatıcısıdır. Hürmüz Boğazı'nın potansiyel olarak yeniden kapanması veya artan kontrolüne işaret eden haberler, bu geçiş noktasının küresel petrol arzı için kritik öneme sahip olması nedeniyle anında volatilite yaratıyor. Piyasanın tepkisi, keskin bir yukarı yönlü fiyat hareketiyle karakterize edildi ve arz kesintisi korkusunu yansıtıyor. Bu, Brent'teki %4.45'lik bir sıçrama ve WTI'deki benzer %4.46'lık bir artışla açıkça görüldü, bu da yatırımcıların artan risk primlerini fiyatladığını gösteriyor. Hürmüz Boğazı durumu bazı geri adımlar görmüş olsa da, altta yatan gerilimler yukarı yönlü fiyat baskısı için güçlü bir katalizör olmaya devam ediyor ve arz güvenliği ile jeopolitik istikrarsızlık arasındaki hassas dengeyi vurguluyor. Bu dinamik, kısa vadede tamamen ekonomik verileri gölgede bırakarak, başlık riskinin fiyat hareketlerini belirleyebileceği bir ortam yaratıyor.
Petrol fiyatlarındaki bu ani yükseliş boşlukta gerçekleşmiyor. Enflasyon ve merkez bankası politikalarıyla ilgili daha geniş makroekonomik ortam, kritik bir rol oynuyor. Jeopolitik haberlere verilen ani tepki bir yükseliş olsa da, sürdürülebilir şekilde yüksek petrol fiyatları enflasyon beklentileri için önemli sonuçlar doğuruyor. Daha yüksek enerji maliyetleri doğrudan tüketici fiyatlarını ve işletme giderlerini etkileyerek, Federal Rezerv gibi merkez bankalarını para politikası duruşlarını sürdürmeye veya hatta sıkılaştırmaya zorlayabilir. Bu karmaşık bir geri besleme döngüsü yaratıyor: jeopolitik olaylar petrol fiyatlarını yükseltiyor, bu da enflasyon endişelerini körüklüyor, potansiyel olarak ekonomik büyümeyi ve dolayısıyla petrol talebini yavaşlatabilecek daha sıkı para politikasına yol açıyor. Mevcut veriler, ABD Dolar Endeksi'nin (DXY) 98 seviyesinde olduğunu gösteriyor; bu seviye genellikle dolara endeksli emtialar üzerinde bir miktar baskı uygular. Ancak, petrol artışı bu korelasyonu geçici olarak bastırıyor gibi görünüyor ve mevcut ortamda arz şoklarının baskın etkisini vurguluyor. Bu faktörlerin etkileşimi, petrol piyasalarını analiz etmeyi bu kadar zorlu ve dinamik kılıyor.
Teknik Manzarada Yol Bulmak: Çelişkili Sinyaller
1 Saatlik Brent Grafiği: Bir Boğa Aralığı mı?
1 saatlik zaman diliminde Brent Ham Petrol, anlık boğa ivmesi bir resim sunuyor. Fiyat şu anda 96.37 dolar civarındaki direnci test ediyor, bu seviye yakın geçmişte bazı fiyat hareketlerine sahne oldu. 28.83'teki ADX göstergesi, güçlü bir trendin oyunda olduğunu gösteriyor ki bu, bu kısa zaman diliminde yukarı yönlü görünüyor. Bu durum, pozitif momentum gösteren ve sinyal çizgisinin üzerinde oturan MACD tarafından daha da destekleniyor, bu da alım baskısının şu anda baskın olduğunu gösteriyor. K=%80.44 ve D=%64.28 ile Stokastik osilatör aşırı alım bölgesinde ancak yükseliş eğilimini güçlendiren bir boğa kesişimi (%K > %D) gösteriyor. 54.68'deki RSI(14), nötr bölgede seyrediyor ve bu zaman diliminde aşırı alım haline gelmeden önce hala yukarı yönlü hareket için yer olduğunu gösteriyor. Ancak, daha kısa zaman dilimlerinin gürültüye ve ani başlık odaklı hareketlere daha duyarlı olduğunu unutmamak önemlidir. Bu zaman dilimi için genel sinyal, 6 alım, 2 satım ve 0 nötr sinyalle ALIM yönünde eğilim gösteriyor, ancak kritik direnç seviyelerine yakınlık dikkatli olmayı gerektiriyor.
4 Saatlik Brent Grafiği: Bir Ayı Alt Akıntısı
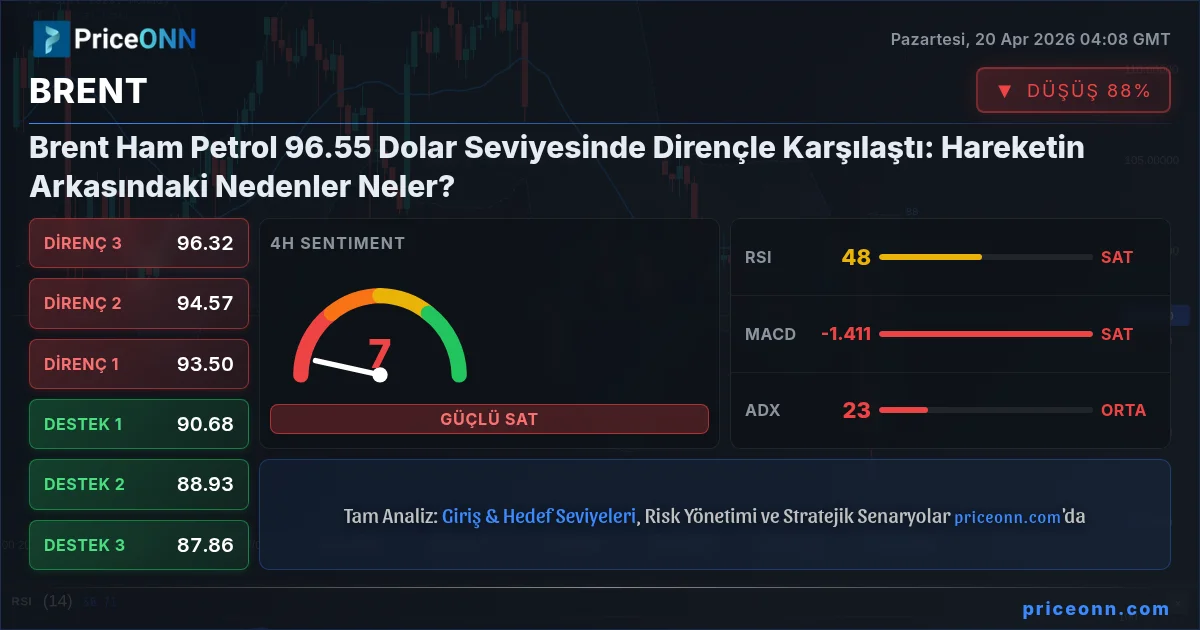
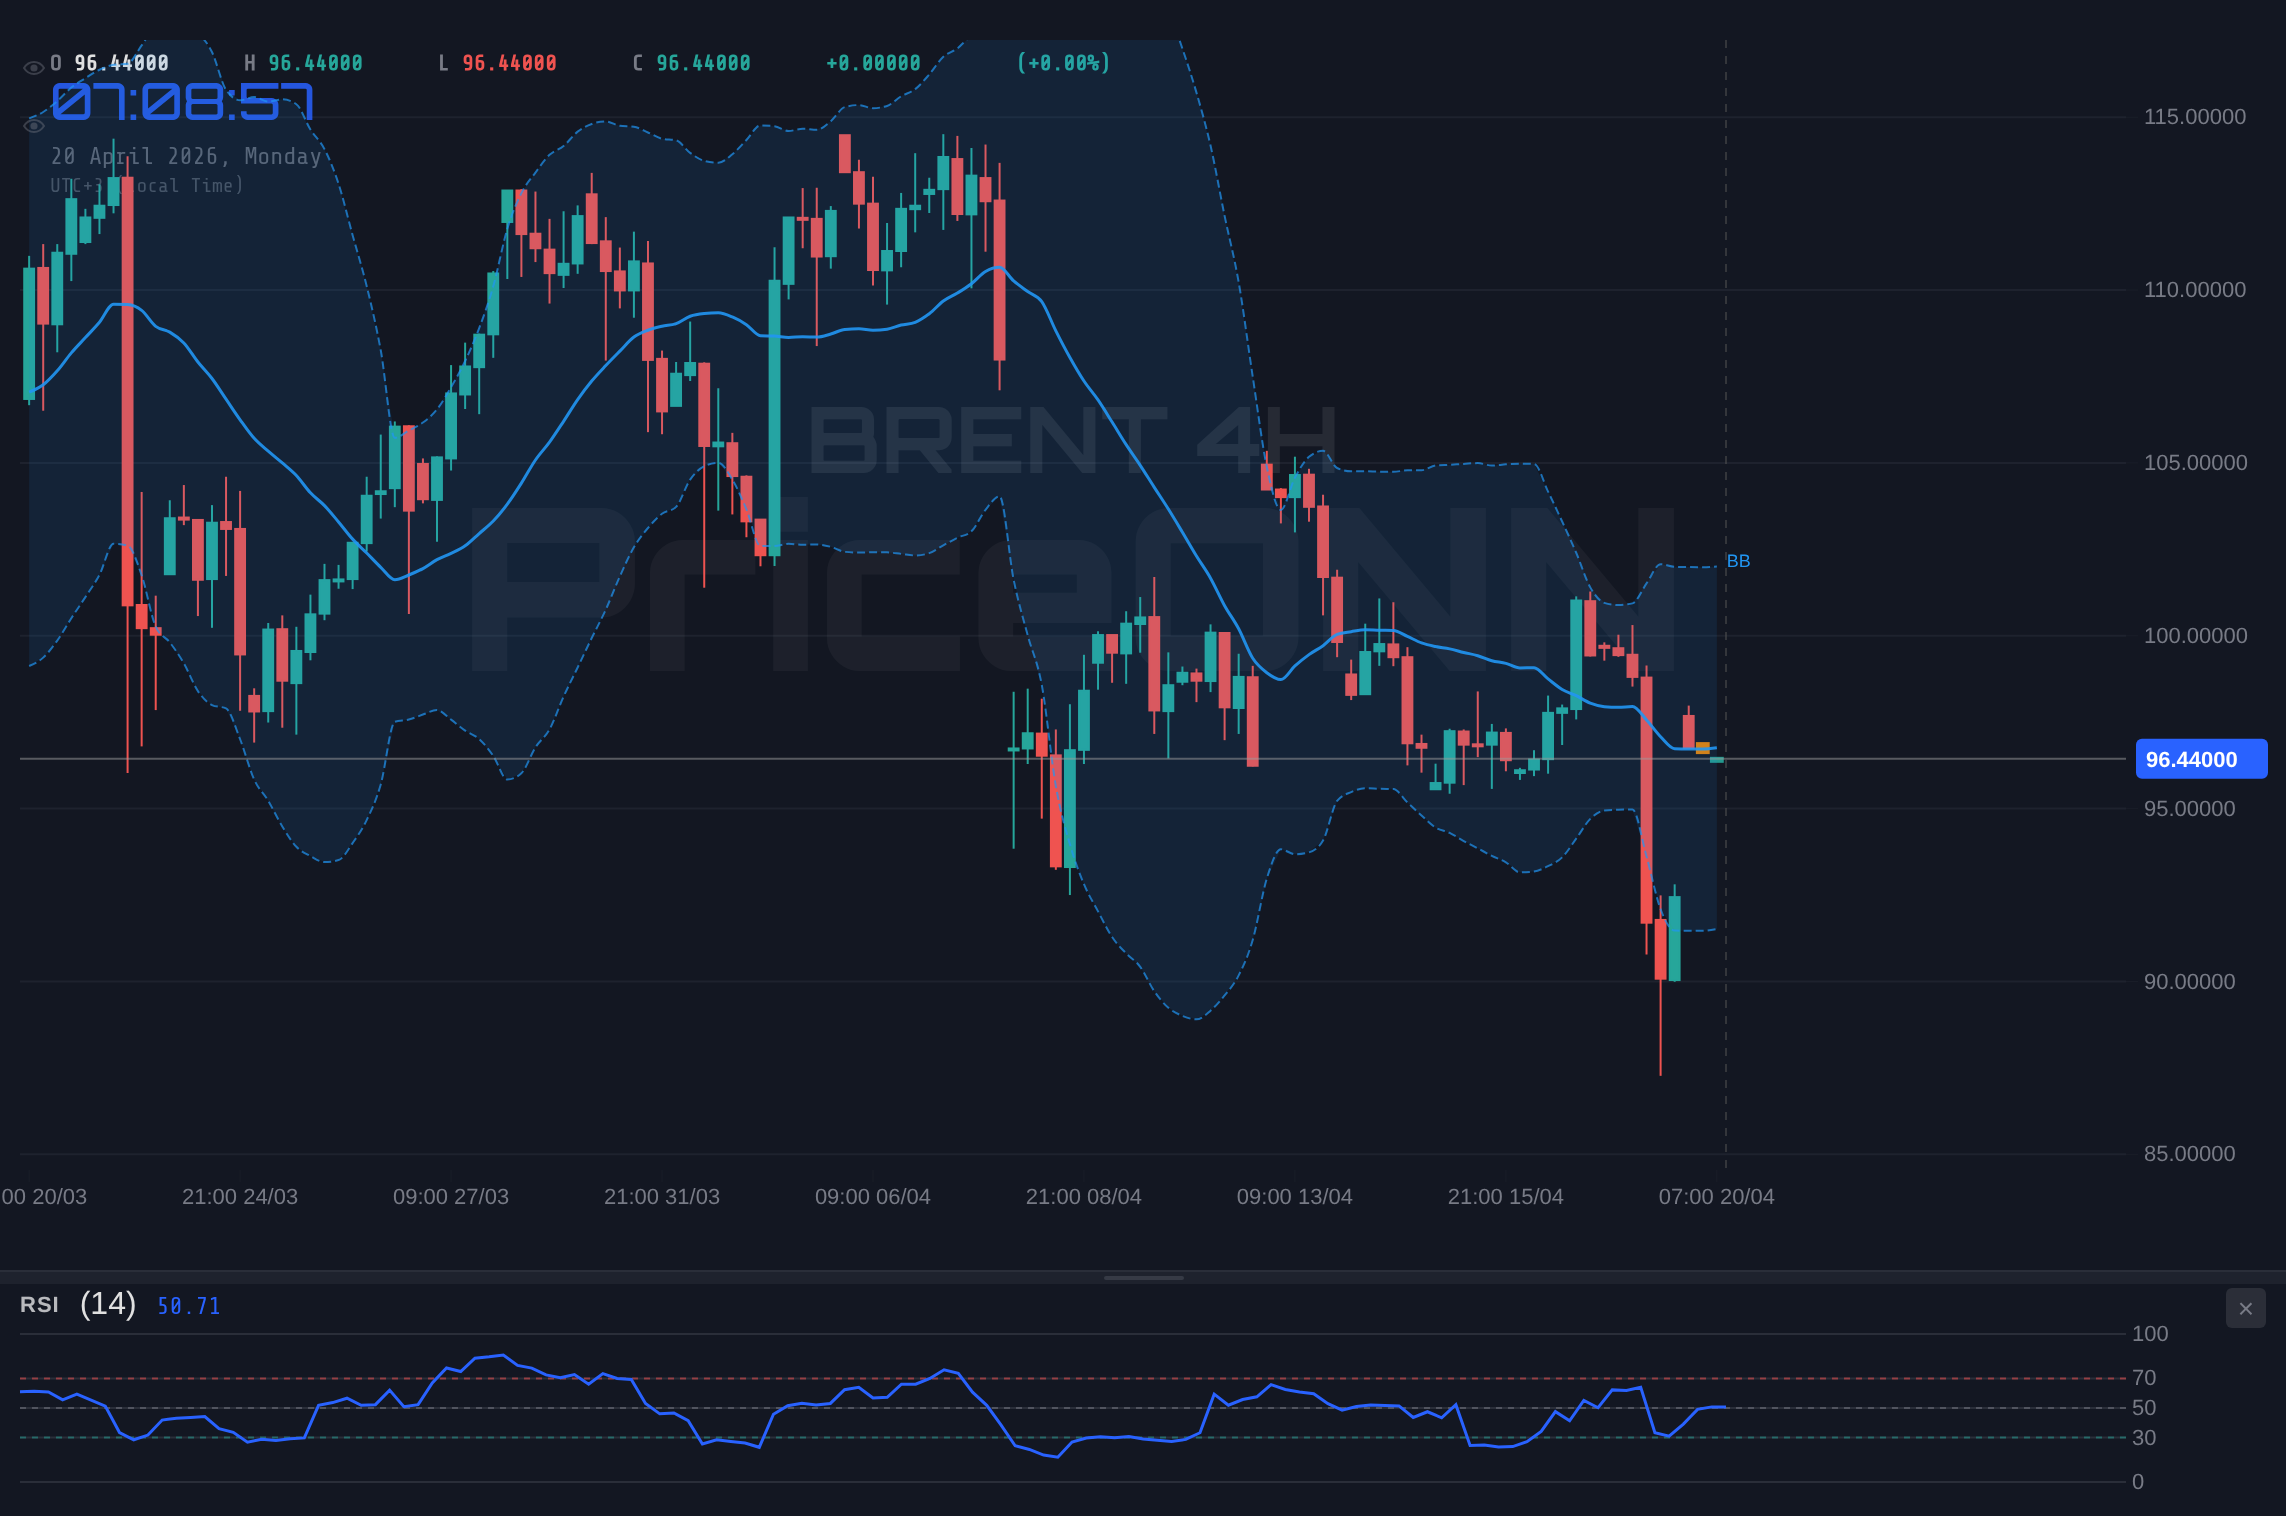
4 saatlik grafiğe geçildiğinde, tablo daha karmaşık ve boğalar için daha endişe verici hale geliyor. Fiyat şu anda 96.55 doların üzerinde işlem görse de, genel trend %50 güçle nötr olarak belirtiliyor. 23'teki ADX, orta derecede trend bir piyasaya işaret ediyor, ancak MACD negatif momentum gösteriyor, MACD çizgisi sinyal çizgisinin altında seyrediyor ve potansiyel satış baskısının biriktiğini ima ediyor. Bollinger Bantları, fiyatın orta bandın altında yer aldığı şekilde konumlandırılmış, bu da genellikle ayı eğilimini veya düşüş eğiliminin devam etme potansiyelini sinyal ediyor. Stokastik osilatör K=%41.07 ve D=%44.43 gösteriyor, bu da bir ayı sinyali (%K
Günlük Brent Grafiği: Geçişte Bir Trend mi?
Günlük grafik en geniş perspektifi sağlıyor ve burada trend resmi olarak %50 güçle nötr olarak sınıflandırılıyor. Ancak, 32.19'daki ADX okuması oldukça önemli ve güçlü bir trendin varlığına işaret ediyor, ancak yön diğer göstergelerle çelişiyor. MACD şu anda negatif momentum sergiliyor, MACD çizgisi sinyal çizgisinin altında seyrediyor, bu da daha uzun vadeli bazda hakim duyarlılığın ayıda olabileceğini ima ediyor. Fiyat, genellikle ayı baskısına işaret eden orta Bollinger Bandının altında işlem görüyor. RSI(14) 48.37'de, yine nötr bölgede ancak aşırı satım koşullarına doğru eğilim gösteriyor, bu da bir sıçramayı önceden haber verebilir. Ancak, Stokastik osilatör K=%33.93 ve D=%25.35 (%K > %D) ile bir boğa sinyali sağlıyor, bu da potansiyel bir yukarı yönlü dönüşün demlenmekte olduğunu gösteriyor. Günlük grafikteki genel sinyal, 3 alım, 5 satım ve 0 nötr sinyalle SATIM yönünde. Zaman dilimleri arasındaki bu sapma - kısa vadeli yükseliş, orta vadeli düşüş ve çelişkili uzun vadeli sinyaller - oldukça belirsiz bir ortam yaratıyor. Günlük grafikteki güçlü ADX (32.19), hangi yön hakim olursa olsun, güçlü bir hareket olabileceğini gösteriyor.
Temel Dayanaklar: Enflasyon, Jeopolitik ve Talep
Enflasyon İkilemi ve Merkez Bankası Politikası
Enflasyonla ilgili devam eden endişe, küresel piyasalarda merkezi bir tema olmaya devam ediyor ve petrol fiyatları bu anlatının önemli bir katkıcısıdır. Brent Ham Petrol 96.55 dolar civarında seyrederken, herhangi bir sürdürülebilir yukarı yönlü baskı enflasyonist eğilimleri şiddetlendirebilir. Bu, merkez bankalarını, özellikle Federal Rezervi zor bir konuma getiriyor. Sağlanan piyasa verileri, DXY'nin 98 seviyesinde olduğunu gösteriyor; bu seviye genellikle daha güçlü bir doları simgeler ve bu da tipik olarak petrol gibi dolara endeksli emtiaları zayıflatır. Ancak, mevcut petrol fiyatlarındaki artış, geniş dolar zayıflığından ziyade arz tarafı endişelerinden kaynaklanıyor gibi görünüyor. Bu kritik; eğer petrol fiyatları güçlü talep yerine jeopolitik riskler nedeniyle yükselmeye devam ederse, bu stagflasyonist bir senaryo sunar - yavaşlayan ekonomik büyüme ile birlikte artan fiyatlar. Yaklaşan ekonomik takvim, perakende satışlar ve imalat rakamları da dahil olmak üzere yüksek etkili ABD verileriyle dolu. Bu rakamlar, tüketici dayanıklılığını ve ABD ekonomisinin sağlığını değerlendirmek için kritik öneme sahip olacak. Beklenenden daha zayıf bir ekonomik görünüm, sonuçta petrol talebini sınırlayabilir ve arz endişelerine rağmen fiyatlar üzerinde bir tavan görevi görebilir. Tersine, güçlü veriler Fed'i şahin bir duruşu sürdürmeye teşvik edebilir, doları potansiyel olarak güçlendirebilir ve petrol için ters rüzgarlar yaratabilir.
Jeopolitik Fay Hatları: Hürmüz Boğazı ve Ötesi
Hürmüz Boğazı ile ilgili son haberler, jeopolitik sıcak noktaların emtia piyasalarını ne kadar hızlı etkileyebileceğinin güçlü bir hatırlatıcısıdır. Raporlar geçici bir yeniden açılmayı veya yeniden açılmayı gösterse de, bölgedeki altta yatan gerilimler önemli bir risk faktörü olmaya devam ediyor. Piyasanın ani tepkisi - keskin bir fiyat artışı - küresel petrol tedarik yollarına yönelik herhangi bir algılanan tehdide karşı bir duyarlılığı gösteriyor. Bu münferit bir olay değil; daha geniş Orta Doğu, petrol üretimi ve geçişi için kritik bir merkez olmaya devam ediyor. Herhangi bir çatışma tırmanışı veya hatta artan söylem, petrol fiyatlarına bir 'risk primi' eklenmesine neden olabilir. Bu primin ölçülmesi zordur ancak genellikle artan volatilite ve yatırımcıların potansiyel arz kesintilerine karşı korunmasıyla daha yüksek fiyatlara doğru bir eğilimle yansıtılır. Petrol fiyatları ile jeopolitik istikrar arasındaki korelasyon iyi kurulmuştur. Gerilimler arttığında, petrol fiyatları tırmanma eğilimindedir ve tersine, talep istikrarlı kaldığı varsayıldığında, göreceli sakinlik dönemleri genellikle fiyatların düşmesine neden olur. Boğaz'dan dalgalanan haberlerle karakterize edilen mevcut durum, yatırımcıların yalnızca temel talep tarafı analizine güvenmelerini zorlaştıran yüksek bir belirsizlik ortamı yaratıyor.
Talep Tarafı Sinyalleri: Karışık Bir Ekonomik Resim
Arz tarafı endişeleri şu anda anlatıya hakim olsa da, petrol talebi tarafı göz ardı edilemez. Küresel ekonomik görünüm, petrol tüketiminin ana belirleyicisi olmaya devam ediyor. Yaklaşan yüksek etkili ekonomik olaylar, ABD Perakende Satışları ve İmalat PMI verileri gibi, kritik bilgiler sağlayacaktır. Beklenenden daha güçlü rakamlar, güçlü ekonomik aktiviteyi ve dolayısıyla petrol talebi beklentilerini artırabilir ve daha yüksek fiyatları destekleyebilir. Tersine, hayal kırıklığı yaratan veriler bir yavaşlama endişelerini artıracak ve Brent'in herhangi bir yukarı yönlü fiyat momentumunu sınırlayabilecek petrol talebinde bir düşüşe neden olabilecektir. S&P 500 ve Nasdaq gibi büyük endekslerle olan korelasyon da ipuçları sunmaktadır. S&P 500, 1 saatlik ve 4 saatlik grafiklerde güçlü bir yukarı trend gösterirken günlükte karışık bir trend sergiliyor, Nasdaq da karışık. Bu risk varlıklarında önemli düşüşler genellikle risk iştahında bir düşüşü işaret eder, bu da emtialara yayılabilir ve petrol talebinde azalmaya yol açabilir. Bu nedenle, Brent'in gelecekteki fiyat yönünü kapsamlı bir şekilde anlamak için bu daha geniş ekonomik göstergeleri ve risk duyarlılığını izlemek hayati önem taşımaktadır. Mevcut veriler, SP500'ün 6572.87 ve Nasdaq'ın 26517 olduğunu gösteriyor, her ikisi de zaman dilimleri boyunca karışık sinyaller sergiliyor, bu da genel piyasa belirsizliğine katkıda bulunuyor.
Verileri Entegre Etmek: Olasılıksal Bir Yaklaşım
Farklı zaman dilimleri ve göstergeler arasındaki çelişkili sinyaller, Brent Ham Petrol ticareti için olasılıksal bir yaklaşımı zorunlu kılıyor. Jeopolitik başlıklar ve pozitif MACD okumaları tarafından yönlendirilen kısa vadeli yükseliş momentumu, 4 saatlik grafikteki ayı alt akıntıları tarafından engelleniyor; bu da fiyatın orta Bollinger Bandının altında işlem görmesi ve negatif MACD momentumu ile kanıtlanıyor. Günlük grafik, güçlü ADX'i ile sağlam bir trendi önererek başka bir karmaşıklık katmanı ekliyor, ancak RSI ve Stokastik'ten çelişkili sinyallerle. Bu sapma, kısa vadeli bir sıçrama mümkün olsa da, uzun vadeli görünümün belirsiz kaldığı anlamına geliyor. Yatırımcılar, 96.55 dolarlık fiyat noktasının şu anda kritik bir bölgede gezindiğini kabul etmelidir. Güçlü hacim ve pozitif ekonomik verilerle teyit edilen 99.41 dolarlık direncin üzerinde kararlı bir kırılma, yükseliş trendinin devamını işaret edebilir. Ancak, bu dirence karşı koyamama ve olumsuz ekonomik haberler veya jeopolitik gerilimlerin azalmasıyla birlikte, 4 saatlik grafiğin ayı eğilimi tarafından önerildiği gibi 90.68 dolarlık destek seviyesine bir geri çekilme yaşanabilir.
Korelasyonların Rolü: DXY ve Hisse Senetleri
Brent'in diğer büyük piyasalarla nasıl etkileşimde bulunduğunu anlamak esastır. Şu anda 98'de olan DXY, tipik olarak petrol fiyatlarıyla ters bir korelasyona sahiptir. Daha güçlü bir dolar, dolara endeksli emtiaları diğer para birimlerine sahip olanlar için daha pahalı hale getirir ve potansiyel olarak talebi azaltır. Ancak mevcut ortamda, jeopolitik risk primi bu korelasyonu, en azından kısa vadede, geçersiz kılıyor gibi görünüyor. Eğer DXY, belki de agresif Fed politikası sinyalleri nedeniyle önemli ölçüde güçlenirse, arz endişeleri devam etse bile Brent üzerinde önemli bir aşağı yönlü baskı uygulayabilir. Benzer şekilde, S&P 500 ve Nasdaq gibi hisse senedi piyasalarının performansı, risk iştahına ilişkin bilgiler sağlar. Hisse senetleri keskin bir şekilde düşerken, bu genellikle 'riskten kaçış' duyarlılığını gösterir, bu da yatırımcıların petrol talebinde azalmaya yol açarak emtia pozisyonlarını azaltmasına neden olabilir. Farklı zaman dilimlerindeki SP500 (6572.87) ve Nasdaq (26517) verilerindeki karışık sinyaller, bu altta yatan belirsizliği yansıtmaktadır. Hisse senetlerinde sürdürülebilir bir satış, jeopolitik başlıklardan bağımsız olarak Brent üzerinde artan satış baskısı anlamına gelecektir.
Yaklaşan Ekonomik Takvim: Bir Sonraki Katalizör mü?
Ekonomik takvim, özellikle çelişkili teknik sinyallerle uğraşırken petrol piyasasında yol bulmak için kritik bir araçtır. Bu hafta, Perakende Satışlar ve İmalat PMI dahil olmak üzere önemli ABD verileri ufukta. Beklenenden daha güçlü rakamlar, güçlü ekonomik büyüme ve dolayısıyla sağlıklı petrol talebi beklentilerini destekleyecektir. Bu, Brent'in 99.41 dolar direncini kırması için gerekli temel desteği sağlayabilir. Tersine, daha zayıf veriler ekonomik bir yavaşlama endişelerini artıracak ve talep tahminleri aşağı yönlü revize edildiği için petrol fiyatlarında bir satışa neden olabilecektir. Bu veri noktalarına piyasanın tepkisi, mevcut enflasyon beklentileri ve merkez bankası politikası görünümleri tarafından da etkilenecektir. Enflasyon inatla yüksek kalırsa, zayıf büyüme verileri bile Fed'i sıkılaştırma yolundan caydıramayabilir, bu da emtialar için karmaşık bir senaryo yaratır. Yatırımcılar, bu rakamların fiili ve tahmin edilen sayılarına ve Fed yetkililerinden gelen herhangi bir eşlik eden yoruma yakından dikkat etmelidir.
Senaryo Analizi: Potansiyel Sonuçları Haritalamak
Ayı Senaryosu: Daha Düşük Zeminlere Geri Çekilme
%60 OlasılıkKonsolidasyon Aşaması: Netlik Bekleniyor
%25 OlasılıkBoğa Kırılması: Jeopolitik Ateşi Körüklemek
%15 OlasılıkSıkça Sorulan Sorular Bölümü
Sıkça Sorulan Sorular: Brent Ham Petrol Analizi
Brent Ham Petrol 99.41 dolar direnç seviyesinin üzerine çıkarsa ne olur?
99.41 doların üzerinde kesin bir kırılma, özellikle günlük kapanış bazında ve güçlü ekonomik veriler veya artan jeopolitik gerilimlerle desteklenirse, yükseliş trendinin devamını işaret edebilir. Bu senaryo, uzun vadeli günlük grafik seviyelerinin gösterdiği gibi, bir sonraki ana direnç olan 106.38 dolara yönelebilir.
Çelişkili sinyaller göz önüne alındığında, mevcut 96.55 dolar civarındaki seviyelerden Brent satmayı düşünmeli miyim?
4 saatlik grafikteki ayı alt akıntıları ve trendi gösteren günlük grafikteki güçlü ADX göz önüne alındığında, mevcut seviyelerden satış yapmak risk taşır. Erken bir geri dönüşü tahmin etmek yerine, 90.68 dolarlık destek seviyesinin altında teyit edilmiş bir kırılma veya daha net ayı sinyallerinin ortaya çıkmasını beklemek daha ihtiyatlı bir yaklaşım olabilir.
Günlük grafikteki 48.37 RSI'ı Brent'in bir sonraki hamlesi için güvenilir bir gösterge mi?
48.37'deki RSI nötr bölgede olup, günlük zaman diliminde güçlü bir aşırı alım veya aşırı satım koşullarını göstermiyor. Hafifçe aşırı satıma eğilimli olsa da, kesinlikten yoksun. Bu nötr okuma, 32.19'luk güçlü ADX ile birleştiğinde, piyasanın önemli bir hareket için hazır olduğunu gösteriyor, ancak RSI tek başına daha fazla onay olmadan net bir yön sinyali sağlamıyor.
Bu hafta açıklanacak ABD Perakende Satış verileri Brent Ham Petrol fiyatlarını nasıl etkileyecek?
Beklenenden güçlü ABD Perakende Satış rakamları, petrol talebi beklentilerini artırarak Brent'in 99.41 dolar direncine doğru hareketini potansiyel olarak destekleyecektir. Tersine, zayıf veriler ekonomik yavaşlama endişelerini artırabilir ve petrol fiyatları üzerinde aşağı yönlü baskı yaratabilir, özellikle jeopolitik riskler azalsa bile.
Piyasaları canlı takip edin
AI destekli analizler, teknik göstergeler ve anlık fiyat verileri.
Telegram Kanalımıza Katılın
Son dakika piyasa haberleri, AI analizleri ve trading sinyalleri.
Kanala Katıl