
나스닥 100, 26,494달러 부근서 숨 고르기… 26,407달러 지지선 주목
나스닥 100 지수가 26,494.12달러에서 거래되고 있습니다. 강세론자들은 26,568달러 저항선을 주시하고 있으며, 약세론자들은 26,407달러의 중요 지지선을 예의주시하고 있습니다.
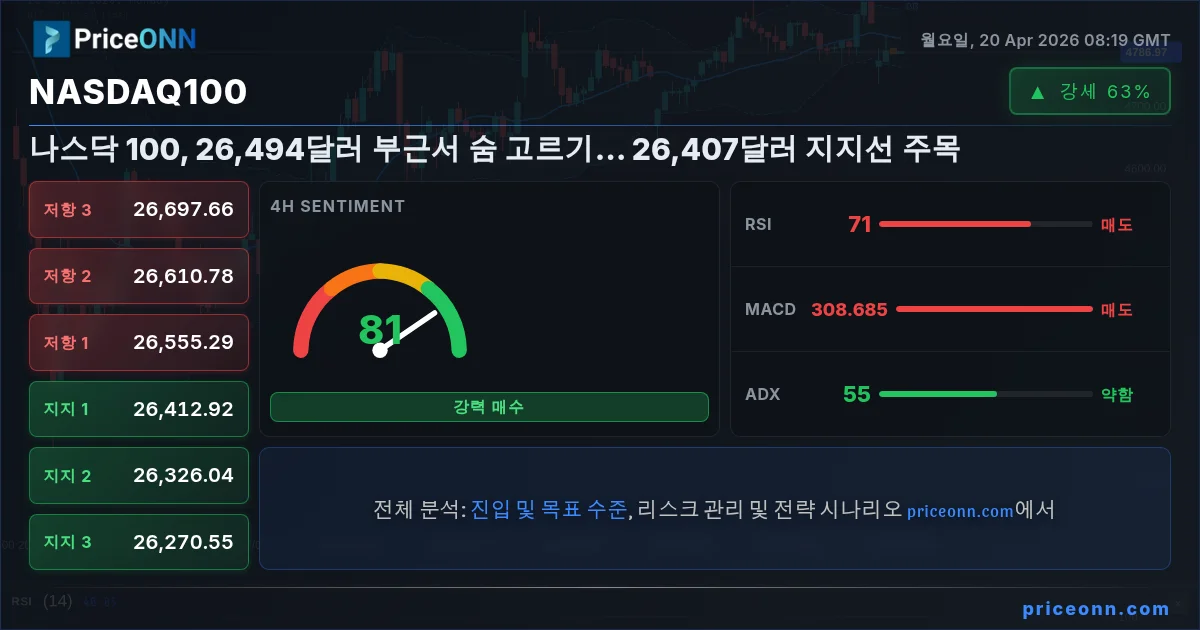
나스닥 100 지수가 결정적인 움직임을 보일 준비를 하고 있습니까, 아니면 통합 국면에 진입하고 있습니까? 기술주 중심의 이 지수는 현재 26,494.12달러에서 거래되고 있으며, 이는 강세론자와 약세론자 간의 싸움이 중요한 시점에 도달했음을 시사합니다. 지수가 다양한 시간대에서 혼조세를 보이고 있는 가운데, 복잡한 시장 환경을 헤쳐나가기 위해서는 근본적인 동인과 잠재적 촉매제를 이해하는 것이 무엇보다 중요합니다. 본 분석은 기술 지표와 거시 경제 요인을 검토하며 상승 및 하락 가격 움직임에 대한 주장을 심층적으로 살펴봅니다. 오늘 나스닥 100 분석은 이러한 복잡성을 파악하는 데 중점을 둡니다.
- 1시간 차트상 RSI가 50.27로 중립적인 모멘텀을 나타내는 반면, 4시간 차트상 RSI는 62.83으로 강세 편향을 나타내지만 과매수 가능성도 있습니다.
- 나스닥 100의 중요 지지선은 26,407달러에 있으며, 이 수준은 이전에 테스트되고 유지된 바 있습니다. 이 수준 아래로 결정적인 돌파는 추가 하락을 신호할 수 있습니다.
- 1시간 차트의 MACD 히스토그램은 부정적인 모멘텀을 보여 매도 압력이 증가하고 있음을 시사하며, 이는 4시간 차트의 긍정적인 모멘텀과 대조됩니다.
- 현재 98.01인 DXY와의 상관관계는 주요 요인으로 남아 있으며, 달러 강세는 일반적으로 기술 지수에 하락 압력을 가합니다.
강세 시나리오: 신고점 향한 움직임
강세론자들의 입장에서 볼 때, 나스닥 100의 일봉 차트는 지속적인 강세에 대한 설득력 있는 주장을 제시합니다. 지수는 중간 볼린저 밴드 위에 거래되고 있으며, 이는 상승 모멘텀의 고전적인 신호입니다. 또한 이 시간대의 MACD 지표는 MACD 선이 시그널 선 위에 있어 긍정적인 모멘텀을 보여줍니다. 이는 근본적인 매수 심리가 여전히 견고함을 시사합니다. 더불어, 일봉 차트의 ADX는 29.83으로 강한 상승 추세가 형성되어 있음을 나타내며, 이는 추가 상승 가능성에 대한 견고한 기반을 제공합니다. 트레이더들은 26,568달러 저항선을 면밀히 주시하고 있으며, 이 수준 위로 지속적인 돌파는 더 높은 목표치를 향한 움직임을 열어줄 수 있으며, 최근 고점을 재테스트할 가능성도 있습니다.
4시간 차트 역시 일부 상충되는 신호에도 불구하고 강세론자들에게 일부 지지를 제공합니다. 4시간 차트의 RSI는 62.83으로 과매수 영역에 접근하고 있지만, 아직 극단적인 영역은 아니므로 추가 상승 여지가 남아 있습니다. ADX는 24.23으로 완만한 상승 추세를 나타내며, 4시간 차트의 Stochastic 지표(%K 97.85, %D 86.96)는 과매수 영역에 있어 단기적인 되돌림 가능성을 시사하지만, 이를 과매수 영역으로 이끈 강력한 매수 압력을 확인시켜 주기도 합니다. 4시간 차트의 전반적인 신호는 '매수'로, 일봉 관점에서의 강세 심리를 강화합니다. 나스닥 100이 현재 가격대인 26,515달러 영역 위에서 유지되고, 이후 26,568달러 저항선을 돌파하는 능력은 이 강세 시나리오의 핵심 확인 요소가 될 것입니다.
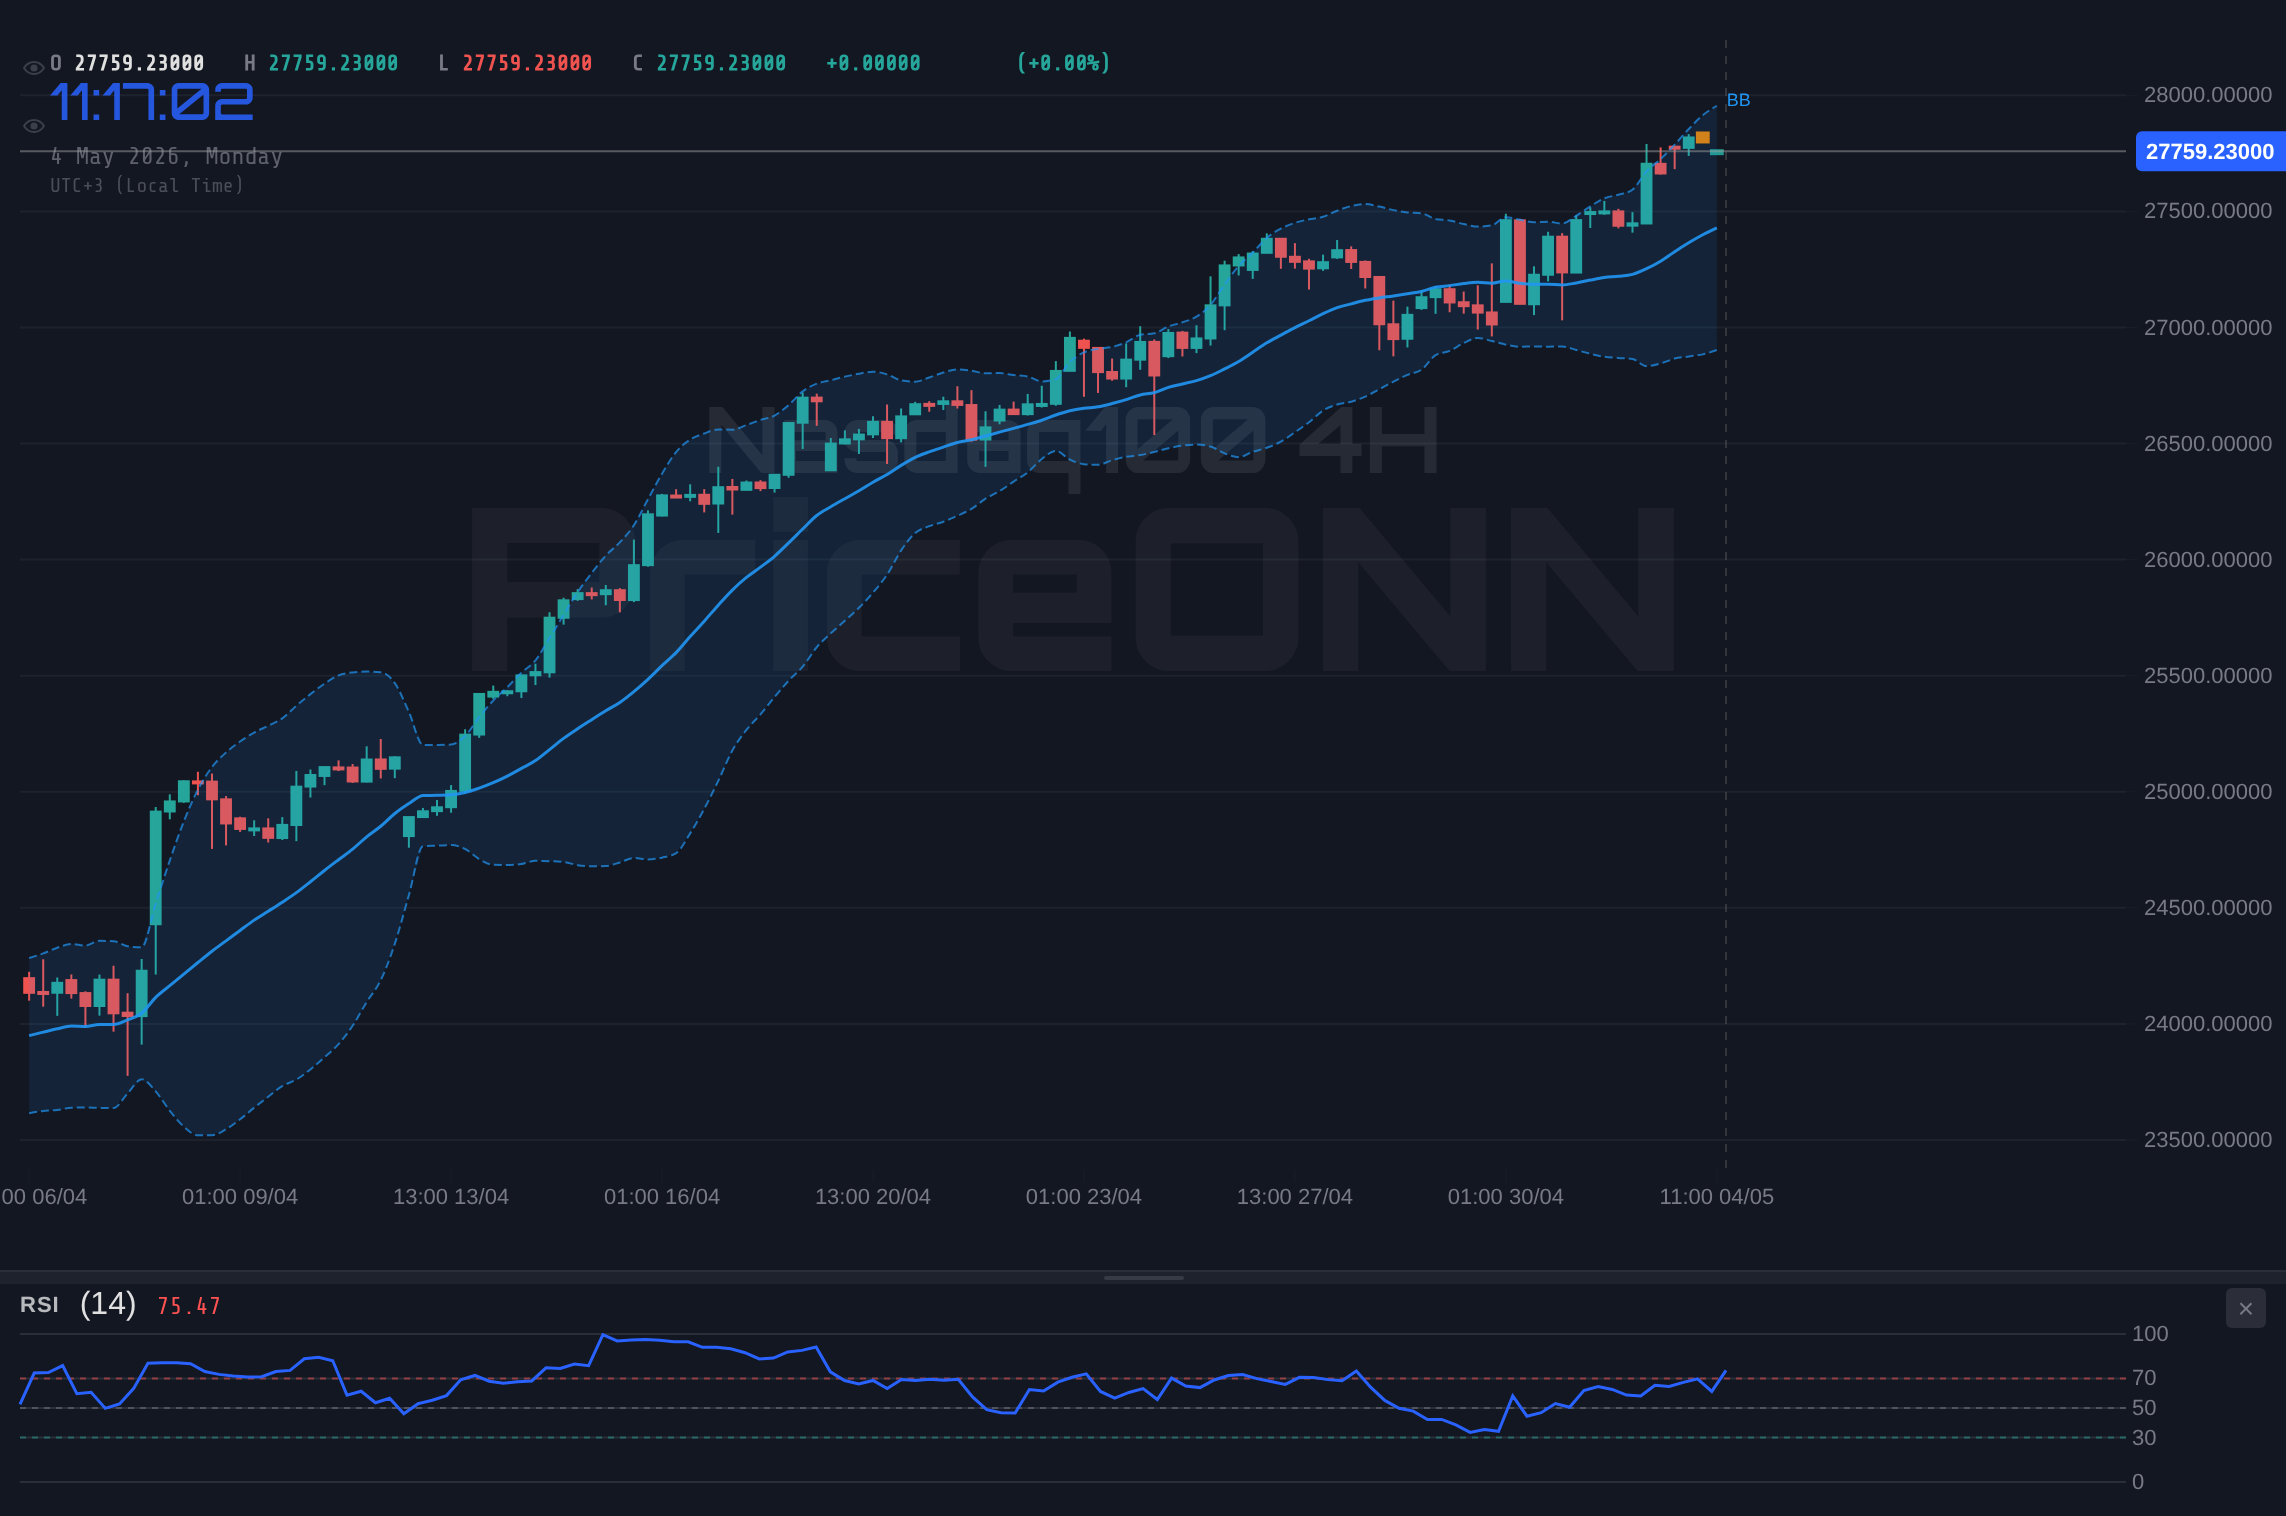
일중 역학을 살펴보면, 1시간 차트는 다음 움직임 이전의 잠시 멈춤으로 해석될 수 있는 보다 미묘한 그림을 제시합니다. 1시간 차트의 RSI는 50.27로 완벽하게 중립적이며, 단기적인 결정력 부족을 나타냅니다. 그러나 MACD 히스토그램은 부정적인 모멘텀을 보여 단기적인 하락의 전조가 될 수 있습니다. 1시간 차트의 Stochastic 오실레이터(%K 51.11, %D 47.24)는 강세 교차를 보여 단기적인 반등 가능성을 시사합니다. 이러한 혼조된 일중 그림은 26,494.12달러의 현재 가격 수준을 피벗 포인트로서의 중요성을 강조합니다. 이 수준 위에서 성공적으로 유지한 후 저항선을 향한 움직임은 더 넓은 강세 추세와 일치할 것입니다.
기본적인 배경 또한 강세 전망에 일부 지지를 제공하지만, 주의사항이 따릅니다. 인플레이션은 여전히 우려 사항이지만, 최근 경제 데이터는 혼조세를 보이며 연준의 다음 행보에 대한 불확실성을 야기하고 있습니다. 그러나 미국 경제의 회복력과 특히 기술 분야의 지속적인 강세는 주식 시장을 뒷받침할 수 있습니다. AI와 기술 혁신에 대한 이야기는 나스닥 100 구성 종목에 대한 투자를 계속 주도하며 구조적인 순풍을 제공하고 있습니다. 향후 PMI 수치와 같은 경제 데이터 발표가 예상보다 강하게 나온다면, 이는 심리를 더욱 강화하고 상승 움직임을 지지할 수 있습니다.
약세 시나리오: 역풍과 저항에 직면
반대로, 약세론자들의 주장은 여러 핵심 기술적 및 근본적인 요인에 달려 있습니다. 특히 1시간 차트는 약점의 징후를 보여줍니다. 부정적인 MACD 모멘텀과 50.27 근처의 RSI는 매수자로부터의 강력한 확신 부족을 시사하며, 잠재적인 하락 가능성을 나타냅니다. 1시간 차트의 ADX는 23.6으로 완만한 하락 추세를 나타내며, 이는 일중 거래에 영향을 미칠 수 있습니다. 강세론자들에게 더 우려스러운 점은 1시간 시간대의 전반적인 '매도' 신호로, 일부 상충되는 Stochastic 수치에도 불구하고 그렇습니다.
더 장기적인 일봉 차트는 ADX에서 강한 상승 추세를 보여줌에도 불구하고 약세 신호도 제시합니다. Stochastic 지표는 %K 42.97, %D 29.88로 잠재적인 하락 추세를 보여주며, 최근 상승 모멘텀이 힘을 잃고 조정이 올 수 있음을 시사합니다. 일봉 차트의 전반적인 신호가 '매도'라는 사실(매수: 2, 매도: 5, 중립: 0)은 무시할 수 없습니다. 일봉 시간대에서 강한 ADX 추세와 Stochastic 및 MACD의 약세 신호 간의 이러한 충돌은 신중함을 시사합니다. 26,407달러의 중요 지지선은 가장 중요해지며, 이 수준 아래로의 돌파는 트레이더들이 시장 방향을 재평가함에 따라 상당한 매도 압력을 유발할 수 있습니다.
미국 달러 지수(DXY)와의 상관관계는 약세론자들에게 유리한 또 다른 중요한 요인입니다. DXY는 현재 98.01에서 거래되고 있으며, 1시간 및 4시간 차트에서 강세 추세를 보여 달러 강세를 나타냅니다. 역사적으로 달러 강세는 미국 자산이 외국인 투자자들에게 더 비싸지기 때문에 나스닥 100을 포함한 글로벌 주식에 압력을 가하는 경우가 많습니다. DXY가 1시간 차트에서 확인된 98.13 저항선으로 계속 상승한다면, 이는 나스닥 100에 대한 매도 압력을 악화시킬 수 있습니다.
기본적인 관점에서 볼 때, 인플레이션에 대한 우려와 금리가 더 오래 높게 유지될 가능성은 나스닥 100을 지배하는 성장 중심 주식에 부담을 줄 수 있습니다. 최근 경제 데이터는 혼조세를 보였지만, 지속적인 인플레이션의 징후나 예상보다 강한 노동 시장은 연준이 더 매파적인 입장을 취하게 하여 투자 심리를 위축시킬 수 있습니다. PMI 데이터와 같은 예정된 경제 일정은 이러한 기대치를 형성하는 데 중요할 것입니다. 예상보다 약한 수치는 경제 둔화에 대한 우려를 증가시켜 약세 주장을 뒷받침할 수 있습니다.
기술적 교전 지역: 주목할 수준
나스닥 100은 현재 26,494.12달러 부근의 중요한 결정 지점에 있습니다. 즉각적으로 주목해야 할 지지선은 26,407달러입니다. 이 수준은 역사적으로 중요한 바닥 역할을 해왔으며, 이 수준의 회복력이 단기 추세를 결정하는 핵심 요소가 될 것입니다. 26,407달러 아래로의 돌파는 4시간 차트상의 다음 주요 지지선인 26,326.04달러까지, 그리고 잠재적으로 26,270.55달러까지 하락을 가속화할 수 있습니다. 상승 측면에서는 26,568.73달러에 저항선이 있습니다. 강력한 거래량을 동반한 이 수준 위로의 설득력 있는 돌파는 26,610.78달러, 그리고 26,697.66달러를 향한 움직임의 재개를 신호할 수 있습니다.
지표들의 상호 작용은 이 그림에 복잡성을 더합니다. 1시간 차트의 RSI는 50.27로 중립을 시사하지만, 부정적인 MACD 모멘텀은 단기적인 매도 압력을 나타냅니다. 반대로, 4시간 차트의 RSI는 62.83으로 강세 편향을 나타내지만, 과매수 영역에 접근하고 있습니다. 4시간 차트의 Stochastic(%K 97.85)은 극도로 과매수 상태이며, 이는 곧 되돌림이 발생할 가능성이 높음을 시사하며, 이는 앞서 언급한 지지 수준을 테스트할 수 있습니다. ADX 수치는 시간대에 따라 크게 다릅니다. 일봉(29.83) 및 1시간(23.6)에서는 강하지만, 4시간(24.23)에서는 중간 수준으로, 모든 구간에서 동시에 명확한 방향성 확신이 부족함을 나타냅니다.
일봉 시간대는 더 장기적인 관점을 제공하며, MACD는 긍정적인 모멘텀을 보여주고 지수는 중간 볼린저 밴드 위에 거래되고 있습니다. 그러나 Stochastic 지표(%K 42.97, %D 29.88)는 향후 약세 가능성을 시사합니다. MACD의 강세 신호와 Stochastic의 약세 경향 간의 이러한 차이는 현재의 결정력 부족을 강조합니다. 나스닥 100이 26,494.12달러 위에서 위치를 유지하는 능력은 중요할 것입니다. 만약 유지된다면, 강세론자들은 26,568 저항선을 향해 밀어붙이려 할 수 있습니다. 그러나 그렇게 하지 못하면 가격이 하락하여 26,407달러 지지 영역을 테스트할 수 있습니다.
SP500 지수의 현재 가격인 6,572.87달러와 최근 상승세로 반영된 전반적인 시장 심리는 어느 정도의 위험 선호도를 시사합니다. 그러나 나스닥 100의 성과는 더 침체되어 있으며, 이는 잠재적인 섹터별 우려나 고평가된 기술주에서의 회전을 나타낼 수 있습니다. 일봉 차트의 강력한 ADX 상승 추세 신호와 다른 지표들의 약세 경향 간의 충돌은 시장이 갈림길에 있음을 시사합니다. 트레이더들은 지지 또는 저항 수준으로의 움직임에서 거래량에 면밀히 주의를 기울여야 하며, 확인이 중요할 것입니다.
불확실성 탐색: 앞으로의 길
나스닥 100은 상충되는 기술적 신호와 거시 경제의 역풍 사이에 끼어 중요한 기로에 서 있습니다. 강세 주장은 장기적인 추세 지표와 기술 분야의 지속적인 혁신 가능성에 의해 뒷받침됩니다. 그러나 즉각적인 일중 차트는 약점의 징후를 보이며, 강화되는 DXY와의 상관관계도 무시할 수 없습니다. 핵심은 26,407달러 지지 수준의 중요성입니다. 이 수준 아래로의 결정적인 돌파는 강세 논리를 무효화하고 더 상당한 조정을 위한 문을 열 가능성이 높습니다.
반대로, 나스닥 100이 26,407달러 위에서 유지되고 26,568달러 저항선을 돌파한다면, 이는 매수자들의 갱신된 의지를 신호할 것입니다. 이 시나리오는 긍정적인 경제 데이터와 지속적인 기술 발전 서사에 의해 뒷받침될 가능성이 높습니다. 일봉 MACD의 강세 모멘텀과 Stochastic의 약세 경향 간의 충돌은 시장이 더 명확한 신호를 기다리고 있음을 시사하며, 이는 다가오는 경제 이벤트나 중앙은행 논평에서 나올 수 있습니다.
트레이더들에게 현재 환경은 신중한 접근을 요구합니다. 장기 추세 지표는 여전히 어느 정도 지지를 제공하지만, 일중 약점과 상충되는 신호는 신중한 위험 관리를 정당화합니다. 26,407달러 지지선과 26,568달러 저항선 주변의 가격 움직임을 모니터링하는 것이 중요할 것입니다. 상당한 거래량을 동반한 돌파 또는 하향 돌파의 확인은 높은 확신을 가진 거래를 설정하는 데 필요할 것입니다. 시장은 이 수준에서 고전적인 강세 대 약세 논쟁을 제시하고 있으며, 명확한 설정이 나올 때까지 기다리는 사람들에게는 인내가 보상받을 것입니다.
나스닥 100의 향후 경로는 연준의 정책 경로, 다가오는 인플레이션 및 고용 데이터, 그리고 기술 및 혁신에 대한 지속적인 서사를 포함한 여러 요인의 복합 작용에 의해 결정될 가능성이 높습니다. 일봉 차트의 강력한 ADX는 근본적인 추세 강도를 시사하지만, 일중 신호와 DXY 상관관계는 상당한 불확실성을 야기합니다. 트레이더들은 경계를 늦추지 않고, 위험을 엄격하게 관리하며, 상당한 포지션을 취하기 전에 명확한 확인을 기다려야 합니다.
자주 묻는 질문: 나스닥 100 분석
나스닥 100이 26,407달러 지지선을 하향 돌파하면 어떻게 되나요?
26,407달러 아래로의 결정적인 종가는 즉각적인 강세 전망을 무효화하고 추가 매도 압력을 유발할 가능성이 높습니다. 다음 주요 지지선은 4시간 차트 데이터에 표시된 대로 26,326.04달러와 26,270.55달러가 될 것입니다.
혼조세를 보이는 현재 수준(약 26,494달러)에서 나스닥 100을 매수해야 할까요?
상충되는 시간대별 신호로 인해 현재 수준에서는 주의가 권장됩니다. 26,568.73달러 저항선 위로의 확인된 돌파(양호한 거래량 동반)는 더 설득력 있는 강세 설정을 제공할 것입니다. 또는 26,407달러 지지선의 확인된 유지를 기다리는 것이 강세론자들에게는 더 낮은 위험 진입점을 제공할 수 있습니다.
4시간 차트의 RSI 62.83은 나스닥 100에 대한 매도 신호인가요?
4시간 차트의 RSI 62.83은 강세 편향을 나타내지만 과매수 영역에 접근하고 있습니다. 이는 그 자체로 즉각적인 매도 신호는 아니지만, 먼저 되돌림이나 통합 없이는 추가 상승이 제한될 수 있음을 시사합니다. Stochastic 또는 MACD와 같은 다른 지표의 확인이 필요합니다.
이번 주 예정된 PMI 데이터는 나스닥 100에 어떤 영향을 미칠까요?
예상보다 강한 PMI 데이터는 투자 심리를 부양하고 나스닥 100의 상승 움직임을 지지하여 저항선 돌파에 도움이 될 수 있습니다. 반대로, 약한 수치는 경제 둔화에 대한 우려를 증가시켜 매도 압력을 높일 수 있습니다.