
USDJPY 158.63 Desteğe Yakın: Haftalık Görünüm
USDJPY 158.63 seviyesinde işlem görüyor. Geçen haftanın fiyat hareketlerini, kilit seviyeleri ve DXY ile BoJ politika değişimleri ortasında parite için gelecek beklentilerini inceliyoruz.
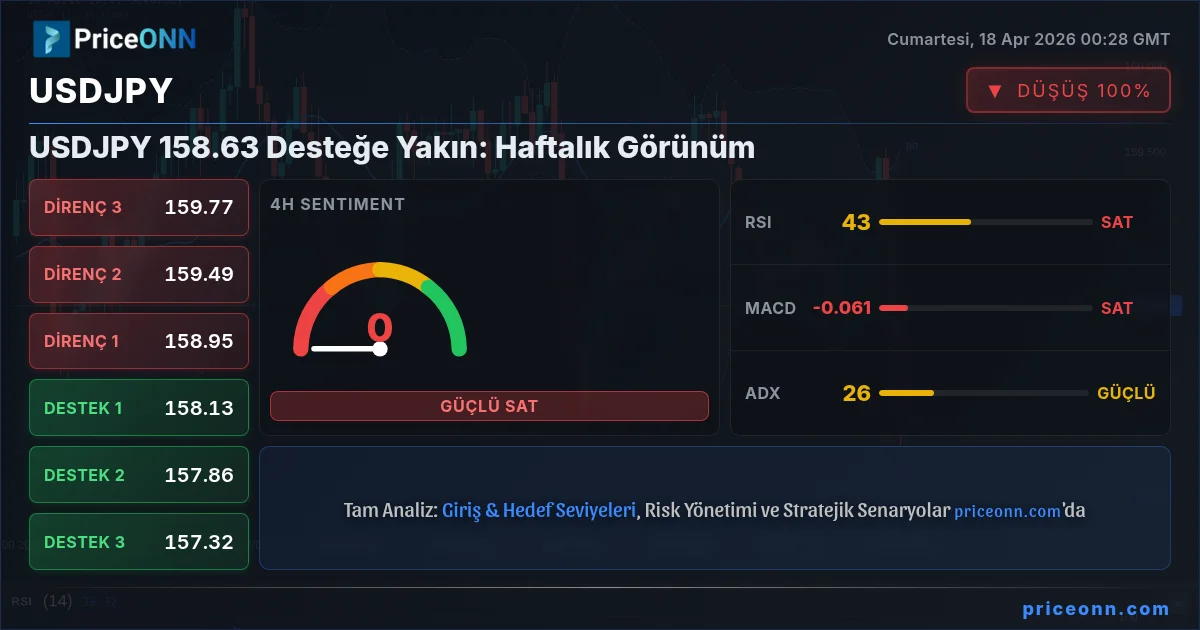
USDJPY için hassas denge devam ediyor. Geçen hafta parite, kritik 158.63 seviyesi civarında seyrederken, destek seviyelerini test etti ve piyasa duyarlılığındaki değişimler ile devam eden jeopolitik gerilimlerden kaynaklanan ters rüzgarlarla karşılaştı. Bu önemli döviz çiftini izleyen yatırımcılar için Dolar Endeksi (DXY), Japonya Merkez Bankası (BoJ) politika fısıltıları ve genel risk iştahı arasındaki etkileşimi anlamak büyük önem taşıyor. Bu sadece tek bir döviz çifti meselesi değil; küresel makroekonomiye ve uluslararası finansın hassas dengesine açılan bir pencere. Yeni işlem haftasına girerken, grafikler ve haberler temkinli bir konsolidasyon hikayesi anlatıyor gibi görünüyor, ancak önemli hareketleri tetikleyebilecek altta yatan akıntılar da mevcut. Geçen haftanın hareketlerini inceleyelim ve gelecek potansiyel senaryolara göz atalım.
- USDJPY geçen haftayı 158.63 yakınında kapattı ve 158.48'deki ana desteğin üzerinde dayanıklılık gösterdi.
- Dolar Endeksi (DXY), 97.9'a hafif bir geri çekilme yaşayarak USDJPY'nin yukarı yönlü momentumunu etkiledi.
- Teknik göstergeler, 1 saatlik grafikte RSI 46.66 ile nötr-leşen-düşüş eğilimli kısa vadeli bir görünüm önerirken, günlük grafikte daha güçlü bir yükseliş eğilimi (RSI 48.98) mevcut.
- Özellikle Hürmüz Boğazı ile ilgili jeopolitik riskler, güvenli liman varlığı olarak Yen'e olan talebi desteklemeye devam ediyor.
- Piyasa, yaklaşan ekonomik verileri ve Japonya Merkez Bankası'nın para politikası duruşuna ilişkin ek ipuçlarını yakından izliyor.
Karşıt Dinamikler Arasında Yön Bulmak: USDJPY ve Dolar Endeksi Dansı
USDJPY ve Dolar Endeksi (DXY) arasındaki ilişki genellikle bir dans olarak tanımlanır ve geçen hafta bu dans özellikle karmaşıktı. DXY'nin son zirvelerinden hafifçe geri çekilerek 97.9 civarında yerleşmesi, USDJPY'ye daha önce yaşadığı yoğun satış baskısından kısa bir rahatlama sağladı. Ancak bu, doğrudan ters korelasyon oyunu değildi. Zayıflayan bir dolar tipik olarak USDJPY'yi desteklese de, paritenin kendi iç dinamikleri ve Yen'in güvenli liman çekiciliği resmi karmaşıklaştırdı. Kar realizasyonu ve belki de yaklaşan ekonomik verilere yönelik bazı beklentilerin karışımıyla DXY'deki geri çekilme, USDJPY'nin 158.48 destek seviyesi yakınında yerini bulmasına olanak tanıdı. Yine de, ABD Merkez Bankası'nın (Fed) şahin beklentileriyle beslenen son haftalardaki doların genel gücü, herhangi bir kalıcı dolar zayıflığının kısa ömürlü olabileceği anlamına geliyor. Yatırımcılar, DXY'nin mevcut seviyelerini koruyup koruyamayacağını veya daha fazla satışa boyun eğip eğmeyeceğini yakından izleyecekler; bu da muhtemelen USDJPY'ye daha fazla nefes alma alanı sağlayacaktır. Etkileşim çok önemlidir; 98.00 üzerindeki güçlü bir DXY, tipik olarak USDJPY üzerinde önemli bir aşağı yönlü baskı uygulayarak onu daha düşük destek seviyelerine itecektir, oysa 97.50'nin altındaki bir kırılma daha geniş bir dolar düzeltmesine işaret edebilir ve potansiyel olarak USDJPY'yi yükseltebilir.
4 saatlik grafiğe bakıldığında, 25.69'daki ADX sağlam bir trende işaret ediyor, ancak sinyaller karışık. MACD negatif bir momentum gösteriyor, bu da bu zaman diliminde satıcıların hala kontrol sahibi olduğunu gösteriyor ve Stokastik osilatör (%K=44.9, %D=77.36) da potansiyel bir düşüşe işaret ediyor, %K çizgisi %D çizgisinin altında. Trend gücü ile kısa vadeli momentum göstergeleri arasındaki bu ayrışma, gördüğümüz dalgalanmayı vurguluyor. Bu, güçlü bir trendin mevcut olduğu ancak anlık yönün belirsiz olduğu klasik bir durumdur ve bu da piyasa katılımcıları arasında kararsızlığa yol açar. Bu, dalgalı sularda yol bulmak için tek başına göstergelere değil, belirli fiyat seviyelerine odaklanmanın neden bu kadar hayati olduğunu açıklar.
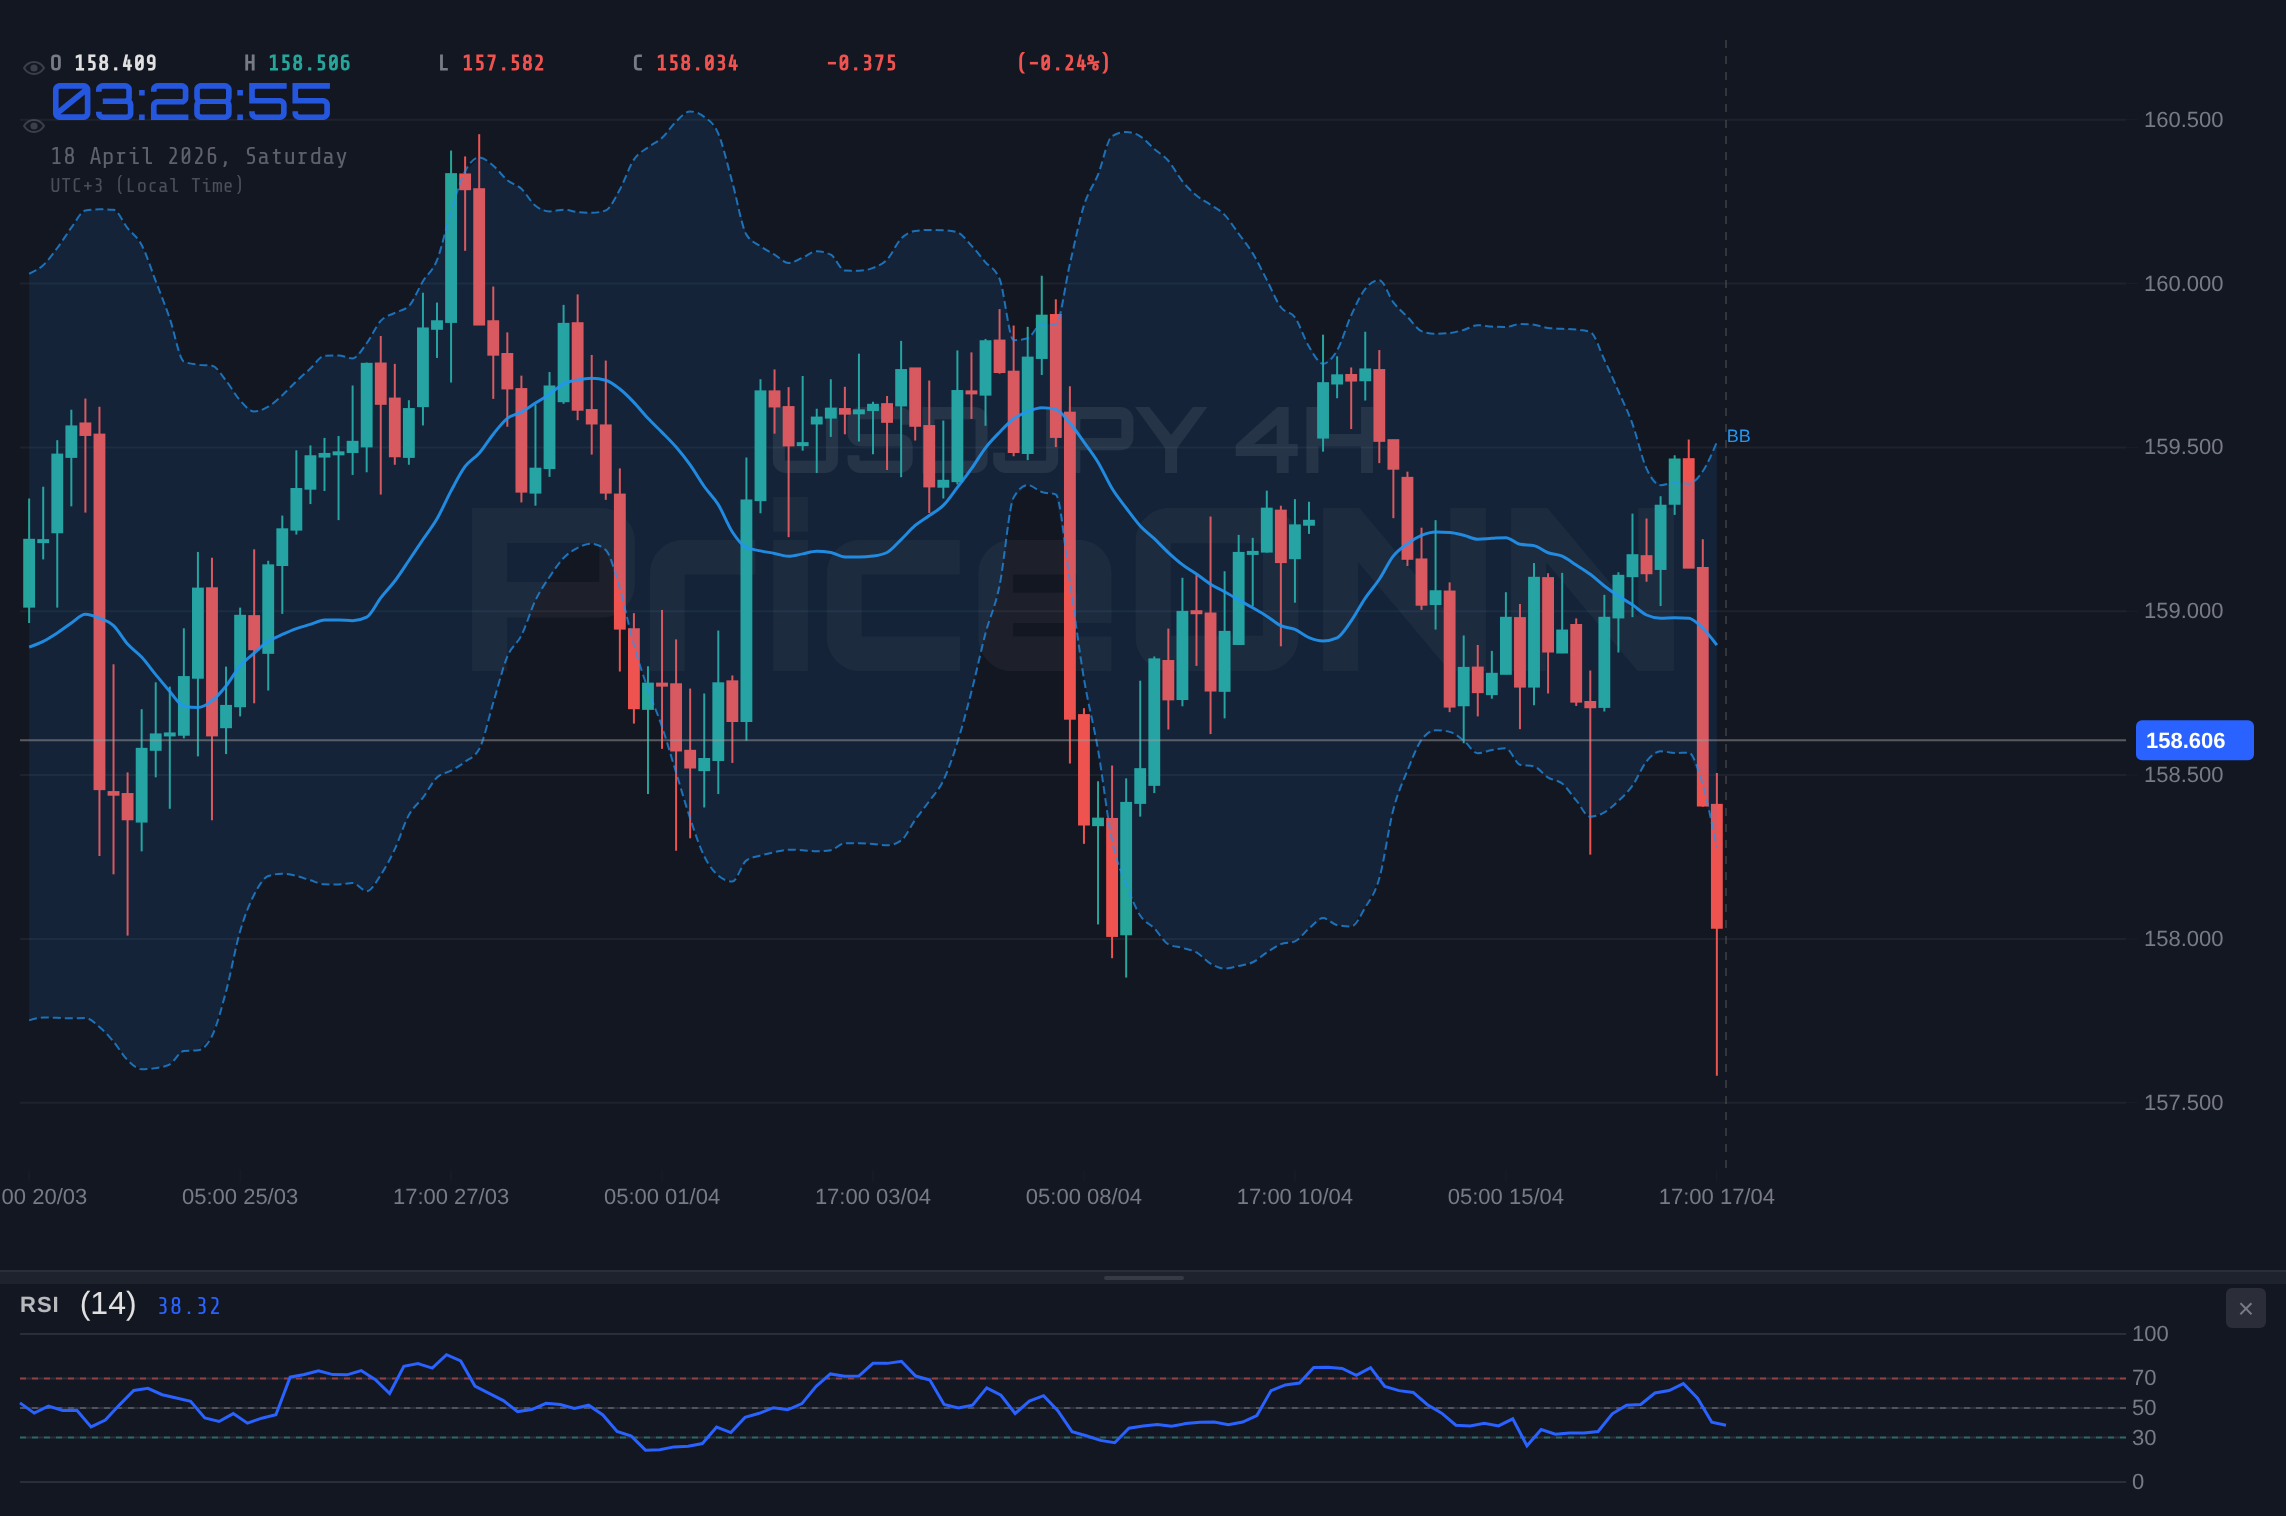
💡 Profesyonel Yatırımcı Görüşü
USDJPY için mevcut piyasa ortamı, bir çekişme savaşı ile karakterize ediliyor. Bir yandan, ADX tarafından belirtilen daha geniş trend gücü, yönlü bir hareketin muhtemelen devam edeceğini gösteriyor. Öte yandan, farklı zaman dilimlerindeki RSI ve Stokastik gibi osilatörlerden gelen çelişkili sinyaller, bir konsolidasyon dönemi veya bir sonraki büyük hamleden önceki potansiyel bir kısa vadeli tersine dönme işaret ediyor. Bu, uzun vadeli trend yerleşik olsa da, kısa vadeli yatırımcıların aşırı dikkatli olması ve net onay sinyalleri araması gerektiği anlamına gelir. Daha uzun vadeli bir bakış açısına sahip olanlar için anahtar, mevcut destek seviyelerinin korunup korunmadığını belirleyerek daha geniş yükseliş trendinin devamına zemin hazırlamaktır.
Jeopolitik Şoklar Ortasında Yen'in Güvenli Liman Çekiciliği
Doların manevralarının ötesinde, özellikle mevcut jeopolitik iklimde Japon Yeni'nin güvenli liman varlığı olarak doğal rolü küçümsenemez. Hürmüz Boğazı ile ilgili devam eden endişeler ve daha geniş Orta Doğu gerilimleri dahil olmak üzere geçen haftaki gelişmeler, Yen'e destek sağlamaya devam etti. Büyük petrol arz kesintilerine ilişkin acil korkular biraz azalsa da, altta yatan jeopolitik risk primi yüksek kalmaya devam ediyor. Bu ortam, doğal olarak Yen gibi algılanan güvenli limanlara sermaye çeker ve doların gücüne karşı bir karşı kuvvet oluşturarak USDJPY'nin yukarı yönlü hareketini sınırlar. Reuters gibi kaynaklardan gelen haberler, İran'ın Hürmüz Boğazı'nı yeniden açtığını belirtse de, bölgedeki temel gerilimlerin çözülmekten uzak olduğunu gösterdi. Bu, herhangi bir tırmanmanın, ne kadar küçük olursa olsun, güvenli limanlara yönelik yeniden bir kaçışı tetikleyebileceği, Yen'i güçlendirebileceği ve potansiyel olarak USDJPY'yi düşürebileceği bir senaryo yaratıyor. Bu güvenli liman talebi, güçlü dolar yükseliş anlatılarını bile geçersiz kılabilecek kritik bir faktördür ve yatırımcıların küresel olaylardan haberdar olmalarını zorunlu kılar. Günlük grafikteki ADX'in 16.92 olması zayıf bir trende işaret ediyor, ancak güvenli liman akışlarının baskın olduğu durumlarda bu yanıltıcı olabilir; bu akışlar genellikle mevcut trendlere karşı keskin, ancak potansiyel olarak kısa ömürlü hareketler olarak kendini gösterir.
1 saatlik RSI 46.66'da, bu kısa vadeli zaman diliminde düşüş eğilimli bir duyarlılık gösteriyor ve bu da Yen'in güvenli liman çekiciliğinin şu anda USDJPY için herhangi bir yükseliş momentumunu zayıflattığı fikriyle uyumlu. Ancak, günlük grafikte RSI 48.98'de bulunuyor ve bu da hala nötr bölgede olmasına rağmen biraz daha dirençli bir tablo sergiliyor. 1 saatlik ve günlük grafikler arasındaki bu RSI okumalarındaki fark, kısa vadeli düşüş eğilimi ile daha nötr, belki de temkinli bir iyimser uzun vadeli görüş arasındaki ayrımı vurguluyor. Bu, günlük işlem yapanların satış baskısı görebileceği, ancak günlük tablonun önemli bir düşüşten daha az emin olduğunu gösteriyor. Strateji geliştirme için farklı zaman dilimlerini anlamanın kritik olduğu yer burasıdır. Bir scalper 1 saatlik düşüş sinyallerine odaklanabilirken, bir swing trader trendin devamı veya tersine dönmesi için günlük onay bekleyebilir.
BoJ Politika Gölgeleri: Yen İçin Sıradaki Ne?
Japonya Merkez Bankası'nın para politikası, Yen için önemli bir belirsizlik unsuru olmaya devam ediyor. Japonya'dan gelen perakende satışlar (gerçekleşen %2.6, beklenti %2.5) gibi son ekonomik veri açıklamaları bazı canlanma işaretleri gösterse de, BoJ'un gevşek duruşunu kökten değiştirecek kadar güçlü olmadılar. Piyasa, daha fazla parasal genişleme olasılığını veya en azından tipik olarak bir para birimini zayıflatan ultra düşük faiz oranlarının uzun süreli bir dönemini fiyatlamaya devam ediyor. Ancak, potansiyel bir politika değişikliğine dair fısıltılar, ne kadar zayıf olursa olsun, her zaman mevcuttur. BoJ yetkililerinden para politikasını normalleştirme, getiri eğrisi kontrolünü ayarlama veya hatta Yen'in değer kaybının etkisini kabul etme yönündeki herhangi bir ipucu, USDJPY'de önemli dalgalanmalara neden olabilir. Geçen haftanın ekonomik takvimi ABD ekonomisi için karışık sinyaller gösterdi; Tüketici Güveni (gerçekleşen 26.7, önceki 18.1) gibi bazı veri noktaları güç gösterirken, bir önceki günkü istihdam rakamları gibi diğerleri beklenenden zayıftı. Bu ekonomik arka plan, Fed'e manevra alanı sağlıyor, ancak aynı zamanda bazen güvenli liman para birimlerine fayda sağlayabilen belirsizlik yaratıyor. Piyasanın bu veri noktalarını yorumlaması ve bunların Fed'in bir sonraki hamlesini nasıl etkileyebileceği, doların gidişatını ve dolayısıyla USDJPY'yi doğrudan etkiliyor.
4 saatlik grafikteki 38.1 ADX değeri güçlü bir trende işaret ediyor, bu da diğer göstergelerden gelen karışık sinyallerle birleştiğinde potansiyel dalgalı hareketler dönemi anlamına geliyor. MACD şu anda negatif bir momentum gösteriyor ve Stokastik (%K=60.96, %D=34.62) yükseliş sinyali veriyor, bu da potansiyel bir ayrışmaya işaret ediyor. Bu ayrışma dikkat gerektirir; mevcut trendin zayıflamasına veya bir tersine dönmenin öncüsü olabileceğini gösterebilir. %K çizgisinin %D çizgisinin üzerinde olması kısa vadeli alım baskısını gösteriyor, ancak negatif MACD momentumu bu hareketi çok agresif bir şekilde takip etmeye karşı uyarıyor. Buradaki anahtar, yakınsama; yatırımcılar bu ayrışmaya yalnızca dayanarak bir işlem yapmadan önce diğer destekleyici faktörleri aramalıdır.
⚠️ Risk Uyarısı
Japonya Merkez Bankası'nın politika toplantıları ve açıklamaları önemli piyasa hareketlendiricileridir. Politika duruşlarında beklenmedik bir değişiklik veya yetkililerden şahin yorumlar bile ani bir Yen değerlenmesine ve USDJPY'de buna karşılık gelen bir düşüşe neden olabilir. Yatırımcılar, mevcut teknik kurulumları hızla geçersiz kılabileceği için Japon para politikasıyla ilgili herhangi bir habere veya yoruma karşı tetikte olmalıdır. Dahası, Orta Doğu'daki devam eden jeopolitik gerilimler piyasaya ani dalgalanmalar getirebilir ve her an Yen'e yönelik güvenli liman akışlarını tetikleyebilir.
USDJPY Teknik Seviyeler: 158.63 Civarında Bir Savaş Alanı
USDJPY için geçen haftaki teknik manzara, 158.63 seviyesi etrafındaki bir savaşla tanımlandı. Günlük grafikte, fiyat 158.48 civarında destek buldu; bu seviye önemli bir psikolojik ve teknik nokta olduğunu kanıtladı. Verilerde sağlanan günlük destek seviyeleri 157.546, 157.32 ve 156.977'dir. Buna karşılık, 158.115, 158.458 ve 158.684 civarında direnç oluşuyor. Mevcut 158.63 fiyatının kısa vadeli günlük direncin hemen altında seyrediyor olması, hassas dengeyi vurguluyor. 158.684'ün üzerinde kararlı bir kırılma, haftalık zirve olan 159.524'ü hedefleyerek daha yüksek direnç seviyelerine doğru bir harekete kapı açabilir. Öte yandan, 158.48 desteğini koruyamamak, USDJPY'nin 158.115 seviyesini yeniden test etmesine ve hatta daha önemli 157.546 desteğine meydan okumasına neden olabilir. 1 saatlik grafik, yatırımcıların yön bulması gereken günlük oynaklığı gösteren 158.222'de daha yakın destek ve 158.547'de direnç gösteriyor.
Teknik göstergeler karışık bir tablo çiziyor, bu da bu tür konsolidasyon aşamalarında tipiktir. 1 saatlik grafikte RSI (46.66) ve MACD düşüş momentumunu gösterirken, Stokastik (%K=50.2, %D=27.5) yükseliş sinyali veriyor. Bu, yatırımcıların dikkatlice yorumlaması gereken açık bir ayrışmadır. 1 saatlik grafikteki ADX 35.55'te hala güçlü bir trende işaret ediyor, ancak çelişkili sinyaller bu trendin gücünü yitirdiğini veya bir tersine dönmeye hazırlandığını gösteriyor. Günlük grafikte RSI 48.98 ile daha nötr ve MACD pozitif momentum gösterirken, Stokastik (%K=49.92, %D=52.65) düşüş sinyali veriyor. Farklı zaman dilimleri arasındaki bu sinyal etkileşimi, çoklu zaman dilimi analizinin önemini vurguluyor. Örneğin, kısa bir giriş arayan bir yatırımcı 1 saatlik düşüş sinyallerini bekleyebilirken, uzun vadeli bir yatırımcı, ana destek seviyeleri korunması koşuluyla, günlük grafiğin daha nötr RSI ve pozitif MACD momentumuna odaklanabilir.
USDJPY Bugün Analizi: Rakamlar Bize Ne Anlatıyor?
'USDJPY bugün analizi'ne odaklandığımızda, bir yol ayrımında olan bir piyasa görüyoruz. Mevcut 158.63 fiyatı, güçlerin hassas bir dengesini yansıtıyor. Günlük grafiğin genel sinyali 'AL' (Al: 7, Sat: 1, Nötr: 0), kısa vadeli ters rüzgarlara rağmen uzun vadeli tablonun yapıcı kaldığını gösteriyor. Bu, günlük RSI'nin 48.98 olmasıyla destekleniyor; bu seviye nötr olsa da hafif yukarı yönlü bir eğilim gösteriyor ve MACD pozitif momentumu koruyor. Ancak, günlük Stokastik (%K=49.92, %D=52.65) düşüş sinyali veriyor ve ADX 22.43'te, kaçış trendi olmayan orta düzeyde bir trende işaret ediyor. Bu karmaşıklık, tek bir göstergeye veya zaman dilimine güvenmenin felakete davetiye çıkarabileceği anlamına geliyor. 158.63 civarındaki fiyat hareketi kritik. Bu seviyenin üzerinde kalıcı bir tutunma, özellikle 159.00 psikolojik seviyesine doğru itilebilirsek, önemli bir yükseliş gelişmesi olacaktır. Tersine, 158.48 desteğinin altına bir kırılma, zarar durdur emirlerini tetikleyebilir ve 157.50'li seviyelere doğru bir hareketi hızlandırabilir.
Son haber akışı da bu analize katmanlar ekliyor. Bitcoin'in 75.000 dolar civarında konsolide olması ve Altın'ın 4.900 doları test etmesi, karışık bir risk ortamı öneriyor. Altının gücü bir miktar güvenli liman talebini gösterse de, Bitcoin'in direnç yakınındaki konsolidasyonu, risk iştahının tamamen sönmediği anlamına geliyor. Bu karışık duyarlılık genellikle forex piyasalarında dalgalı hareketlere yol açar, burada USDJPY hem dolar gücünden hem de Yen güvenli liman akışlarından etkilenebilir. USD/CAD'nin 1.3700'ün altındaki düşüş serisini uzatması, küresel risk duyarlılığında bir değişim sinyali verirse, USDJPY'yi dolaylı olarak etkileyebilecek daha geniş dolar zayıflığına işaret ediyor. Ana çıkarım, teknik göstergeler bir savaş alanı gösterirken, temel arka planın da eşit derecede belirsiz olması ve disiplinli ve veriye dayalı bir yaklaşım gerektirmesidir.
1 saatlik trend %50 güçle nötr, ancak 35.55'teki ADX, RSI ve Stokastik'ten gelen çelişkili sinyallere rağmen güçlü bir trendin mevcut olduğunu gösteriyor. Bu, kısa vadeli yatırımcıların sıkışıp kalabileceği klasik bir senaryodur. Güçlü trend gücünün (ADX) varlığı, düşüş eğilimli kısa vadeli göstergeler (RSI) ve yükseliş eğilimli kısa vadeli osilatör sinyali (Stokastik) ile birleştiğinde, dalgalanmanın muhtemel olduğu anlamına gelir. 1 saatlik grafikte izlenmesi gereken kritik destek seviyesi 158.222, ardından 158.014'tür. Bu seviyelerin altına bir kırılma, muhtemelen 1 saatlik RSI ve MACD'de görülen düşüş eğilimini teyit edecek ve daha derin bir düzeltmeye yol açabilecektir. Tersine, USDJPY 1 saatlik grafikte 158.547 direncini geri kazanabilirse, bu, günlük zaman diliminde görülen yükseliş eğilimine doğru kısa vadeli bir değişime işaret edebilir.
💡 Piyasa Duyarlılığı Analizi
USDJPY için mevcut piyasa duyarlılığı, temkinli bir kararsızlık durumu gibi görünüyor. Daha uzun vadeli günlük göstergeler yukarı yönlü potansiyel gösterirken, kısa vadeli 1 saatlik ve 4 saatlik grafikler daha karışık, hatta düşüş eğilimli bir tablo sunuyor. Bu muhtemelen çelişkili temel sürücülerin bir yansımasıdır: güçlü dolar anlatısı, Yen güvenli liman talebi ve Japonya Merkez Bankası'nın gelecekteki politikasına ilişkin belirsizlik. Yatırımcılar, ya kilit teknik seviyelerin kesin bir kırılmasından ya da makroekonomik verilerdeki veya jeopolitik olaylardaki önemli değişimlerden daha net bir sinyal bekliyorlar.
Geleceğe Bakış: USDJPY İçin Kilit Seviyeler ve Senaryolar
Önümüzdeki haftaya bakarken, USDJPY kritik bir kavşakta duruyor. 158.63 fiyat noktası bir pivot görevi görüyor ve hem boğalar hem de ayılar için önemli çıkarımlara sahip. 158.483, 157.849 ve 157.442'deki destek seviyeleri yakından izlenecek. 158.483 seviyesini koruyamamak, 157.849'a doğru bir zincirleme etkiyi tetikleyebilir ve hatta psikolojik 157.50 bariyerine meydan okuyabilir. Yükseliş tarafında, 159.524'teki direnç acil engeldir. Bu seviyenin üzerinde güçlü hacim ve pozitif DXY korelasyonu ile onaylanmış kalıcı bir kırılma, tarihsel olarak fiyat hareketi için önemli bir mıknatıs olan 160.00 seviyesine doğru bir harekete zemin hazırlayabilir. 4 saatlik grafiğin 23.31 ADX'i orta düzeyde bir yükseliş trendine işaret ediyor, ancak 59.02 RSI ve 48.44.28 (%K=64.4, %D=44.28) Stokastik, aşırı alım koşullarına ulaşmadan önce daha fazla yukarı yönlü potansiyel olduğunu gösteriyor. Bu, yükseliş momentumu sürdürülebilirse, daha yükseğe çıkma potansiyeli olduğunu gösteriyor.
Önümüzdeki hafta AUD'nin Yen'den daha güçlü olmasının beklenip beklenmeyeceği sorusu, Yen'e karşı daha geniş emtia para birimi dinamiklerini yansıtan ilginç bir soru. AUD, 4 saatlik grafikte (RSI 64.56, ADX 36.71) güç gösterse de, Yen'in güvenli liman statüsü, küresel belirsizlik dönemlerinde genellikle daha iyi performans göstermesine neden olabilir. Bu nedenle, AUD teknik güç gösterse de, Yen'in performansı büyük ölçüde küresel risk duyarlılığına bağlı olacaktır. Bu, para piyasalarının ne kadar birbirine bağlı olduğunu ve bir bölgedeki veya bir varlık sınıfını etkileyen olayların, görünüşte ilgisiz çiftler arasında dalgalanmalara nasıl yol açabileceğini vurguluyor.
Günlük grafiğin genel yükseliş sinyali (Al: 7, Sat: 1, Nötr: 0), daha uzun vadeli bir bağlam sağlıyor, ancak Stokastik (düşüş eğilimli) ve orta düzey ADX (22.43) gibi osilatörlerden gelen karışık sinyaller, yukarı yönlü yolun pürüzsüz olmayabileceğini gösteriyor. Piyasanın dinamik olduğunu hatırlamak çok önemlidir. Beklenmedik ekonomik veri açıklamaları, merkez bankası yorumları veya jeopolitik değişimler görünümü hızla değiştirebilir. Bu nedenle, önümüzdeki haftayı yönlendirmek için açıkça tanımlanmış risk yönetimi stratejileriyle esnek bir yaklaşım esastır.
Düşüş Senaryosu: Yen Gücü Yeniden Başlıyor
25% OlasılıkNötr Senaryo: 158.63 Civarında Konsolidasyon
40% OlasılıkYükseliş Senaryosu: Dolar Gücü Hakim Oluyor
35% OlasılıkSıkça Sorulan Sorular: USDJPY Analizi
USDJPY 158.483 destek seviyesinin altına kırılırsa ne olur?
Günlük grafikte 158.483'ün altına bir kırılma, mevcut yükseliş kurulumunu geçersiz kılacak ve zarar durdur emirlerini tetikleyerek bir sonraki destek olan 157.849'a doğru hareketi hızlandırabilecektir. Bu senaryo muhtemelen yeniden başlayan dolar zayıflığı veya Yen'e yönelik artan güvenli liman talebiyle tetiklenecektir.
Karışık sinyaller göz önüne alındığında, mevcut 158.63 civarındaki USDJPY almayı düşünmeli miyim?
Kısa vadeli düşüş göstergeleri ile daha nötr-yükseliş eğilimli günlük görünüm arasındaki çelişkili sinyaller göz önüne alındığında, ihtiyatlı olunması tavsiye edilir. Alım girişi düşünülmeden önce, 159.524 direncinin üzerinde kararlı bir kapanış veya artan hacimle 158.483 desteğinin üzerinde tutunma gibi bir onay sinyali gereklidir. Risk yönetimi esastır.
Günlük grafikteki 48.98 RSI, USDJPY boğaları için bir endişe kaynağı mı?
Günlük grafikte 48.98 RSI, nötr bölge olarak kabul edilir, hafifçe düşüş eğilimli olsa da yukarı hareket için yeterli alana sahiptir. Anında aşırı alım koşulları sinyali vermese de, güçlü bir yükseliş güvencesi de sağlamıyor. Boğalar, sürdürülebilir yukarı yönlü momentumu doğrulamak için RSI'nin 50'nin üzerine ve ideal olarak 60'a tırmandığını görmek isteyeceklerdir.
Bu hafta yaklaşan Japonya Merkez Bankası politika ipuçları USDJPY'yi nasıl etkileyebilir?
Japonya Merkez Bankası'ndan ultra gevşek para politikasından potansiyel bir sapmaya ilişkin herhangi bir işaret, Yen'i önemli ölçüde güçlendirebilir ve USDJPY'de keskin bir düşüşe neden olabilir. Tersine, dolar gücünün devam ettiği varsayılırsa, devam eden güvercin söylem mevcut trendi destekleyecektir. Yatırımcılar, potansiyel dalgalanmalar için BoJ açıklamalarını yakından izlemelidir.
Piyasaları canlı takip edin
AI destekli analizler, teknik göstergeler ve anlık fiyat verileri.
Telegram Kanalımıza Katılın
Son dakika piyasa haberleri, AI analizleri ve trading sinyalleri.
Kanala Katıl