Nasdaq 100 at $26,687: Overbought RSI Amid Strong Uptrend?
Nasdaq Composite surges to $26,687.10, fueled by AI and easing oil fears. Is the overbought RSI a cause for concern or just a pause before further gains?
The Nasdaq Composite is currently locked in a battle with its own success, trading at $26,687.10, a level that embodies both the exhilarating momentum of the tech sector and the looming shadow of potential overextension. This isn't just another trading day; it's a critical juncture where the relentless march of AI enthusiasm meets the stark reality of technical indicators flashing warning signs. Having surged dramatically, the index now finds itself at a crossroads, demanding a closer look at whether this ascent is sustainable or if a correction is due.
The recent rally, particularly evident in the 1-hour and 4-hour charts, paints a picture of aggressive buying pressure. The ADX at a robust 53.65 on the 4-hour timeframe unequivocally signals a strong, committed trend. This isn't a nascent move; it's a well-established upward trajectory where bulls are firmly in control. The MACD histogram on the 1-hour chart, while showing positive momentum, is hovering above the signal line, indicating that the buying conviction is still present. However, the Stochastic Oscillator on the 1-hour chart is deep in overbought territory at 97.01, and the 4-hour Stochastic is not far behind at 88.82. This divergence between a strong trend and extremely overbought oscillators is precisely where caution becomes paramount for traders.
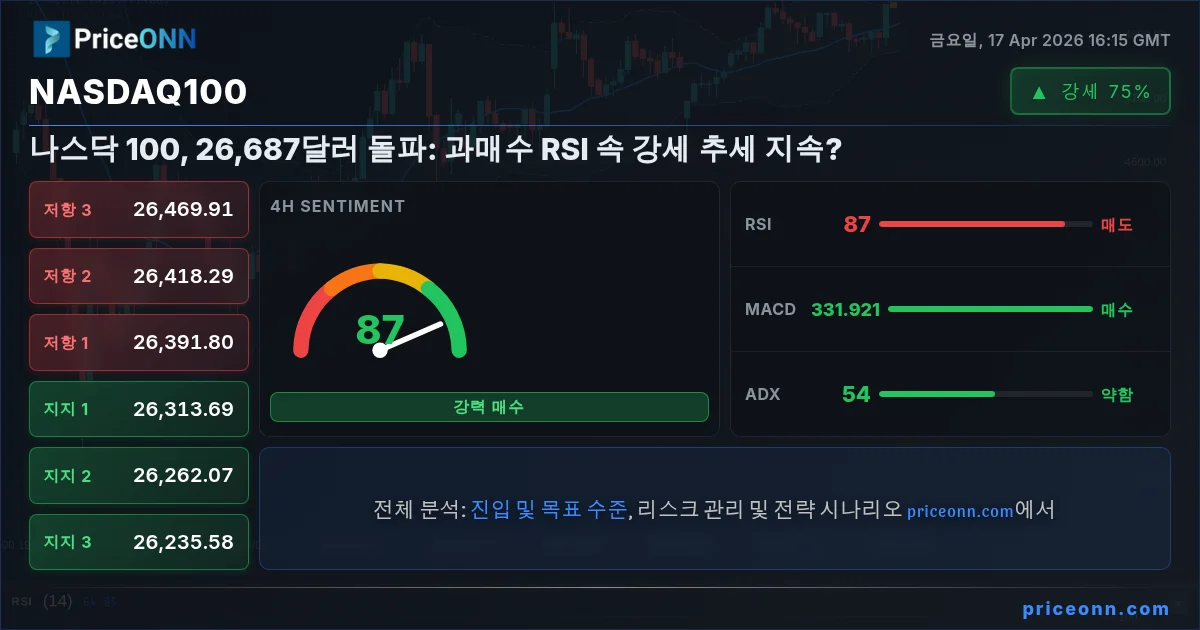
- RSI at 82.27 on the 1H chart signals significant overbought pressure, suggesting potential for a pullback or consolidation.
- Key resistance is forming around $26,847.30, while critical support lies at $26,593.78, tested multiple times this week.
- The ADX at 53.65 indicates a very strong uptrend on the 4H chart, suggesting any pullback might be shallow.
- Fed rate expectations and AI sector sentiment are driving Nasdaq Composite correlation with DXY movements and oil price stability.
The Dual Catalysts: AI Enthusiasm and Easing Oil Fears
What's fueling this impressive run? Two primary forces appear to be at play, creating a potent cocktail for the tech-heavy Nasdaq. Firstly, the unwavering enthusiasm surrounding Artificial Intelligence continues to pour fuel on the fire. Companies at the forefront of AI development, from chip manufacturers to software providers, are experiencing unprecedented demand and investor interest. This sector-specific strength provides a powerful tailwind for the Nasdaq, which is heavily weighted towards these growth-oriented technology giants. The narrative is simple: AI is the future, and investors are betting heavily on its transformative potential, driving up valuations across the board.

Secondly, the easing of fears surrounding oil prices has provided a much-needed reprieve for broader market sentiment. With Brent crude trading at $89.98 and WTI at $84.20, the sharp daily drops suggest that the immediate geopolitical tensions, while still present, are not translating into a sustained, crippling energy shock. This de-escalation, or at least a stabilization, in energy markets reduces the immediate threat of inflation spikes. Lower inflation expectations can translate into a more favorable outlook for interest rates, which is inherently good news for growth stocks like those dominating the Nasdaq. When energy costs stabilize, consumer spending power may increase, and corporate input costs can become more predictable, both of which support a positive market environment.
RSI's Red Flag: A Warning or Just Noise?
The technical picture, however, is not entirely rosy. The Relative Strength Index (RSI), a momentum oscillator, is flashing a clear warning signal. On the 1-hour chart, the RSI stands at a lofty 82.27, firmly in overbought territory. On the 4-hour chart, it's even higher at 86.83, and on the daily chart, it hovers around 75.31. While an RSI above 70 generally indicates that an asset is overbought and may be due for a correction or consolidation, its interpretation within a strong uptrend requires nuance. In powerful bull markets, RSI can remain in overbought territory for extended periods. The question for traders is whether this current RSI reading signifies an imminent reversal or simply reflects the overwhelming buying pressure.
The MACD indicator on the 1-hour chart shows positive momentum, with the MACD line above the signal line. This suggests that the short-term trend is still bullish. However, the MACD on the 4-hour chart is exhibiting negative momentum, with the histogram below the signal line, hinting at a potential slowdown in upward momentum over a slightly longer timeframe. This mixed signal between the 1-hour and 4-hour MACD warrants attention. It suggests that while short-term traders might still be seeing buying opportunities, the underlying strength over a slightly longer period could be waning. The Stochastic Oscillator, on both the 1-hour and 4-hour timeframes, is also deeply entrenched in overbought conditions, with %K values exceeding %D and pushing towards extreme levels. This reinforces the notion that the market is becoming overheated.
The DXY Factor: Dollar's Influence on Tech
The Dollar Index (DXY), currently trading at 97.67, plays a crucial, albeit often inverse, role in the Nasdaq's performance. A strengthening dollar typically puts downward pressure on global equities, including the Nasdaq, as it makes US assets more expensive for foreign investors and can signal tighter monetary policy or a flight to safety. Conversely, a weakening dollar can often coincide with a risk-on environment, boosting demand for growth assets like tech stocks. The current slight dip in the DXY, trading at 97.67 with a daily change of -0.3%, might be contributing to the Nasdaq's resilience. However, the underlying trend for the dollar remains a key factor to monitor.
If the DXY were to reverse its current trend and begin a more significant climb, perhaps spurred by renewed inflation concerns or hawkish central bank rhetoric, it could act as a significant headwind for the Nasdaq. The market's sensitivity to interest rate expectations cannot be overstated. Any indication that the Federal Reserve might delay rate cuts or even consider further tightening - perhaps due to persistent inflation, which the elevated oil prices could theoretically exacerbate - would likely see the DXY strengthen and weigh on tech valuations. Therefore, while AI enthusiasm is a strong domestic driver, the global macro backdrop, symbolized by the DXY, remains a critical external influence that could easily shift the market's risk appetite.
Correlations and Cross-Market Dynamics
Understanding the Nasdaq's movement requires looking beyond its own price action and examining its correlations with other major markets. The S&P 500, trading at 6572.87, is showing a strong upward trend on the 1-hour and 4-hour charts, albeit with some divergence on the daily timeframe. The Nasdaq's outperformance, driven by its tech concentration, often leads the broader market. However, a significant downturn in the S&P 500, currently showing a strong daily downtrend with ADX at 47.51, could drag the Nasdaq down with it, despite its sector-specific strengths. The market is currently in a 'risk-on' mood, reflected in both the Nasdaq and S&P 500's gains, but this sentiment can shift rapidly.
Gold prices, currently at $4871.60, have shown a strong upward trajectory, reflecting a complex mix of safe-haven demand and potential inflation hedging. A continued rally in gold, especially if driven by geopolitical uncertainty or rising inflation expectations, could signal a broader shift towards perceived safety, potentially drawing capital away from riskier assets like tech stocks. Conversely, if gold's rise is seen purely as a response to central bank buying or a weakening dollar without accompanying inflation fears, it might not directly impact the Nasdaq's upward bias. The correlation between tech stocks and oil prices is also noteworthy; as oil prices stabilize or fall, it reduces inflation fears, which is generally positive for growth stocks, as seen with WTI at $84.20 and Brent at $89.98.
The 1-Hour Chart: Scalper's Playground, Trader's Caution
For short-term traders and scalpers, the 1-hour chart presents a fascinating, albeit risky, landscape. The ADX at 28.64 indicates a strong trend, and the MACD shows positive momentum. The RSI, while overbought at 77.06, can stay elevated in strong trends. This setup might tempt some to look for continuation trades, perhaps on a minor pullback that tests support levels like $26,593.78. The Stochastic Oscillator, however, is screaming 'overbought,' suggesting that any upward move might be met with immediate selling pressure. For these traders, tight risk management is absolutely essential. A failed breakout above resistance near $26,847.30, coupled with a close back below $26,720.54, could signal a short-term reversal.
The key here is the confluence of signals. While the trend is undeniably up, the extreme readings on the oscillators suggest that the market is stretched. Scalpers might look for quick gains on pullbacks to support, but they must be prepared for the possibility of a sharper, quicker reversal than expected. The presence of strong support levels at $26,593.78 and $26,526.53 offers some psychological backing for buyers, but with the daily RSI already at 75.31, the room for significant further upside without a consolidation or correction seems limited in the immediate term.
The 4-Hour Chart: The Battleground for Trend Confirmation
Moving to the 4-hour chart, the picture becomes even more compelling. The ADX at 53.65 is exceptionally high, confirming a very strong trend. This is the kind of reading that often precedes significant market moves. The RSI at 86.83 is deeply overbought, suggesting that the current upward momentum might be unsustainable without a pause. The MACD shows positive momentum, but the Stochastic Oscillator is also in extreme overbought territory. This suggests that while the trend is strong, the market is potentially ripe for a correction or at least a period of consolidation. The current price of $26,687.10 is pushing against resistance levels that, if broken decisively, could signal a continuation, but the risk of a pullback is significant.
The support levels at $26,313.69 and $26,262.07 become critical if the overbought conditions begin to bite. A break below these levels, especially on increasing volume, would invalidate the immediate bullish outlook and suggest a deeper retracement. The fact that the Nasdaq has managed to push higher despite these overbought conditions speaks to the underlying strength of the AI narrative and broader market sentiment. However, history teaches us that markets rarely move in straight lines indefinitely. The strength indicated by the ADX suggests that any pullback might be a 'buying opportunity' for those with a longer-term view, but short-term traders need to be acutely aware of the reversal risk.
The Daily Chart: Long-Term Perspective and Potential Reversals
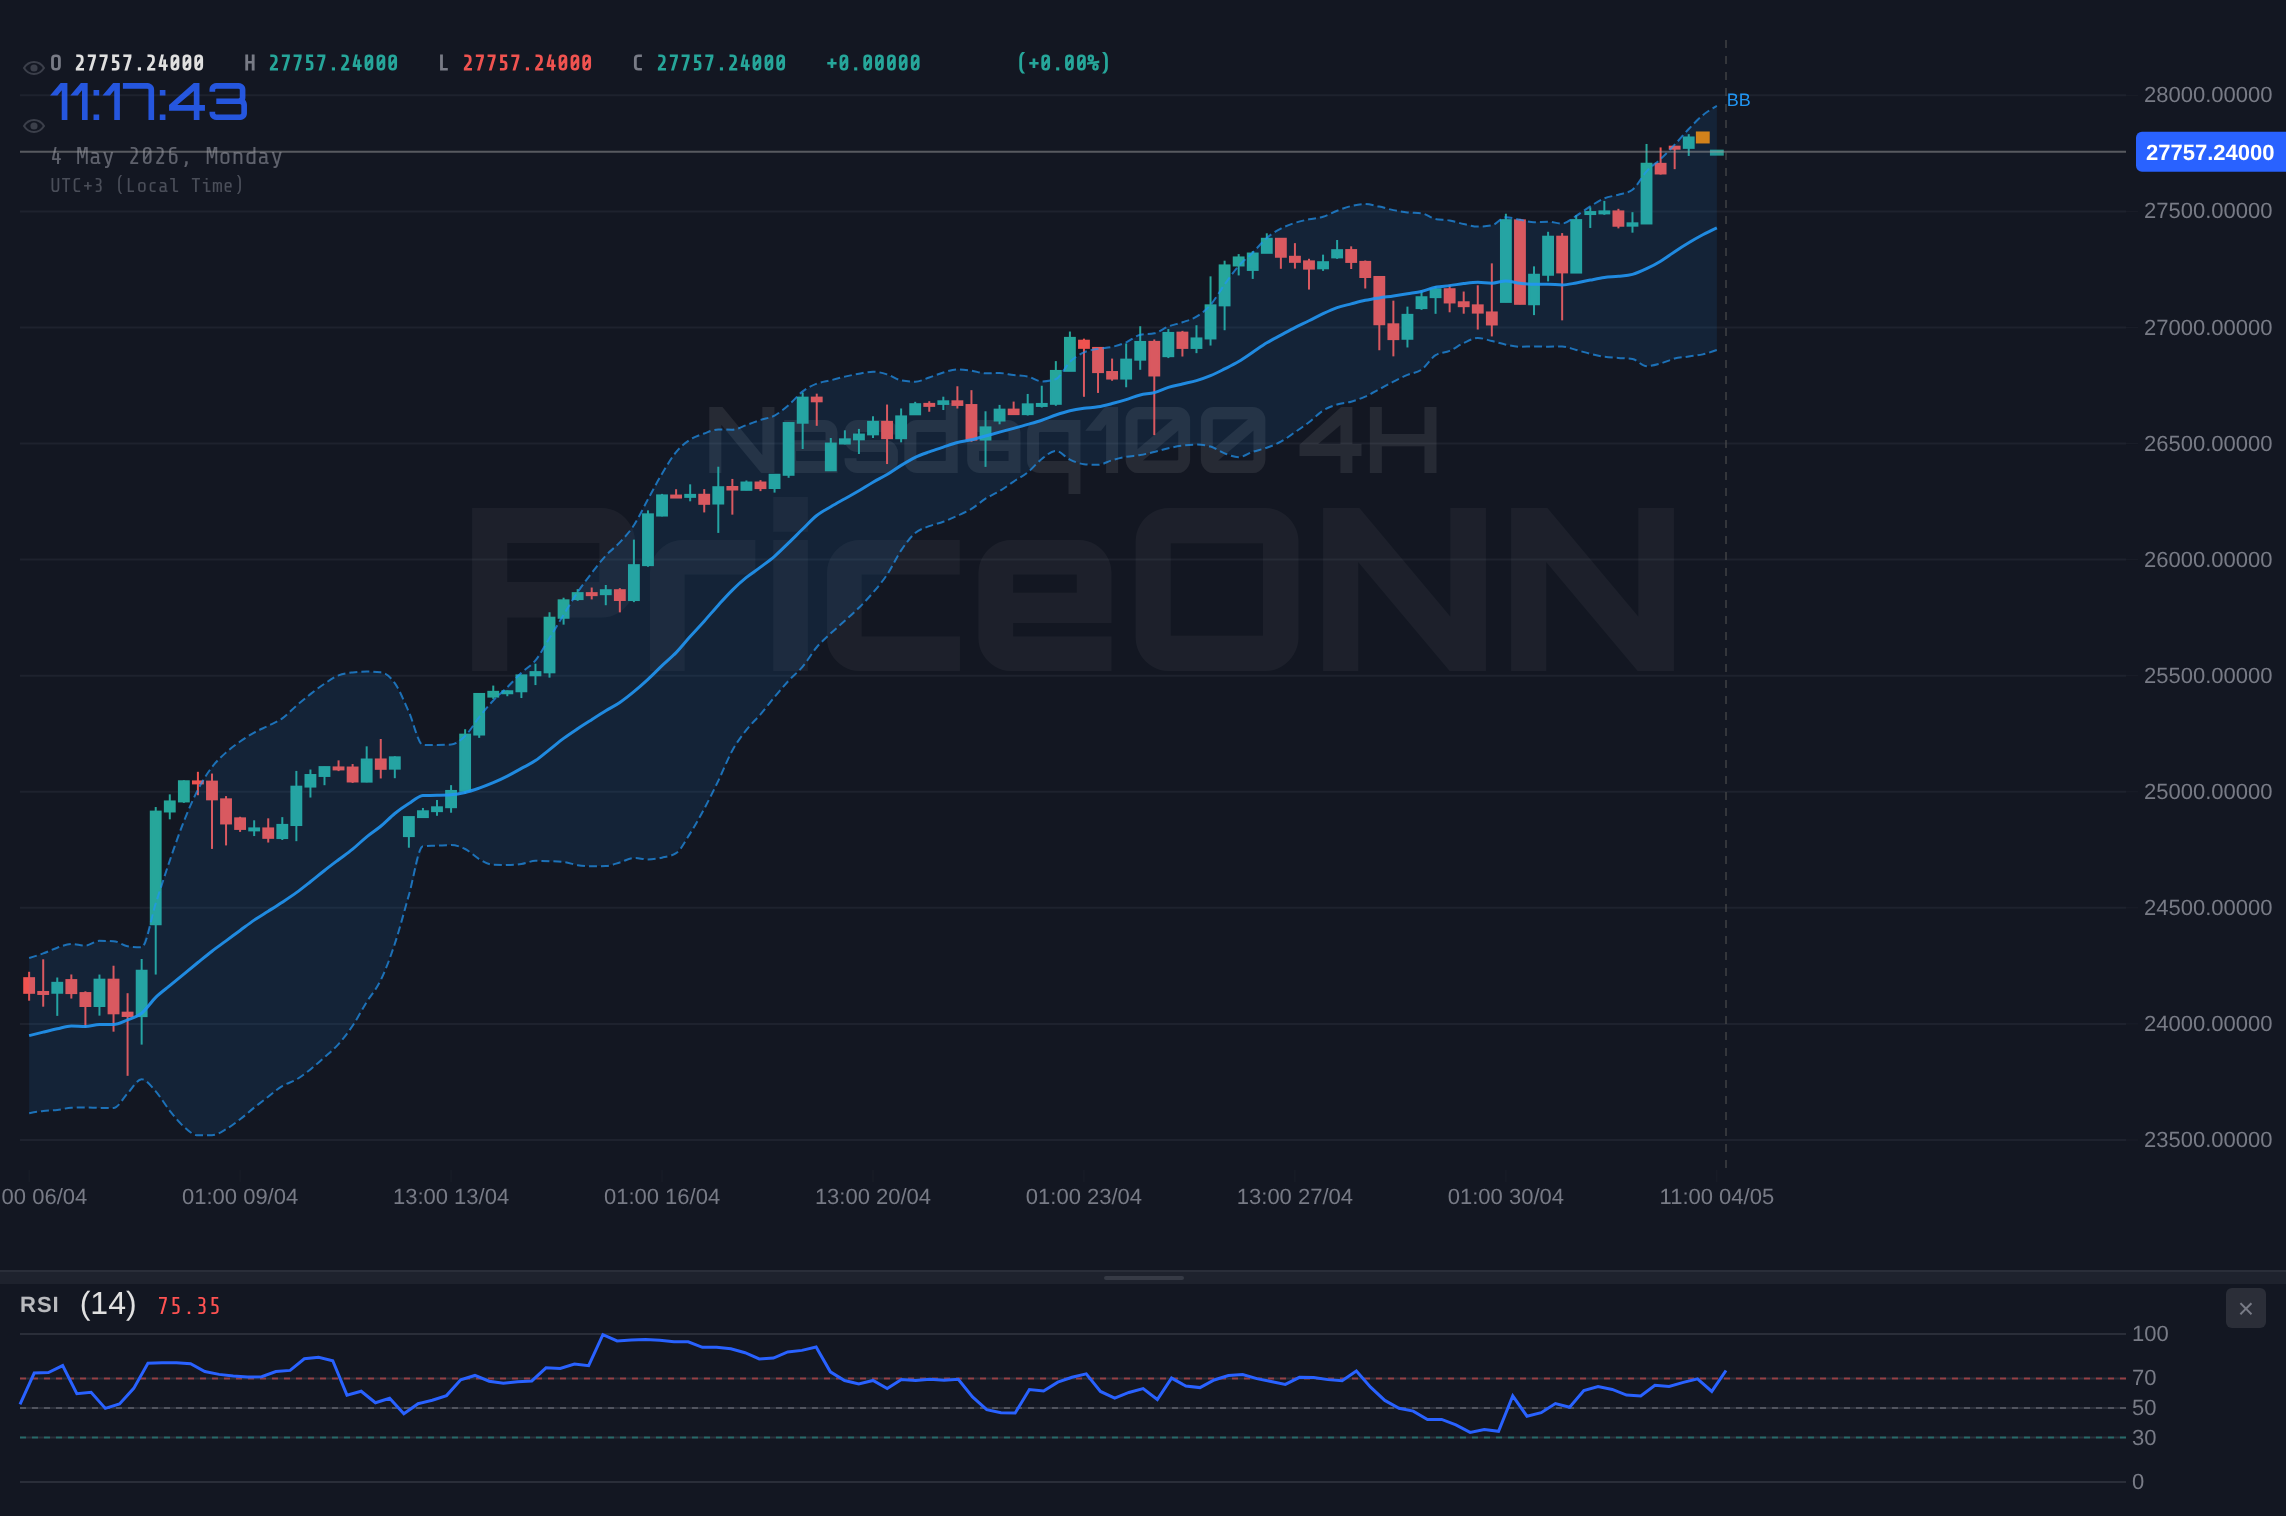
On the daily chart, the Nasdaq Composite's trend is still classified as neutral, with an ADX of 29.84, indicating a moderately strong trend, but not the overwhelming conviction seen on shorter timeframes. The RSI at 75.31 is firmly in overbought territory, and the Stochastic Oscillator is at extreme levels (98.19/98.13). This daily overbought condition is a more significant warning sign. While strong uptrends can sustain elevated RSI levels, the daily chart suggests that the market might be approaching a point where a more substantial correction or consolidation is necessary to reset the oscillators. The MACD shows positive momentum, but the Bollinger Bands are showing the price trading above the upper band, a classic sign of potential overextension.
The support levels on the daily chart, such as $26,144.58 and $25,987.18, become crucial benchmarks. A decisive break below these levels would signal a significant shift in trend and could lead to a much deeper correction. Conversely, if the index can consolidate above $26,500-$26,600 for a few trading sessions, allowing the oscillators to cool down slightly, it could set the stage for a further advance. The current price action is a testament to the power of the AI narrative, but the daily technicals suggest that caution is warranted for longer-term positions, and profit-taking might be advisable for those who have been in the market for a while.
Navigating the Scenarios: What Lies Ahead for Nasdaq100?
Given the conflicting signals - a strong uptrend versus extreme overbought oscillators - multiple scenarios are plausible. The market is clearly in a powerful bullish phase, driven by strong fundamentals like AI growth and supportive macro conditions like easing oil fears. However, the technical indicators are screaming caution. This creates a tension that traders must navigate carefully.
Bearish Scenario: Correction Looms
55% ProbabilityNeutral Scenario: Consolidation Phase
25% ProbabilityBullish Scenario: Momentum Continues
20% ProbabilityFrequently Asked Questions: Nasdaq100 Analysis
What happens if Nasdaq100 breaks below the $26,593.78 support level?
A break below $26,593.78 on increased volume would invalidate the immediate bullish outlook and signal a potential correction. This could lead to a test of the $26,526.53 level, and possibly extend towards $26,467.02 as traders reassess the trend.
Should I buy Nasdaq100 at current levels of $26,687.10 given the RSI at 82.27?
Buying at current levels with an RSI of 82.27 carries significant risk of a short-term pullback. While the trend is strong, the overbought condition suggests that entering now might require extremely tight stop-losses, ideally below $26,593.78. Waiting for consolidation or a pullback to support might offer a better risk-reward ratio.
Is the RSI at 82.27 a sell signal for Nasdaq100 right now?
An RSI of 82.27 is a strong overbought signal, indicating potential exhaustion. While it doesn't automatically mean 'sell,' it strongly suggests caution for new long positions and could precede a consolidation or a sharp reversal if key support levels fail. The ADX at 53.65 suggests the trend is strong, so it might only signal a pause rather than a full reversal.
How will the AI enthusiasm and easing oil fears affect Nasdaq100 this week?
The continued AI enthusiasm provides a fundamental tailwind, potentially driving the Nasdaq higher if new developments emerge. Easing oil fears reduce inflation pressure, supporting a risk-on environment favourable to tech stocks. However, the market's sensitivity to any hawkish Fed signals or renewed inflation worries remains a key risk that could quickly shift sentiment.
The Path Forward: Patience and Precision
The Nasdaq Composite at $26,687.10 presents a classic dilemma: chasing a strong trend in overbought territory versus waiting for a more favorable entry. The ADX on the 4-hour chart at 53.65 is a powerful signal of trend strength, suggesting that dips might be bought aggressively. However, the daily RSI at 75.31 and the extreme readings on the Stochastic oscillators cannot be ignored. For traders, this means a strategy of precision and risk management is paramount. Chasing the rally blindly is a recipe for disaster; waiting for clear signals of continuation or consolidation is the more prudent approach.
The upcoming days will be crucial. A failure to hold above the $26,593.78 support level could trigger a significant sell-off, targeting lower levels. Conversely, a sustained move and close above $26,847.30 could extend the rally, though the overbought conditions suggest that such a move might be met with profit-taking relatively quickly. For now, the market is leaning bullish due to the overwhelming AI narrative, but the technicals are whispering caution. The best approach is to monitor key levels, respect the overbought signals, and avoid chasing price. Patience will likely be rewarded as the market either confirms its strength or initiates a much-needed correction.
Track markets in real-time
AI-powered analysis, technical indicators and real-time price data.
Join Our Telegram Channel
Breaking market news, AI analysis and trading signals instantly.
Join Channel