
Dolar Endeksi 97.90'da Tutunuyor: Risk İştahı Değişirken Kritik Veriler Yaklaşıyor
Dolar Endeksi (DXY) 97.90 civarında konsolide oluyor. Önemli ekonomik veri açıklamaları ve merkez bankası yorumları ufukta belirmesiyle, piyasa katılımcıları potansiyel volatiliteyi izliyor.
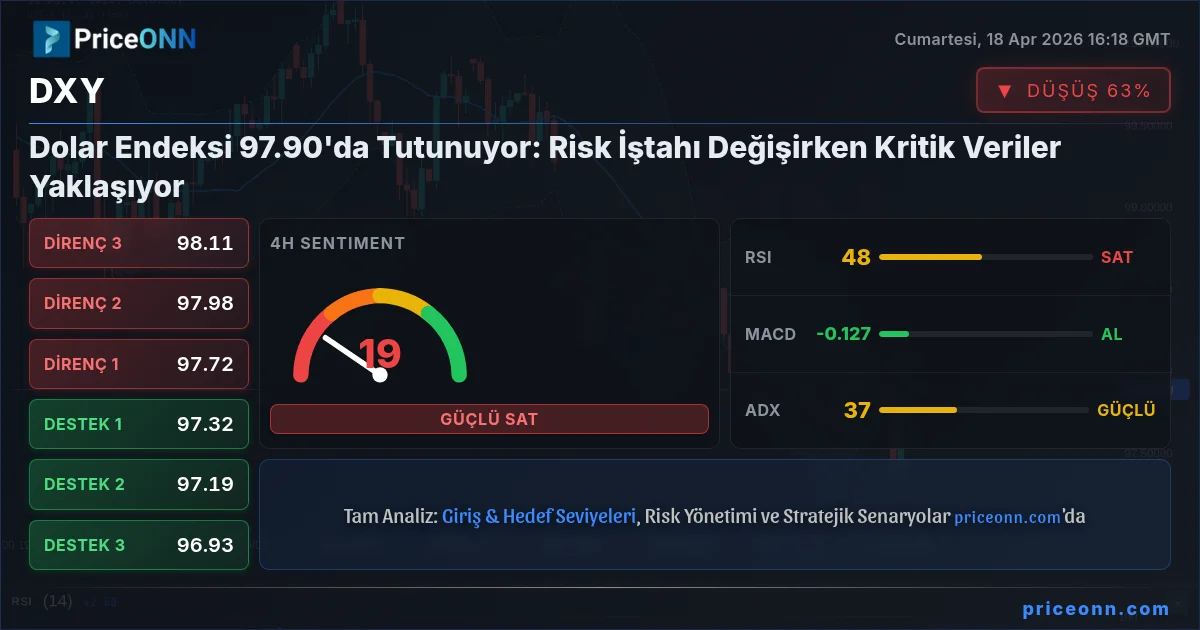
Dolar Endeksi (DXY), yatırımcıların kritik bir haftaya hazırlandığı bu dönemde 97.90 seviyesinin etrafında hassas bir zemin buldu. Geçen Cuma günkü kapanış, endeksin bu kritik psikolojik seviyenin yakınında seyrettiğini gösterdi; bu seviye son işlem seanslarında hem bir mücadele alanı hem de bir pivot noktası olarak işlev gördü. Mevcut fiyat hareketleri konsolidasyona işaret etse de, piyasa duyarlılığının altında yatan akıntılar ve yaklaşan ekonomik katalizörler potansiyel bir değişim sinyali veriyor. Herkesin aklındaki soru şu: 97.90, doların daha fazla güçlenmesi için bir sıçrama tahtası olarak kalacak mı, yoksa özellikle küresel risk iştahı dalgalanma belirtileri gösterirken artan baskı altında mı kalacak? Bu analiz, DXY'nin önümüzdeki günlerdeki seyrini şekillendiren teknik temelleri ve temel sürücüleri inceliyor.
- DXY şu anda kritik bir pivot noktası olan 97.90 seviyesi etrafında konsolide oluyor.
- 1 saatlik grafikte RSI 56.83 seviyesinde yukarı yönlü momentumu gösteriyor, ancak DXY 4 saatlik ortalamanın 47.84 altında seyrediyor, bu da çelişkili sinyallere işaret ediyor.
- DXY için önemli destek 97.51'de, direnç ise saatlik grafikte 97.84'te sınırlı.
- Yaklaşan ABD Perakende Satışlar verisi ve Fed yorumları, doların bir sonraki hamlesini belirlemede kritik olacak.
Geçen hafta DXY yatırımcıları için dikkatli bekleme dönemi oldu. Bir volatilite döneminin ardından endeks dar bir aralığa yerleşti ve 97.90 bu seviye bir mıknatıs görevi gördü. Bu konsolidasyon aşaması, piyasaların son ekonomik verileri sindirmesi ve gelecekteki politika değişimlerini beklemesiyle tipik bir durumdur. 1 saatlik grafikte RSI 56.83 civarında seyrediyor, bu da hafif yukarı yönlü bir eğilime işaret ediyor, ancak bu durum 4 saatlik RSI'ın 47.84 seviyesinde daha nötr veya hatta hafif düşüş eğilimli bir alt tonu göstermesiyle çelişiyor. Bu ayrışma, piyasada mevcut olan kararsızlığı vurguluyor. Saatlik zaman dilimindeki ADX 22.12 seviyesinde bulunuyor ve orta düzeyde bir trend ortamına işaret ediyor, ancak güçlü bir yönlü kararlılığın olmaması, herhangi bir önemli katalizörün her iki yönde de keskin bir hareketi tetikleyebileceği anlamına geliyor. Yatırımcılar, kendi içinde dalgalı bir seyir gösteren doların performansı ile küresel risk duyarlılığı arasındaki etkileşimi yakından izliyor.
Doların Mevcut Durumunda Yol Bulmak
Dolar Endeksi (DXY) şu anda karmaşık bir teknik manzara içinde yol alıyor ve fiyatı 97.90 seviyesinin etrafında seyrediyor. Bu seviye, son fiyat hareketlerinin ve psikolojik önemin birleşimiyle önemli bir noktayı temsil ediyor. 1 saatlik zaman diliminde trend genel olarak nötr; ADX 22.12 ile güçlü bir yönlü momentum eksikliğine işaret ediyor. Ancak, 56.83'teki RSI, altta yatan yükseliş baskısını ima ederken, 71.98'deki Stokastik Osilatör'ün K değeri, 37.54'lük D değerinin üzerinde olması, bu yukarı yönlü hareket potansiyelini güçlendiriyor. Ancak hikayenin tamamı bu değil. 4 saatlik grafiğe geçildiğinde tablo daha belirsiz hale geliyor. Buradaki ADX, 37.19 ile güçlü bir düşüş trendini gösteriyor ve bu da saatlik sinyallerle doğrudan çelişiyor. RSI 47.84'te düşüş eğilimli ve Stokastik, K 48.11 ve D 73.04 ile düşüş yönlü bir çaprazlama gösteriyor. Zaman dilimleri arasındaki bu çelişki, mevcut kararsızlığı ve 97.90 etrafındaki fiyat hareketlerinin kritik doğasını vurguluyor. Piyasa temelde bir çıkmazda, durumu netleştirecek kesin bir katalizör bekliyor.
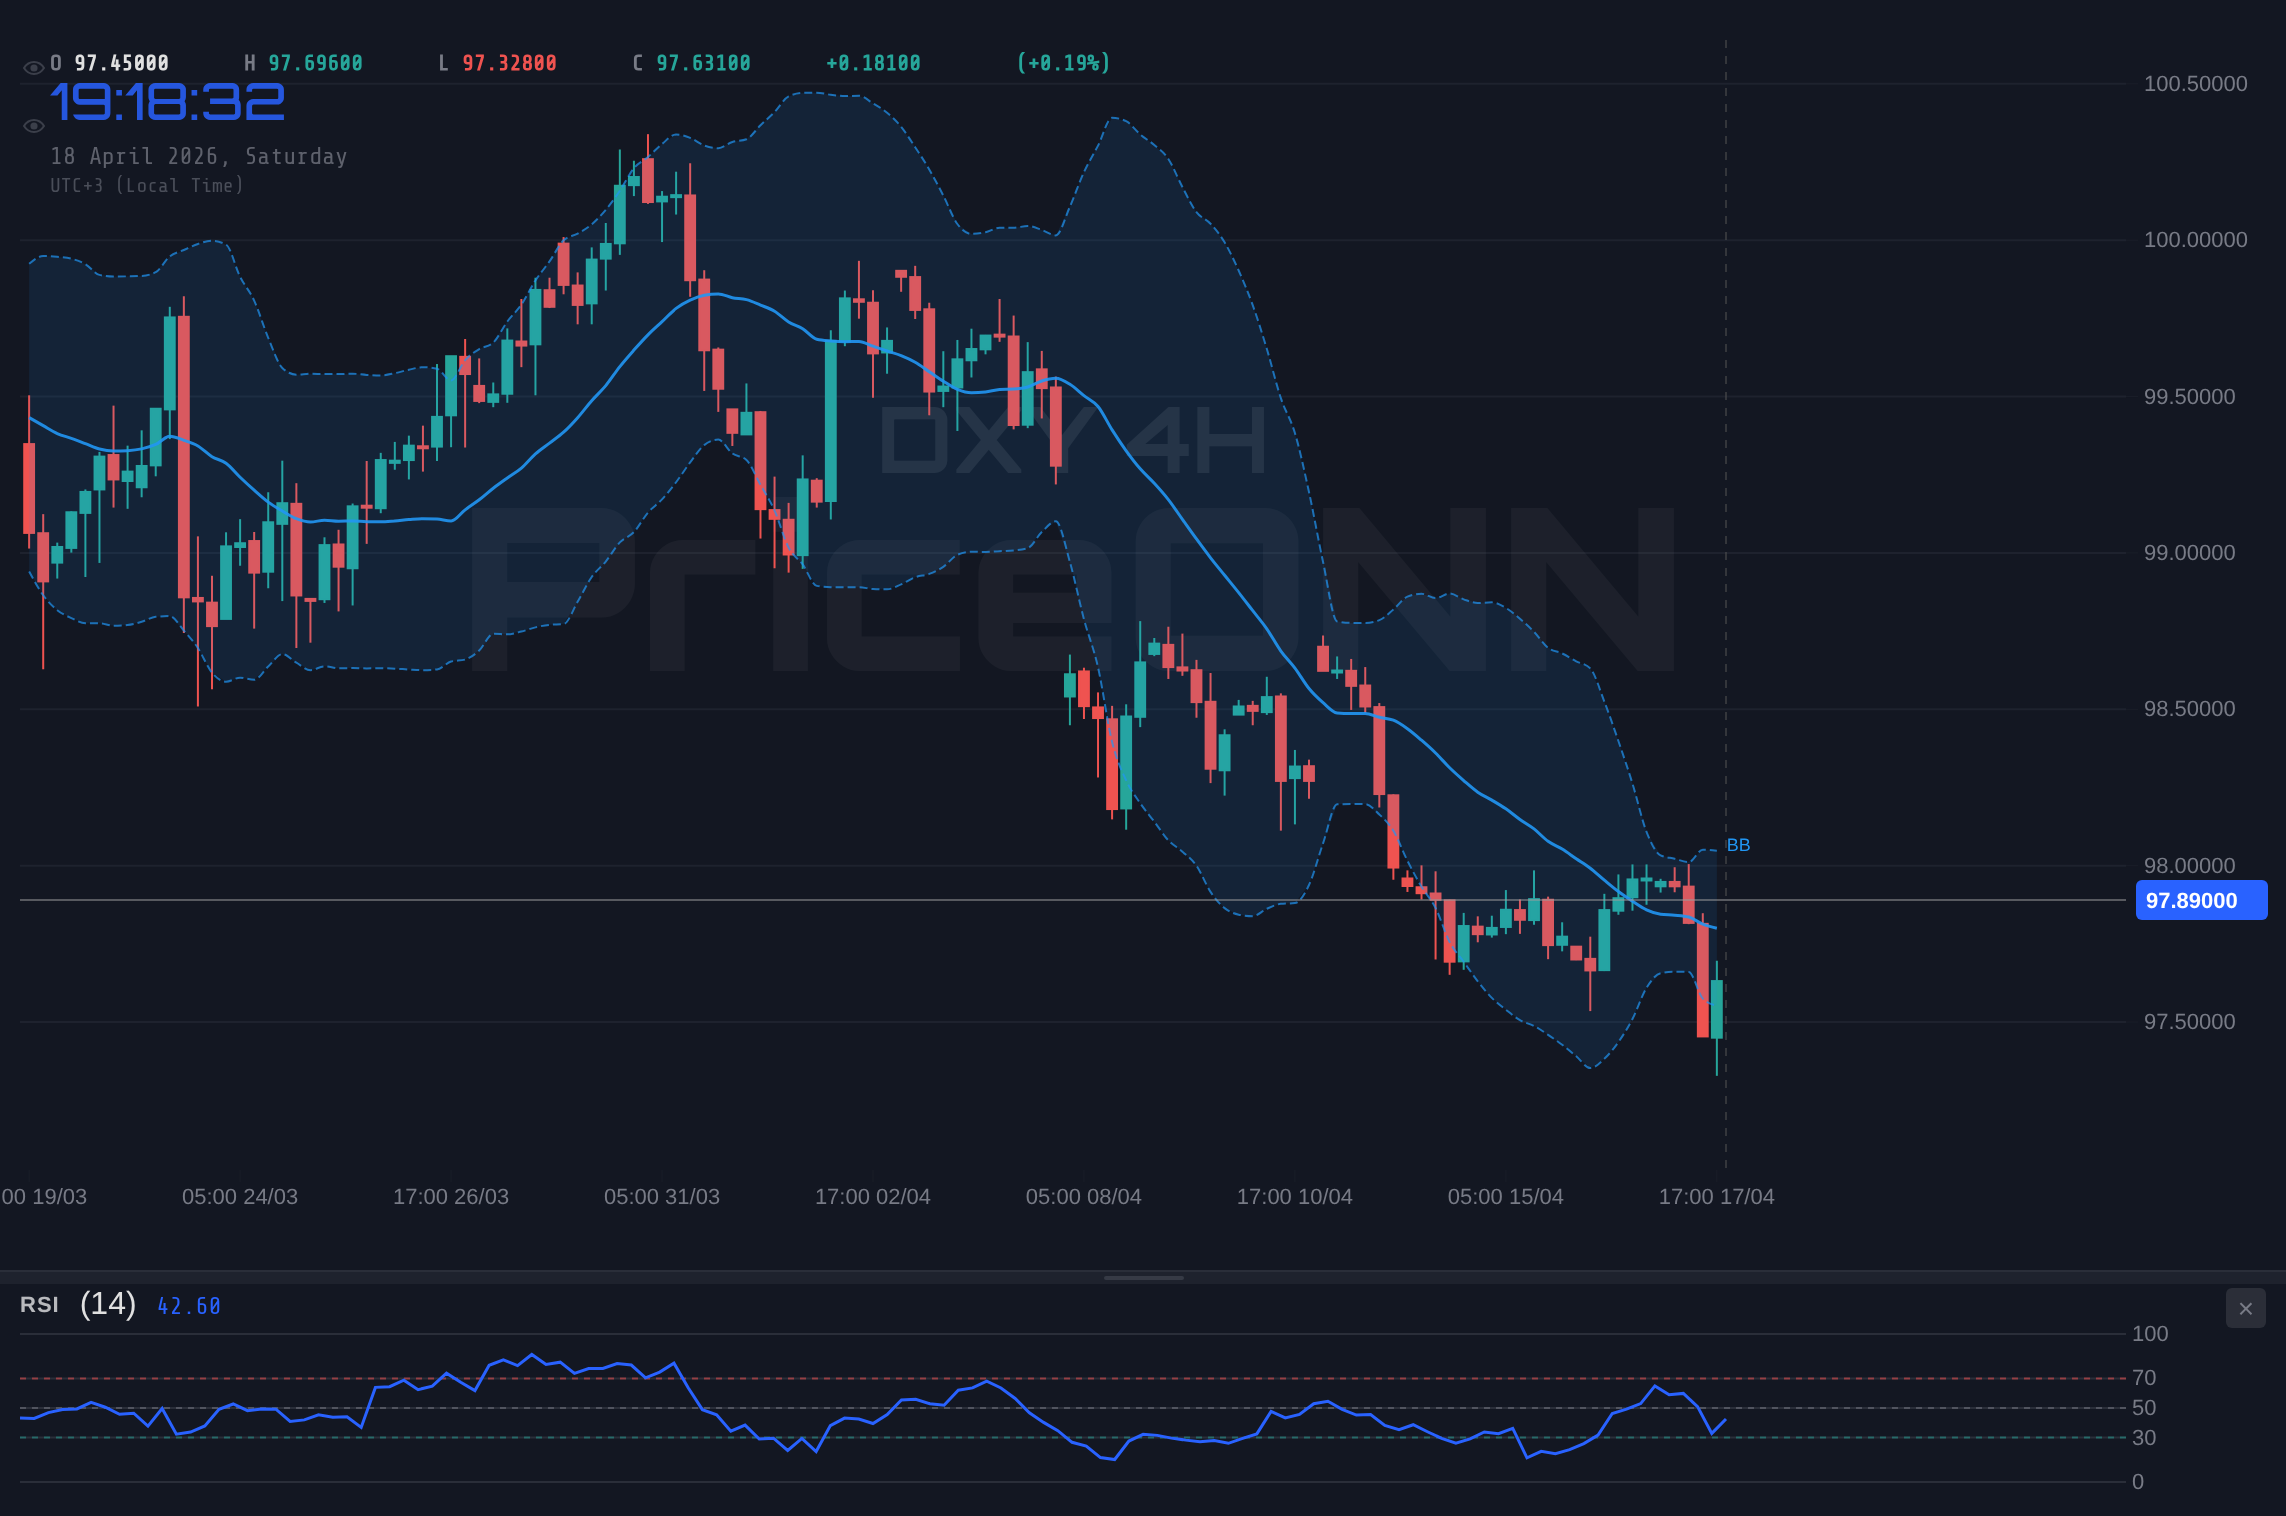
Günlük grafik bu karmaşık analize başka bir katman ekliyor. Burada DXY, 26.2'lik ADX okumasıyla desteklenen düşüş eğilimi sergiliyor ve bu da güçlü bir düşüş hareketine işaret ediyor. RSI 40.62 ile kesinlikle düşüş bölgesinde ve MACD, sinyal çizgisinin altına geçmiş durumda, bu da düşüş momentumunu daha da teyit ediyor. Stokastik Osilatör, K 15.25 ve D 9.38 ile aşırı satım bölgesinde derinleşmiş durumda; bu durum potansiyel bir yükselişin yakın olduğunu gösterebilir, ancak genel trend görünümü kesinlikle düşüş eğilimli kalıyor. Bu çoklu zaman dilimi çelişkisi, 97.90'ı bu kadar kritik yapan şeydir. Saatlik direnç olan 97.84'ün ve daha önemlisi, düşüş trendinde şu anda tavan görevi gören 4 saatlik direnç olan 97.72'nin üzerinde bir kırılma, yükseliş yönlü bir dönüşü düşünmek için bile gereklidir. Buna karşılık, saatlik destek olan 97.51'i tutamamak, günlük ve 4 saatlik grafiklerin gösterdiği düşüş trendini hızlandırabilir.
Makroekonomik Verilerin Etkisi
DXY'nin fiyat hareketi, ABD ekonomisinin nabzıyla ayrılmaz bir şekilde bağlantılı ve bu hafta doların kaderini önemli ölçüde etkileyebilecek verilerle dolu. Yaklaşan ABD Perakende Satışlar rakamları özellikle kritik. Analistler, büyük ölçüde devam eden bir endişe kaynağı olan artan benzin fiyatlarından kaynaklanan bir ana artış öngörüyor. %2.1'lik tahmine karşılık %-0.913'lük gerçekleşen rakam, tüketici harcamalarının beklenenden daha zayıf olduğunu gösteren önemli bir sapma olacaktır. Böyle bir sonuç, daha yumuşak ekonomik koşullar ve Federal Rezerv'den potansiyel olarak daha az şahin bir duruş anlamına geldiği için tipik olarak doları zayıflatacaktır. Tersine, beklenenden daha güçlü bir okuma, doları destekleyebilir ve devam eden ekonomik dayanıklılık ve Fed'in mevcut politika yoluna bağlı kalma veya enflasyonist baskılar devam ederse sıkılaştırmaya yönelme beklentilerini güçlendirebilir.
ABD Perakende Satışlar raporunun sonuçları, sadece fiyat hareketlerinin ötesine geçiyor; faiz oranı beklentilerini doğrudan etkiliyor. Verilerin hayal kırıklığı yaratması, piyasaların faiz oranlarının erken indirilme olasılığını daha fazla fiyatlamasına neden olabilir ve bu da dolara aşağı yönlü baskı uygulayabilir. Önceki %3.081'lik rakam, bu veri serisindeki volatiliteyi vurguluyor. Öte yandan, yüksek benzin fiyatlarına rağmen güçlü bir satış rakamı, ABD ekonomisinin daha yüksek maliyetlere dayanabilecek güçte olduğu anlatısını pekiştirebilir ve dolara destek sağlayabilir. Bu yaklaşan veri noktası sadece bir rakam değil; DXY'nin yönünü ve dolayısıyla Federal Rezerv'in bir sonraki hamlesini çözmeye çalışan yatırımcılar için bulmacanın önemli bir parçasıdır.
Perakende satışların ötesinde, yakın zamanda açıklanan diğer ekonomik göstergeler karışık bir tablo çiziyor. Bazı ekonomik göstergeler için %0.1'lik tahmine karşılık %0.5'lik GBP rakamı, İngiltere ekonomisinde potansiyel bir güce işaret ediyor; bu da EUR/GBP dinamiklerini ve çapraz döviz akışlarını etkileyerek dolaylı olarak DXY'yi etkileyebilir. %2.5'lik tahmine karşılık %2.6'lık Euro Bölgesi verileri, Euro Bölgesi için hafif bir yükseliş gösteriyor ve bu da EUR/USD'ye bir miktar destek sağlayarak DXY üzerinde bir baskı unsuru olabilir. Başka bir metrik için 10.3'lük tahmine karşılık 26.7'lik ABD verileri, belirli sektörlerde beklenenden daha güçlü bir aktiviteye işaret ediyor, ancak artan benzin fiyatlarının bağlamı ve genel tüketici harcamaları resmi hala çok önemli. Diğer ABD göstergeleri için önceki %0.6 ve %0.5'lik rakamlar, tahmini olmadan, istikrarlı ancak heyecan verici olmayan bir performansa işaret ediyor.
Merkez Bankası Gözlemcileri: Fed'in Bir Sonraki Hamlesi
Federal Rezerv, dolar odaklı piyasa katılımcıları için odak noktası olmaya devam ediyor. Fed son zamanlarda istikrarlı bir duruş sergilese de, ekonomik veri akışı gelecekteki politika yolunu belirliyor. Piyasa, potansiyel faiz oranı ayarlamalarının zamanlaması ve büyüklüğü hakkında ipuçları için Fed yetkililerinden gelen her sözü ve her ekonomik veriyi sürekli olarak analiz ediyor. Şu anda, vadeli işlem piyasasındaki fiyatlama, yatırımcıların faiz artırımı olasılığını yılın ilerleyen dönemlerindeki potansiyel kesintilerle tartmasıyla hassas bir dengeyi yansıtıyor. Şaşırtıcı derecede zayıf bir istihdam raporu veya Perakende Satışlar'daki potansiyel bir sapma gibi tüketici harcamalarındaki önemli bir düşüş, daha güvercin bir duruşun olasılığını artırarak DXY üzerinde baskı oluşturabilir.
Buna karşılık, gördüğümüz yüksek petrol fiyatlarının ve bunların tüketici mallarına etkilerinin körüklediği kalıcı enflasyon, Fed'i şahin söylemini sürdürmeye veya hatta daha fazla sıkılaştırmayı düşünmeye sevk edebilir. Bu şüphesiz dolar için önemli bir destekleyici rüzgar sağlayacaktır. Fed yetkililerinden gelecek yorumlar, bu hassas dengedeki bir değişim ipucu için titizlikle incelenecektir. Reuters gibi kaynaklardan gelen son raporlarda bazı analistlerin belirttiği gibi enflasyonun 'inatçı' kaldığına dair herhangi bir işaret, daha uzun süre yüksek faiz oranları tezini sağlamlaştırabilir ve doları destekleyebilir. Bu açıklamalara piyasanın tepkisi ve bunların Hazine getirilerine nasıl yansıdığı, DXY'nin yolu için kilit bir belirleyici olacaktır. Mevcut getiri ortamı, yüksek olmasına rağmen, gelişen enflasyon beklentileri ve Fed politika sinyalleri bağlamında görülmelidir.
Küresel Risk Duyarlılığı ve Dolar Korelasyonu
DXY'nin performansı aynı zamanda küresel risk iştahından da büyük ölçüde etkileniyor. Piyasalar korku ve belirsizlikle boğuştuğunda, yatırımcılar ABD dolarının algılanan güvenli limanına akın etme eğilimindedir ve bu da DXY'yi yukarı çeker. Tersine, iyimserlik ve güçlü risk iştahı dönemlerinde yatırımcılar genellikle daha yüksek getirili, daha riskli varlıklara sermaye kaydırırlar, bu da dolara baskı uygulayabilir. Bu hafta karışık sinyaller gördük. S&P 500 ve Nasdaq 100 gibi büyük ABD endeksleri zaman zaman kazançlar elde ederek dayanıklılık gösterse de, duyarlılığı hızla değiştirebilecek temel endişeler var. Örneğin, petrol fiyatı hala önemli bir gösterge. Son düşüşe rağmen, WTI ham petrol hala yılın başındaki seviyelerin oldukça üzerinde, varil başına 86 doların üzerinde işlem görüyor. Bu yüksek enerji maliyeti, küresel büyümeyi olumsuz etkiliyor ve enflasyon korkularını körükleyebilir, bu da dolar gibi güvenli liman varlıklarına olan talebi artırabilir. Hürmüz Boğazı'nın yeniden açılmasıyla ilgili haberler, başlangıçta petrol fiyatlarında bir düşüşe neden olsa da, risk duyarlılığını hızla değiştirebilecek jeopolitik kırılganlığı vurguluyor.
DXY ve risk varlıkları arasındaki korelasyon her zaman doğrudan değildir. Bazen güçlü bir ABD ekonomisi hem risk varlıklarını hem de doları destekleyebilir. Ancak, küresel stres dönemlerinde dolar genellikle birincil güvenli liman olarak hareket eder. Jeopolitik gerilimlerin kaynadığı ve enflasyonun bir endişe kaynağı olmaya devam ettiği mevcut durum, risk duyarlılığında ani bir değişim durumunda doların hızla değer kazanabileceği bir ortam yaratıyor. S&P 500'ün, son kazançlarına rağmen, 1 saatlik grafiğinde aşırı alım koşulları belirtileri göstermesi (RSI 70.95) ve Nasdaq 100'ün de aşırı aşırı alım bölgesinde işlem görmesi (4H'de RSI 72.58 ve 86.86), hisse senetlerinde bir düzeltmenin ufukta olabileceğini düşündürüyor. Böyle bir düzeltme, yatırımcılar yeşil banknotun göreceli güvenliğini aradıkça, DXY'nin güçlenmesiyle aynı zamana denk gelebilir. Bu risk varlıkları ile dolar endeksi arasındaki etkileşim izlenmesi gereken önemli bir tema olacaktır.
İzlenmesi Gereken Teknik Seviyeler: 97.90 Kavgası
DXY için teknik tablo şu anda 97.90 seviyesi etrafında yoğunlaşıyor. 1 saatlik grafikte, acil destek 97.62'de, ardından 97.57 ve 97.51'de bulunuyor. Bu seviyelerin altında kesin bir kırılma, potansiyel bir kısa vadeli düşüş hareketini sinyalleyecektir. Buna karşılık, direnç 97.73, 97.79 ve 97.84'te görülüyor. Bu seviyelerin, özellikle 97.84'ün temizlenmesi, daha yüksek rakamlara meydan okuma yolundaki ilk adım olacaktır. Ancak, daha geniş bağlamı sağlayan 4 saatlik ve günlük grafiklerdir. 4 saatlik grafik, 97.32, 97.19 ve 97.93'te destek ile net bir düşüş trendi gösteriyor. Bu zaman dilimindeki direnç 97.72, 97.98 ve 98.11 civarında sınırlı. Günlük grafik, 97.66, 97.36 ve 97.19'da destek ve 98.13, 98.30 ve 98.60'ta direnç ile düşüş eğilimini pekiştiriyor. Mevcut 97.90 fiyatı, bu çoklu zaman dilimi seviyeleri arasında tehlikeli bir şekilde yer alıyor ve onu kritik bir savaş alanı haline getiriyor.
4 saatlik direnç olan 97.72 ve ardından 97.98'i temizleyerek 97.90'ın üzerinde sürdürülebilir bir hareket, daha yüksek zaman dilimlerindeki mevcut düşüş anlatısına meydan okumaya başlayacaktır. Bu, güçlü ekonomik veriler veya şahin Fed sinyalleriyle desteklenen önemli bir alım baskısı gerektirecektir. Buna karşılık, 97.90'ı tutamamak ve ardından 1 saatlik destek olan 97.51'in altına düşmek, muhtemelen 4 saatlik destek seviyelerini hedefleyerek aşağı yönlü hareketi hızlandıracaktır. ADX okumaları, bir yön belirlendikten sonra önemli hareketler için potansiyeli vurguluyor; saatlik ADX 22.12 ılımlı, ancak 4 saatlik ADX 37.19 ve günlük ADX 26.2, trendler oluştuktan sonra oldukça güçlü olabileceğini gösteriyor. Ancak mevcut kararsızlık, yatırımcıların bir pozisyona girmeden önce net onay beklemeleri ve ihtiyatlı davranmaları gerektiği anlamına geliyor.
Gelecek Hafta: Katalizörler ve Beklentiler
İleriye baktığımızda, ekonomik takvim DXY'nin potansiyel hareketlerinin birincil itici gücü olacak. Kritik ABD Perakende Satışlar verileri açıklanacak ve belirtildiği gibi, önemli bir sapma doları baskı altına alabilir. Bu, Federal Rezerv yetkililerinden gelen yorumlarla yakından takip ediliyor. Faiz oranlarının gelecekteki yolu hakkında herhangi bir ipucu - Fed mevcut duruşunda kararlı mı kalacak, bir pivot sinyali mi verecek yoksa daha fazla sıkılaştırmayı mı tartışacak - kritik olacaktır. Piyasa katılımcıları, oran beklentilerini değiştirebilecek nüanslar için bu ifadeleri inceleyecekler. Küresel risk duyarlılığı ile olan korelasyon da ana tema olmaya devam edecek. Hisse senedi piyasaları, enflasyon korkuları veya jeopolitik manşetler tarafından yönlendirilen önemli bir düşüş yaşarsa, yurt içi ekonomik verilerden bağımsız olarak dolar, güvenli liman varlığı olarak güç bulabilir.
Bu faktörlerin etkileşimi karmaşık bir ticaret ortamı yaratıyor. DXY, farklı zaman dilimlerindeki çelişkili teknik sinyaller ve veri odaklı bir merkez bankası politika görünümü arasında sıkışmış durumda. 97.90 seviyesi mevcut savaş alanını temsil ediyor, ancak gerçek yön muhtemelen yaklaşan ekonomik açıklama ve merkez bankası iletişiminin birleşimi tarafından belirlenecektir. Yatırımcıların çevik olmaları, pozisyonlara girmeden önce yönlü bir eğilimin onayını aramaları gerekecek. Özellikle ekonomik veriler beklentilerden önemli ölçüde saparsa veya Fed yetkilileri beklenmedik rehberlik sağlarsa, volatilite potansiyeli yüksektir. Piyasanın bu olaylara duyarlılığı, kilit katalizörler ortaya çıktığında DXY'nin keskin hareketler yaşayabileceğini gösteriyor.
Düşüş Senaryosu: Dolar Baskı Altında
65% OlasılıkKonsolidasyon Senaryosu: Yatay Seyir
25% OlasılıkYükseliş Senaryosu: Dolar Gücü Geri Dönüyor
10% OlasılıkSıkça Sorulan Sorular: DXY Analizi
ABD Perakende Satışlar beklentilerin altında kalarak %2.1'lik tahmini aşamazsa ne olur?
ABD Perakende Satışlar'da %2.1'lik tahmine yakın veya -0.913%'lük gerçekleşen rakama daha yakın önemli bir sapma, DXY'yi muhtemelen zayıflatacaktır. Bu sonuç, tüketici harcamalarının daha zayıf olduğunu gösteriyor ve bu da piyasaların Federal Rezerv faiz indirimlerinin daha yüksek olasılığını fiyatlamasına neden olabilir, bu da 97.51 destek seviyesi civarında dolar endeksi üzerinde aşağı yönlü baskı oluşturur.
Mevcut 97.90 seviyesinde, çelişkili teknik sinyaller göz önüne alındığında DXY almak mantıklı mı?
Çelişkili zaman dilimi sinyalleri nedeniyle 97.90'da DXY almak dikkat gerektirir. 1 saatlik grafik yükseliş momentumunu (RSI 56.83) gösterirken, 4 saatlik ve günlük grafikler düşüş eğiliminde. Yükseliş görünümü için 4 saatlik direnç 97.72 ve ideal olarak 97.98'in üzerinde bir onay gerekir, aksi takdirde 97.51 desteğine doğru bir hareket riski yüksektir.
4 saatlik grafikteki 47.84 RSI değeri DXY için güçlü bir satış sinyali midir?
4 saatlik grafikte 47.84 RSI değeri genellikle düşüş sinyali olarak kabul edilir ve bu zaman diliminde momentumun alıcılardan yana güçlü olmadığını gösterir. Tek başına kesin bir satış sinyali olmasa da, günlük grafiğin işaret ettiği daha geniş düşüş trendiyle uyumludur ve yükseliş hareketlerinin dirençle karşılaşabileceğini, potansiyel olarak daha düşük destek seviyelerinin test edilmesine yol açabileceğini düşündürmektedir.
Bu hafta Fed yetkililerinden gelecek yorumlar 97.90 civarındaki DXY'yi nasıl etkiler?
Fed yetkililerinden faiz oranı politikasında bir değişim sinyali veren herhangi bir yorum, 97.90'daki DXY için kritik olacaktır. Enflasyon endişelerini veya gecikmiş bir pivotu ima eden şahin açıklamalar doları destekleyebilir ve potansiyel olarak 97.98 direncini aşmasına neden olabilir. Buna karşılık, güvercin sinyaller veya ekonomik zayıflığın kabulü, piyasaların daha erken faiz indirimlerini fiyatlamasıyla 97.51 desteğinin kırılmasına neden olabilir.
Teknik Görünüm Özeti
| Gösterge | Değer | Sinyal | Yorum |
|---|---|---|---|
| RSI (14) | 56.83 | Nötr | 1H'de yukarı yönlü momentumu gösteriyor, ancak 4H'de düşüş eğilimli. |
| MACD Histogramı | -0.06 | Düşüş | Negatif momentum günlük grafikteki düşüş trendini teyit ediyor. |
| Stokastik | K:48.11, D:73.04 | Düşüş Çaprazı | 4H grafikteki düşüş eğilimini teyit ediyor. |
| ADX | 37.19 | Güçlü Trend | 4H'de güçlü bir düşüş trendini gösteriyor. |
| Bollinger Bantları | Orta Bant | İzleniyor | Fiyatın orta bandın etrafında seyretmesi konsolidasyona işaret ediyor. |
Anahtar Seviyeler
Destek Seviyeleri
Direnç Seviyeleri
Piyasaları canlı takip edin
AI destekli analizler, teknik göstergeler ve anlık fiyat verileri.
Telegram Kanalımıza Katılın
Son dakika piyasa haberleri, AI analizleri ve trading sinyalleri.
Kanala Katıl