
USDJPY 158.89 Direncini Zorluyor: Petrol Fiyatları ve Teknik Sinyaller
USDJPY, petrol fiyatlarındaki yükselişle birlikte 158.89 direncine yaklaşıyor. Teknik göstergeler güçlü bir trende işaret etse de, çelişkili sinyaller dikkatli olmayı gerektiriyor. Detaylı analiz ve senaryoları inceleyin.
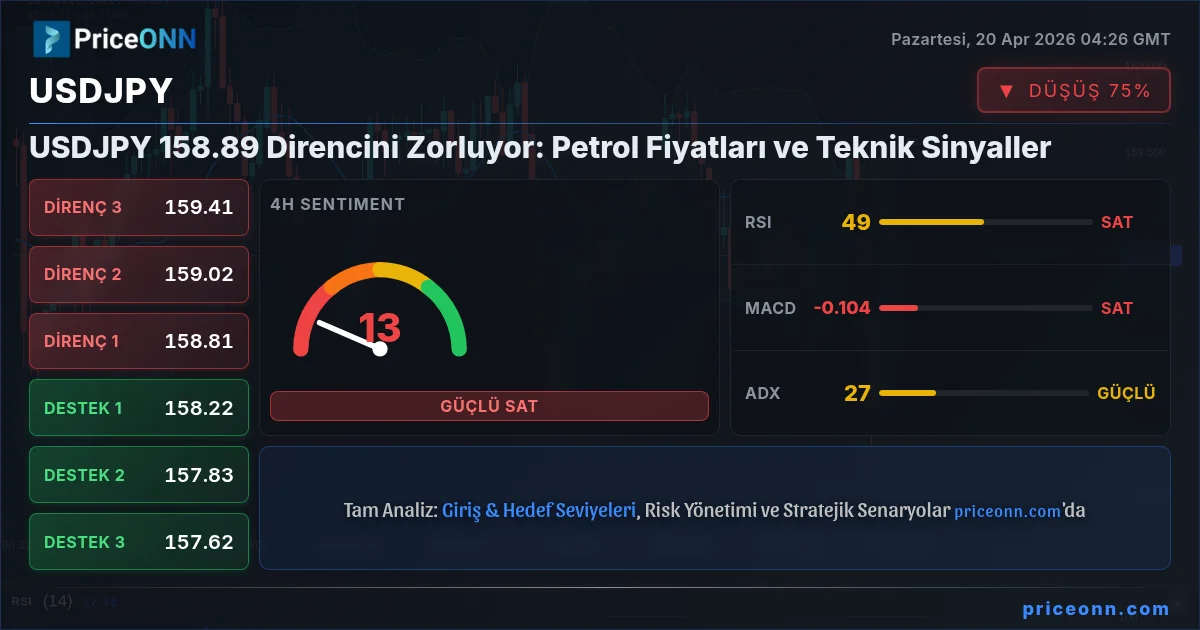
USDJPY, önemli bir direnç seviyesi yakınında, 158.89 seviyesinden işlem görüyor. Bu fiyat hareketi, Brent petrolünün 96.51 dolara yükselmesiyle dalgalı bir emtia piyasası zemininde gerçekleşiyor. Japon Yeni'nin güvenli liman çekiciliği, Dolar'ın gücü ve enerji fiyatlarındaki şokların etkileşimi karmaşık bir ticaret ortamı yaratıyor. Bu analiz, USDJPY'nin teknik inceliklerine odaklanarak, çoklu zaman dilimlerindeki gösterge sinyallerini, kritik destek ve direnç seviyelerini ve makroekonomik dinamiklerin potansiyel etkisini inceliyor. Bu kritik dönemeçte yön bulmaya çalışan yatırımcılara net bir yol haritası sunmayı amaçlıyoruz.
- USDJPY, 1 saatlik grafikte 27.33'lük güçlü ADX değeriyle 158.89 direnci civarında işlem görüyor ve bu da tanımlanmış bir trende işaret ediyor.
- USDJPY için kritik destekler 158.805 (1S) ve 158.217 (4S) seviyelerinde belirlenirken, anlık direnç 158.927 (1S) ve 158.814 (4S) seviyelerinde bulunuyor.
- Çelişkili sinyaller mevcut: RSI nötr ancak 1S/1G'de yükseliş trendinde, MACD histogramı ise 1S/4S'de negatif momentum gösteriyor. Stokastik göstergeler zaman dilimleri arasında karışık sinyaller veriyor.
- Brent petrolünün 96.51 dolara yükselişi, enflasyon endişelerini artırarak merkez bankası politikalarını ve döviz piyasalarını etkileyebilir.
- 158.927 üzerine bir kırılma 159.049'u hedefleyebilir, ancak 158.805 üzerinde tutunulamazsa 158.734'e geri çekilme görülebilir.
USDJPY için teknik görünüm, zıtlıkların büyüleyici bir incelemesini sunuyor. 1 saatlik grafikte, 27.33'lük Ortalama Yön Endeksi (ADX), güçlü ve yerleşik bir trendi işaret ederek, fiyat hareketlerinin rastgele dalgalanmalar olmadığını, belirgin piyasa güçleri tarafından yönlendirildiğini gösteriyor. Ancak, bu netlik, 50'nin üzerinde ancak nötr bölgede yer alan ve henüz tam olarak gerçekleşmemiş potansiyel bir yükseliş momentumuna işaret eden 52'lik Göreceli Güç Endeksi (RSI) ile bir miktar bulanıklaşıyor. Hareketli Ortalama Yakınsama Iraksama (MACD) histogramının şu anda negatif bölgede ve sinyal çizgisinin altında olması, aşağı yönlü momentumun zayıfladığını veya net bir yönlü hareket yerine konsolidasyon potansiyelini göstererek başka bir karmaşıklık katmanı ekliyor. Trend gücü ve momentum göstergeleri arasındaki bu ıraksama, usta yatırımcıların onay aradığı yerdir.
Anlık görünümü daha da karmaşık hale getiren Stokastik Osilatör, karışık bir tablo sunuyor. 1 saatlik zaman diliminde, %K çizgisi 67.99 ve %D çizgisi 83.94 seviyesinde, bu genellikle yukarı yönlü bir hareketi işaret ederken, her ikisi de üst aralıkta bulunuyor ve paritenin aşırı alım koşullarına yaklaşıyor olabileceğini gösteriyor. Bu durum, 4 saatlik Stokastik'teki %K (47.85) ve %D (58.88) arasındaki farktan farklıdır ve düşüş yönlü bir sinyal vermektedir. Bu tutarsızlık, çoklu zaman dilimi analizinin önemini vurgulamaktadır; bir grafikte potansiyel bir alım sinyali gibi görünen şey, diğerinde bir uyarı işareti olabilir. 1 saatlik grafikteki Bollinger Bantları da orta bandın üzerinde konumlanmış olup, hafif yükseliş eğilimiyle uyumludur, ancak genel resim net bir yönlü inanç yerine bir savaş alanı senaryosu öneriyor.
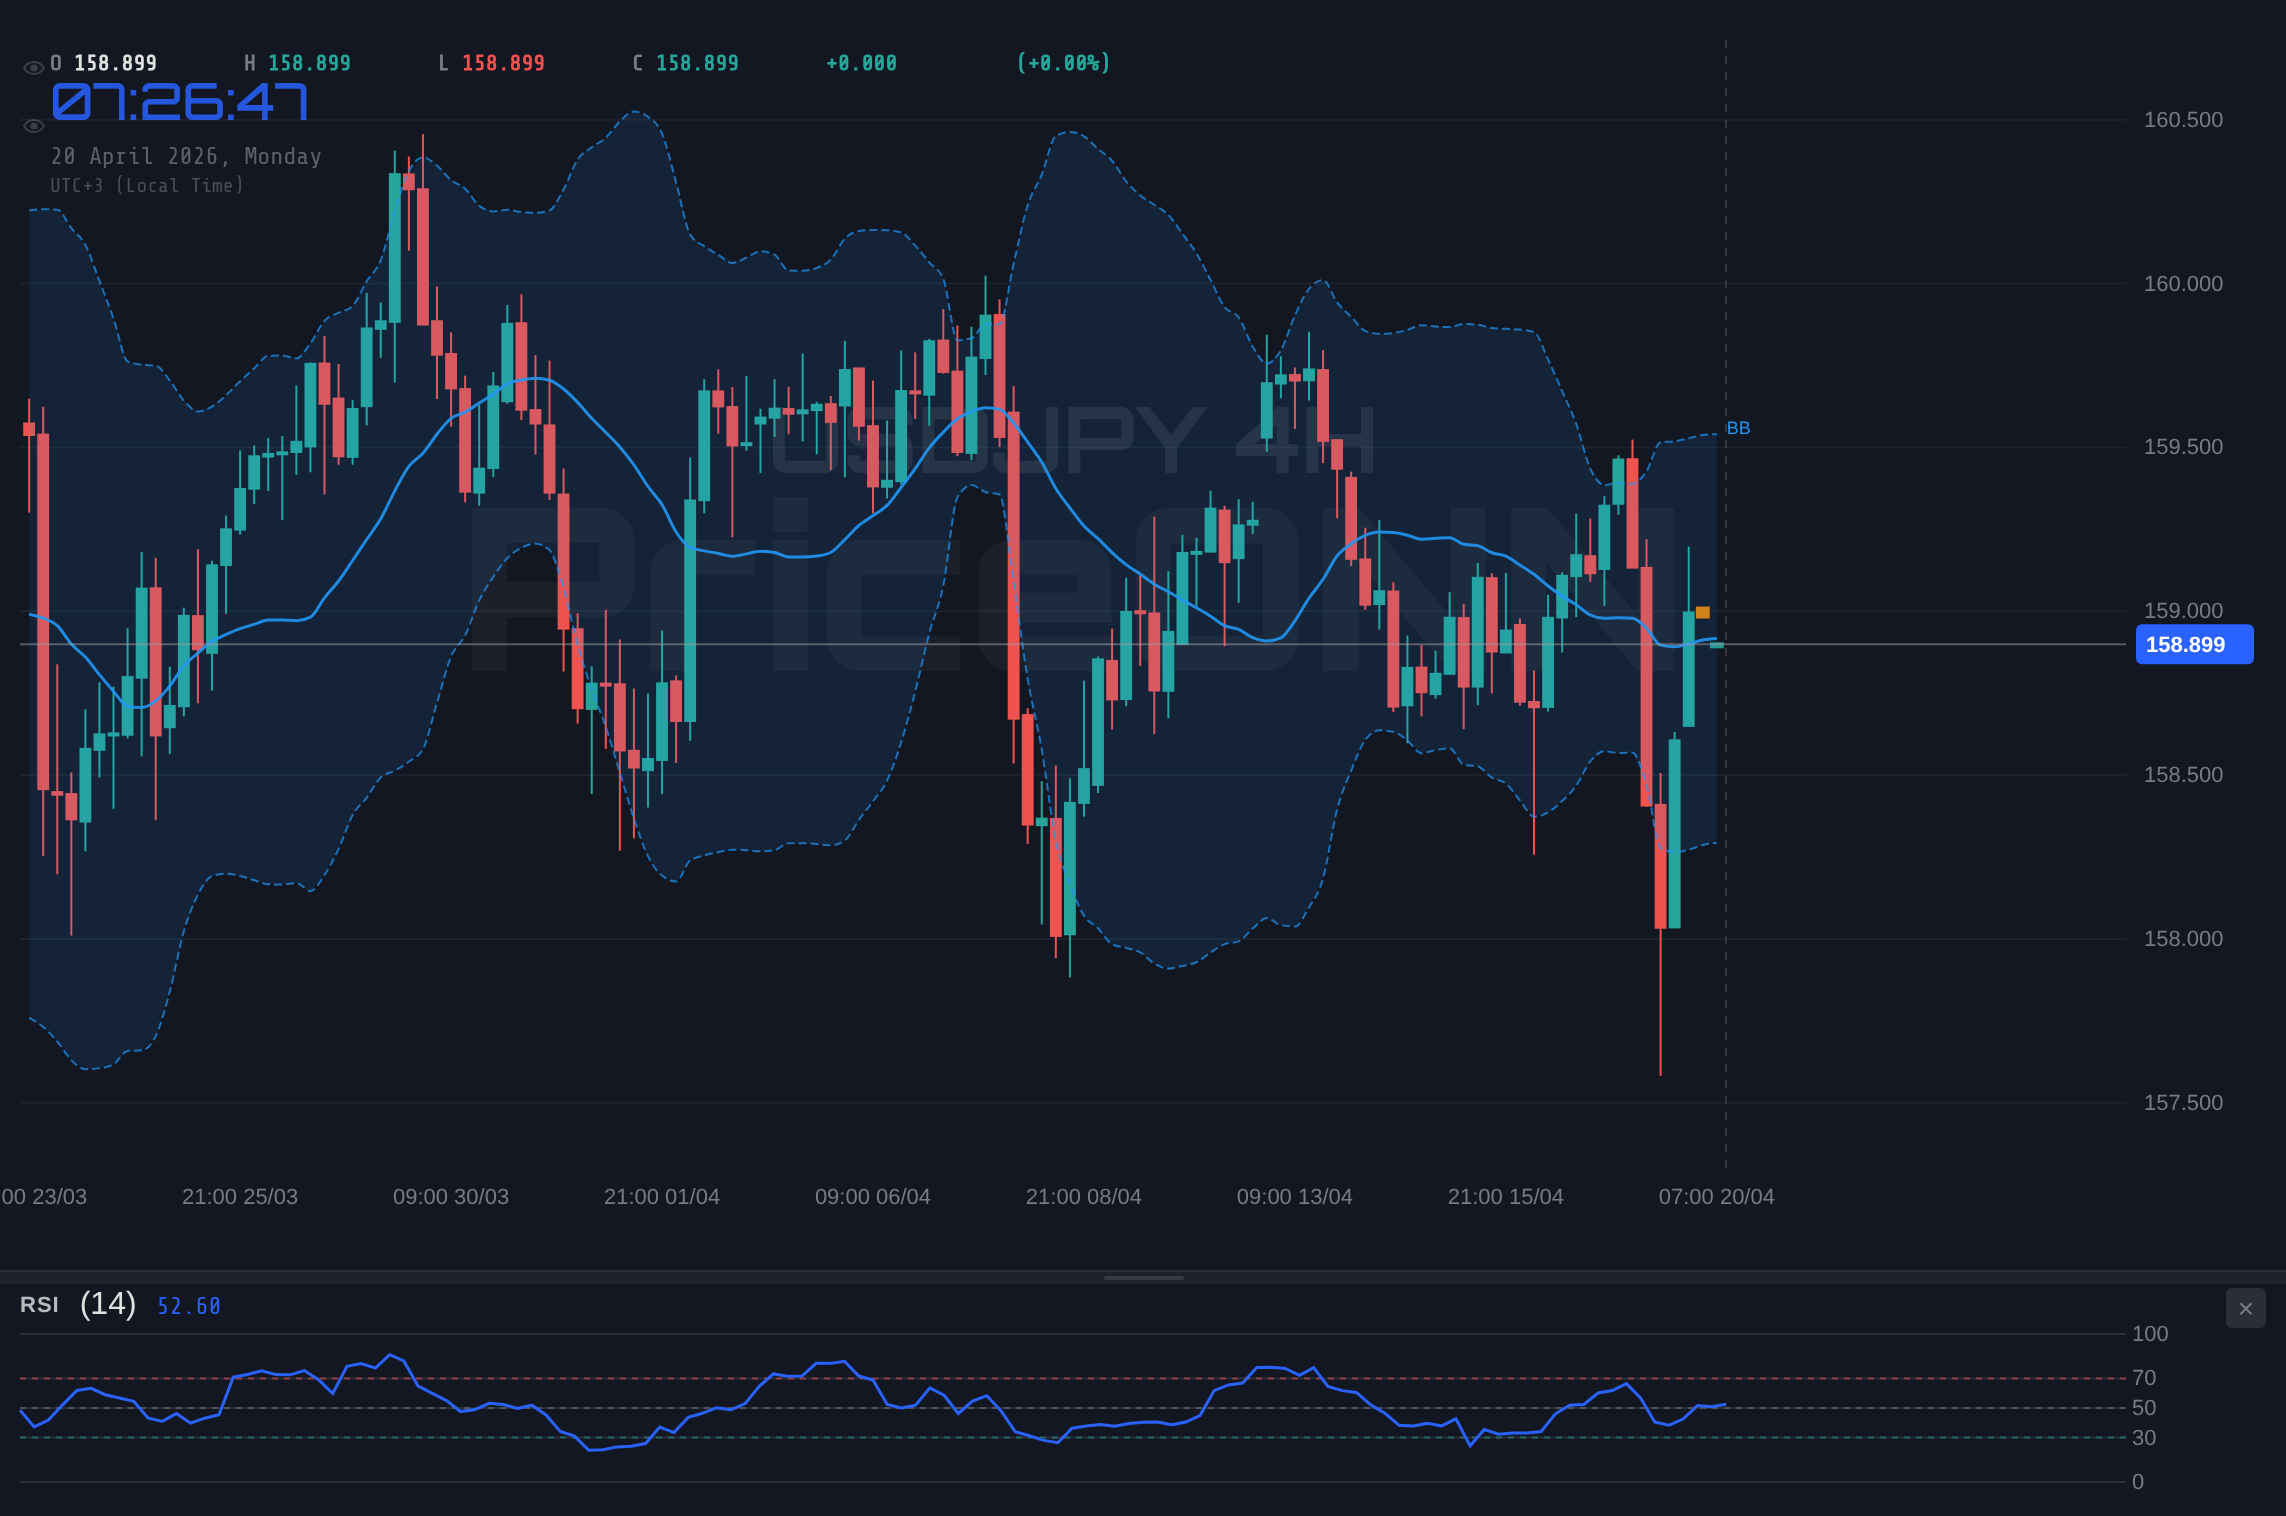
4 saatlik zaman dilimine geçildiğinde, ADX'in 27.33 ile gösterdiği trend gücü, piyasanın tamamen yönsüz bir durumda olmadığını pekiştiriyor. Ancak, buradaki RSI 49.26'ya düşerek düşüş bölgesine doğru eğilim gösteriyor ve potansiyel bir yükseliş ivmesi kaybına işaret ediyor. MACD histogramı negatif seyrini sürdürerek, daha kısa zaman diliminde gözlemlenen düşüş momentumunu güçlendiriyor. Stokastik Osilatör'ün %K çizgisi (47.85), %D çizgisinin (58.88) altında olması, bu zaman diliminde düşüş yönlü bir görünümü daha da destekliyor. Bollinger Bantları, orta bandın üzerinde hala bulunsa da, fiyatın üst banda yapışması yönünde işaretler gösteriyor ki bu bazen bir tersine dönüş veya konsolidasyon dönemi öncesinde görülebilir. Farklı zaman dilimleri arasındaki bu karışık mesajlaşma, mevcut fiyat seviyelerinin kritik doğasını vurgulamaktadır.
Günlük grafik ise daha da incelikli bir tablo çiziyor. Buradaki ADX 17.53 ile zayıflayan bir trendi gösteriyor, bu da saatlik grafiklerde görülen güçlü yönlü kuvvetlerin daha uzun vadelerde dağılabileceğini düşündürüyor. 51.11'lik RSI, kesin olarak nötr bölgede yer alıyor ve çok az yönlü bir eğilim sunuyor. MACD şu anda sinyal çizgisinin altında ve negatif momentumla seyrediyor, bu da bu daha uzun zaman diliminde düşüş yönlü bir işarettir. %K'nın 52.44 ve %D'nin 54.08 olduğu Stokastik Osilatör de düşüş yönlü bir çapraz göstererek aşağı yönlü potansiyeli daha da güçlendiriyor. Bollinger Bantları orta bandın altında yer alıyor ve düşüş yönlü bir eğilim gösteriyor. Kısa vadeli zaman dilimlerindeki güçlü trend sinyalleri ile günlük grafikteki zayıflayan trend ve düşüş momentumu arasındaki bu kontrast çok önemlidir. Bu durum, kısa vadeli yatırımcıların USDJPY'yi yukarı itebileceğini, ancak uzun vadeli trendin gücünü kaybediyor olabileceğini ve bu da 158.89'daki mevcut direnç seviyesini özellikle önemli kıldığını düşündürmektedir.
158.89 seviyesi etrafındaki fiyat hareketi kritik öneme sahip. 1 saatlik grafikte anlık direnç 158.927 olarak belirlenmiş durumda. Bu seviyenin üzerinde kararlı bir kırılma ve tutunma, bir sonraki direnç olan 159.049'a doğru bir hareketi tetikleyebilir. Ancak, piyasa verileri bunun düz bir yükseliş olmadığını açıkça gösteriyor. 1 saatlik grafikteki destek seviyeleri 158.805 ve 158.734'te yer alıyor. 158.805'in üzerinde fiyatı sürdürememek, hızla bu alt seviyelerin test edilmesine yol açabilir. Günlük grafikteki 159.559'luk direnç seviyesi daha büyük bir tehdit oluşturuyor, ancak buraya ulaşmak birkaç ara engeli aşmayı gerektirecektir. 158.89'daki mücadele, kısa vadeli yönü belirleyebilecek mikro düzeyde bir savaştır.
Brent petrol fiyatlarının 96.51 dolara yükselmesiyle birlikte daha geniş piyasa bağlamı göz ardı edilemez. Enerji maliyetlerindeki bu keskin artış, küresel çapta enflasyon endişelerini körüklüyor. Japonya Merkez Bankası'nın ultra-gevşek para politikasını sürdürdüğü USDJPY gibi bir döviz çifti için, küresel enflasyonda sürekli bir artış, reel getirilerin daha da negatife dönmesiyle Yen üzerinde baskı oluşturabilir. Tersine, ABD Merkez Bankası (Fed) enflasyona yanıt olarak daha şahin bir duruş sergilerse, bu Dolar'ı güçlendirebilir ve USDJPY'yi yukarı itebilir. Mevcut veriler, Dolar Endeksi'nin (DXY) 98.01 seviyesinde olduğunu, 1 saatlik ve 4 saatlik grafiklerde hafif yükseliş eğilimi gösterdiğini ancak günlük grafikte düşüş yönlü bir sinyal verdiğini gösteriyor. Bu durum, Dolar'ın hem enflasyon verilerine hem de Fed politika beklentilerine duyarlı, hassas bir konumda olduğunu gösteriyor. DXY ve USDJPY arasındaki korelasyon genellikle pozitiftir, yani daha güçlü bir dolar genellikle daha yüksek USDJPY seviyelerini destekler.
Ticaret perspektifinden bakıldığında, teknik sinyallerin ve makroekonomik faktörlerin birleşimi hem fırsatlar hem de riskler sunuyor. Kısa vadeli zaman dilimlerindeki güçlü ADX okumaları, tanımlanmış trendlerin mevcut olduğunu gösteriyor, ancak farklı zaman dilimlerindeki çelişkili RSI ve MACD sinyalleri ile zayıflayan günlük trend, temkinli bir yaklaşımı gerektiriyor. 158.89'daki anlık direnç saygı görmeli. Özellikle günlük grafikteki düşüş sinyalleri yoğunlaşırken 158.927'nin üzerinde kararlı bir şekilde kırılamaması, 158.805 desteğine doğru bir geri çekilmeye yol açabilir. Kısa pozisyon arayan yatırımcılar, 158.734'ün altına kırılma ve tutunma durumunu izleyerek 4 saatlik destek olan 158.217'yi hedefleyebilirler.
Tersine, yükseliş senaryosu 158.927 direncini aşan sürdürülebilir bir ivme gerektirir. Günlük göstergelerin mevcut negatif MACD momentumunu ve Stokastik çaprazını tersine çevirmesiyle, ideal olarak RSI'nin 50'nin üzerine çıkmasıyla onay gelecektir. USDJPY 158.927'yi aşabilirse, bir sonraki psikolojik seviye 159.000, ardından 4 saatlik direnç 159.021 olacaktır. Daha uzun vadeli günlük direnç olan 159.559 ise nihai hedef haline gelecektir. Ancak, mevcut karışık sinyaller ve petrol fiyatı volatilitesinin yakınlığı göz önüne alındığında, böyle bir hareketin, muhtemelen yaklaşan ABD ekonomik verilerinden veya merkez bankası söylemindeki bir değişimden kaynaklanan güçlü bir katalizöre ihtiyacı olacaktır.
Petrol fiyatları ile döviz piyasaları arasındaki etkileşim kritik bir anlatı ipliğidir. Brent petrolünün 96.51 dolara yükselişi, küresel ekonomik görünüme enflasyonist bir unsur katıyor. Yüksek enerji fiyatları, petrol ihraç eden ülkelerin para birimlerini dolaylı olarak desteklerken, ithalatçıları baskılayabilir. USDJPY için bu, enflasyon beklentilerindeki herhangi bir artışın, özellikle Japonya Merkez Bankası (BOJ) gevşek politikasını sürdürürken diğer merkez bankaları sıkılaşırsa, Yen üzerinde ince bir baskı oluşturabileceği anlamına gelir. Bu durum, yaklaşan ekonomik takvim olaylarını, özellikle yüksek etkili ABD veri yayınlarını, USDJPY etrafındaki anlatıyı şekillendirmek için kritik hale getiriyor. Yatırımcılar, bu yayınları enflasyon eğilimleri ve potansiyel politika tepkileri hakkında ipuçları için dikkatle inceleyecekler, bu da mevcut teknik çıkmazı kırabilir.
Mevcut 'AUD'nin gelecek hafta Yen'den daha güçlü olması bekleniyor mu?' sorgusu, doğrudan USDJPY ile ilgili olmasa da, Yen zayıflığına yönelik genel ilgiyi vurguluyor. Avustralya Doları Yen karşısında güçlenirse, bu risk iştahı veya AUD lehine belirli ekonomik sürücüler olduğunu gösterir. Bu genel piyasa duyarlılığı, USDJPY'yi dolaylı olarak etkileyebilir. Yükselen hisse senedi piyasaları ve Yen gibi güvenli liman para birimlerinin zayıflamasıyla karakterize edilen sürdürülebilir bir risk iştahı ortamı, özellikle ABD Doları'nın güçlenmesiyle birlikte USDJPY için bir destekleyici faktör olabilir. Ancak, mevcut teknik göstergeler daha temkinli bir kısa-orta vadeli görünüm sunuyor ve böyle geniş çaplı bir risk iştahı hareketinin daha fazla katalizör olmadan yakın zamanda gerçekleşmeyebileceğini düşündürüyor.
USDJPY'nin 158.89 civarında işlem gören mevcut teknik kurulumu, klasik bir direnç testi senaryosu sunuyor. Kısa vadeli zaman dilimlerindeki güçlü trend sinyalleri, günlük grafikteki zayıflayan momentum ve trend gücü ile çelişkili osilatör okumalarıyla dengeleniyor. Petrol fiyatlarındaki artış, kolayca göz ardı edilemeyecek jeopolitik ve enflasyonist bir karmaşıklık katmanı ekliyor. Yatırımcılar, anlık direnç ve destek seviyelerine saygı göstererek uyanık kalmalıdır. Günlük göstergelerin yükselişe dönmesiyle onaylanan 158.927'nin üzerinde kararlı bir kırılma, daha yukarı yönlü bir hareketi işaret edebilir. Ancak, bu seviyede bir başarısızlık, özellikle günlük grafikte düşüş sinyallerinin yoğunlaşmasıyla birlikte, alt destek bölgelerine doğru bir geri çekilmeye yol açabilir. Bu dalgalı ortamda yön bulmak için sabır ve sıkı risk yönetimi anahtar olacaktır.
Düşüş Senaryosu: Direnç Sağlam Kalıyor
65% OlasılıkNötr Senaryo: 158.89 Civarında Konsolidasyon
25% OlasılıkYükseliş Senaryosu: Direnç Üzeri Kırılma
10% OlasılıkHürmüz Boğazı durumu gibi olaylar nedeniyle petrol fiyatlarındaki oynaklıkla işaretlenen mevcut jeopolitik iklim, bir belirsizlik katmanı ekliyor. Bu, dolaylı olarak Yen'in güvenli liman çekiciliğini ve Dolar'ın gücünü etkileyerek USDJPY dinamiklerini etkileyebilir. Yatırımcılar, önemli fiyat hareketleri için katalizör görevi görebilecekleri için enerji arzı ve jeopolitik gerilimlerle ilgili manşetleri yakından izlemelidir.
Sıkça Sorulan Sorular: USDJPY Analizi
USDJPY'nin 158.927 direnç seviyesini kıramaması durumunda ne olur?
USDJPY'nin 158.927'yi kıramaması durumunda, düşüş senaryosu daha olası hale gelir. Anlık destek olan 158.805 test edilebilir ve özellikle günlük göstergeler düşüş momentumunu göstermeye devam ederse, 158.734'e ve muhtemelen 4 saatlik destek olan 158.217'ye doğru bir düşüş yaşanabilir.
Mevcut ADX okumasını göz önüne alarak, USDJPY 158.805'in altına kırılırsa kısa pozisyon düşünmeli miyim?
158.805'in altına kırılması ve sürdürülebilir bir şekilde tutunması, özellikle günlük grafikteki düşüş sinyalleriyle onaylanırsa, kısa pozisyon fırsatı sunabilir. Ancak, güçlü 1 saatlik ADX ile hızlı bir yükseliş de mümkündür. Hedef 1 158.734, Hedef 2 ise 158.217 olacaktır. Çelişkili sinyaller göz önüne alındığında risk yönetimi esastır.
Günlük grafikteki RSI'nin 51.11 olması USDJPY için bir alım sinyali midir?
Günlük grafikte 51.11'lik bir RSI nötr kabul edilir ve güçlü bir alım veya satım baskısı göstermez. Hafif bir yükseliş eğilimi gösterse de, tek başına kesin bir alım sinyali değildir. Daha güçlü bir yükseliş inancı için günlük zaman dilimindeki MACD ve Stokastik gibi diğer göstergelerden onay gelmesi gerekecektir.
Brent petrolünün 96.51 dolara yükselişi bu hafta USDJPY'yi nasıl etkileyebilir?
Brent petrolünün 96.51 dolara yükselişi enflasyon endişelerini artırıyor. Bu durum, daha şahin bir Fed duruşu beklentilerine yol açarsa, özellikle Japonya Merkez Bankası (BOJ) gevşek politikasını sürdürürse ABD Doları'nı güçlendirebilir ve USDJPY'yi yukarı itebilir. Tersine, küresel ekonomik zayıflığına işaret ederse, güvenli liman olarak Yen'i destekleyerek USDJPY zayıflığına yol açabilir.
Piyasaları canlı takip edin
AI destekli analizler, teknik göstergeler ve anlık fiyat verileri.
Telegram Kanalımıza Katılın
Son dakika piyasa haberleri, AI analizleri ve trading sinyalleri.
Kanala Katıl