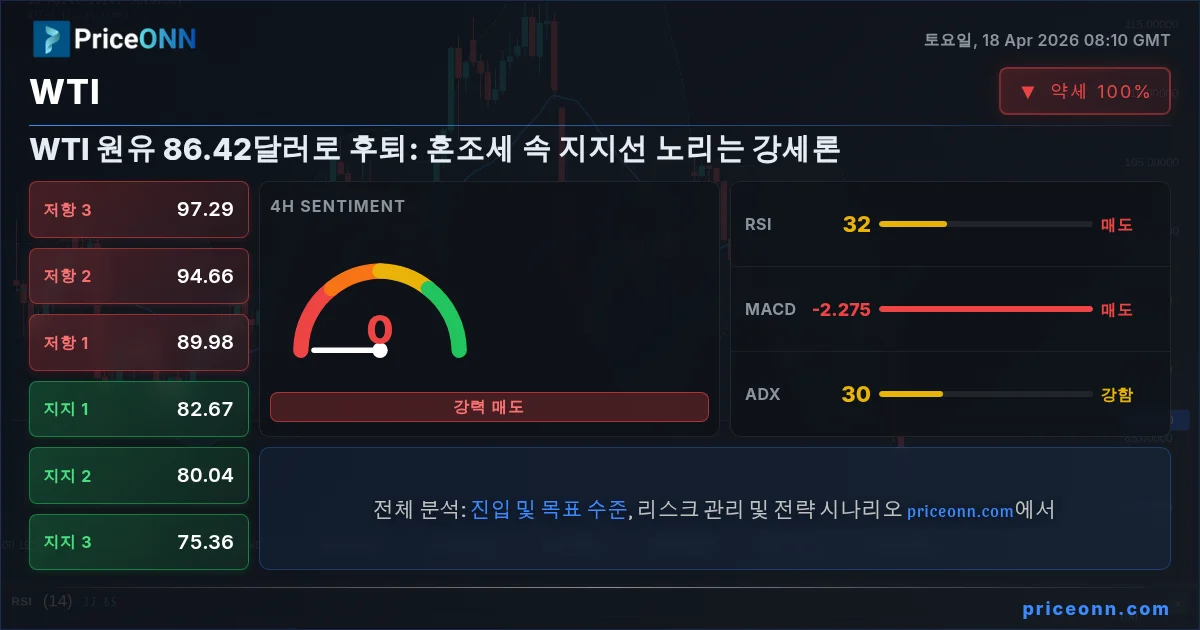
WTI Crude Oil Retreats to $86.42: Bulls Eyeing Support Amid Mixed Signals
WTI crude oil is trading at $86.42 after a sharp weekly decline. Technicals show mixed signals as traders eye key support levels and upcoming economic data.
WTI crude oil has experienced a significant pullback, closing last week near the $86.42 mark. This sharp retreat from recent highs has left many market participants questioning the sustainability of the prior bullish momentum. The past week was characterized by a volatile mix of geopolitical headlines, shifting economic data, and a notable surge in US crude inventories, all contributing to a complex trading environment. As we step into a new trading week, the narrative surrounding WTI remains decidedly mixed, with both upside and downside risks demanding close attention from traders and investors alike. Understanding the interplay between these fundamental and technical factors is crucial for navigating the path ahead.
- WTI crude oil closed last week near $86.42, down significantly from recent highs.
- Critical support for WTI sits at $82.67, tested during last week's sell-off.
- RSI at 37.67 on the 1-hour chart indicates downward momentum, while the 1D chart shows a neutral 43.94.
- US crude inventories surged significantly last week, contributing to bearish sentiment.
- Upcoming economic data, particularly inflation and employment figures, will be key drivers for WTI next week.
The dramatic price action seen in WTI crude oil over the past week underscores the inherent volatility within the energy markets. After touching highs that briefly flirted with the $100 per barrel mark, the commodity experienced a sharp and swift decline, shedding nearly 10% of its value to settle around $86.42. This rapid reversal was fueled by a confluence of factors, including renewed diplomatic efforts between the US and Iran, which seemingly eased immediate fears of supply disruptions in the Strait of Hormuz. Coupled with a substantial build-up in US crude oil inventories, these developments provided a potent cocktail for bearish traders to exploit. The market's reaction highlights how quickly sentiment can shift, especially when perceived supply risks are alleviated, even temporarily.
Looking at the broader macroeconomic landscape, the correlation between crude oil prices and inflation expectations remains a central theme. As gasoline prices surged by approximately 26% in March, driven by higher crude costs, concerns about sticky inflation in the US have resurfaced. This adds a layer of complexity for central bankers, particularly the Federal Reserve, as they weigh their next moves on interest rates. While the Fed has maintained a data-dependent stance, persistent inflationary pressures could force their hand, potentially leading to a more hawkish policy outlook. Such a scenario would typically exert downward pressure on risk assets, including crude oil, as higher borrowing costs can dampen economic activity and, consequently, energy demand. The market is keenly watching upcoming economic releases, such as retail sales and inflation data, for clues on consumer resilience and the Fed's future policy direction.

The geopolitical backdrop has also been a significant driver of price action. Reports suggesting a potential reopening of the Strait of Hormuz, a critical chokepoint for global oil supply, initially sent shockwaves through the market, contributing to the sharp sell-off. While the specifics of any diplomatic breakthroughs remain fluid, the mere prospect of de-escalation in a volatile region can significantly impact market sentiment. Historically, tensions in the Middle East have been a primary catalyst for crude oil price spikes due to the immediate threat to supply routes. The recent easing of these perceived threats, even if temporary, has allowed fundamental supply-demand dynamics, such as inventory levels, to take center stage.
The surge in US crude oil inventories, which saw a significant build-up last week, is a critical piece of the puzzle. Data indicated a build of approximately 10 million barrels, a figure that far exceeded market expectations and underscored a potential imbalance between supply and demand. This build-up suggests that current production levels may be outpacing consumption, or that demand is softening more than anticipated. For traders focused on supply-side fundamentals, this inventory data is a strong bearish signal, indicating ample supply in the market and potentially capping any upward price movement in the short term. The market's response to this data point was immediate and pronounced, reinforcing the bearish narrative that gained traction towards the end of the week.
The Technical Picture: A Battle for Control
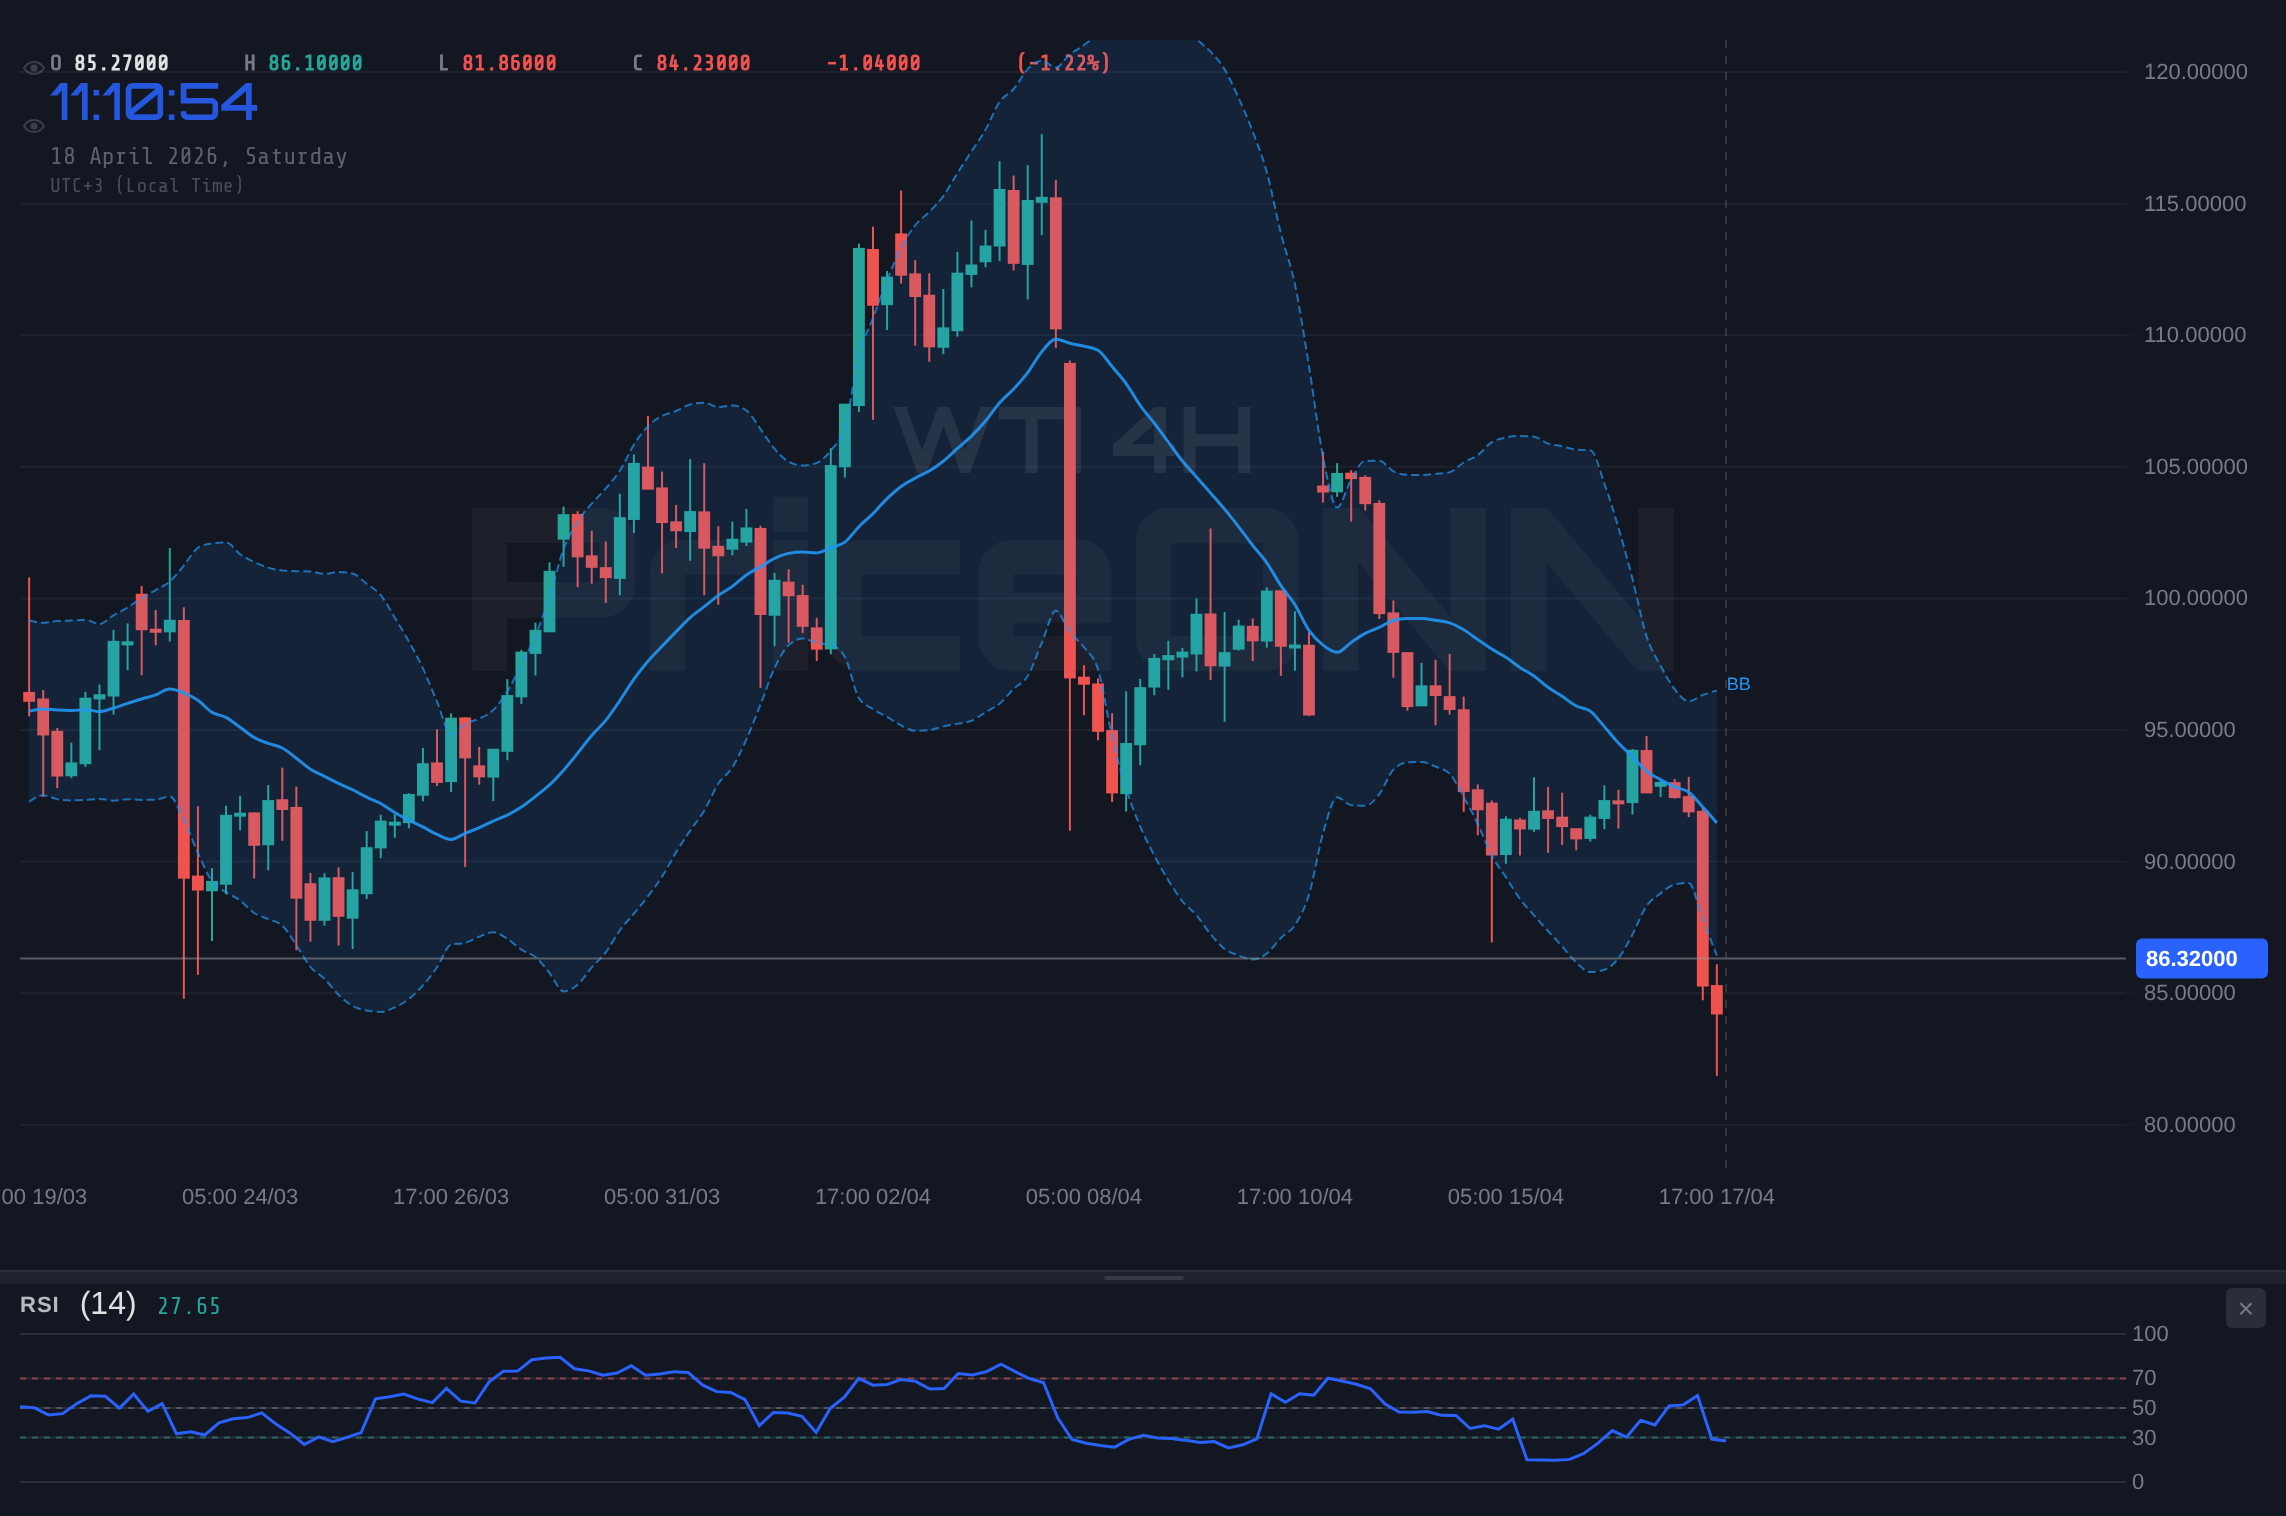
Examining the technical indicators for WTI provides a clearer, albeit complex, picture of the current market sentiment. On the 1-hour chart, the Relative Strength Index (RSI) stands at 37.67, signaling a bearish momentum and suggesting that the commodity is approaching oversold territory, though not yet there. The Moving Average Convergence Divergence (MACD) also shows negative momentum, with the MACD line below its signal line, reinforcing the bearish bias in the short term. The Stochastic Oscillator, with %K at 43.63 and %D at 24.15, indicates a potential for a bounce as %K is above %D, suggesting some upward movement might be on the cards, but the overall trend is still downwards. The Average Directional Index (ADX) at 37.6 indicates a strong downward trend, confirming the prevailing bearish sentiment in the immediate intraday timeframe.
However, zooming out to the daily timeframe presents a more nuanced view. The RSI sits at a neutral 43.94, indicating that while the short-term trend is down, the longer-term trend is not yet oversold. The MACD on the daily chart also shows negative momentum, but it has been trending downwards, suggesting that the selling pressure might be losing some steam. The Stochastic Oscillator on the daily chart, with %K at 15.23 and %D at 17.04, is firmly in oversold territory, hinting at a potential reversal or at least a pause in the downward trend. The ADX at 38.29 still points to a strong downward trend, but its slight decrease from intraday highs suggests that the trend's intensity might be waning. This divergence between the short-term bearish signals and the longer-term oversold conditions creates a 'make-or-break' scenario for WTI in the coming days.
The confluence of these technical signals suggests a market at a critical juncture. While the immediate pressure is to the downside, the oversold conditions on longer timeframes could provide a floor. Traders will be watching the key support levels closely. The first significant support level identified is at $85.07, followed by $83.97 and then a more substantial level at $83.27. A break below $83.27 could signal further downside, potentially targeting the lower bounds of the recent trading range. On the resistance side, the immediate hurdle is at $86.87, followed by $87.57 and then $88.67. A decisive move above $88.67 would be required to challenge the bearish sentiment and potentially initiate a broader upward correction.
The strength of the trend is also a significant factor. On the 1-hour chart, the ADX is at 37.6, indicating a strong downward trend. However, the 4-hour chart shows an ADX of 30.33, still strong but slightly less so, while the daily ADX at 38.29 reinforces the overall bearish trend. This persistence of a strong downward trend on multiple timeframes suggests that rallies might be met with selling pressure. The market is currently in a phase where any upward movement could be seen as an opportunity for sellers to re-enter the market, especially if the fundamental picture does not show significant improvement in demand or a tightening of supply conditions.
Correlation Analysis: The Dollar and Equities
The movement of the US Dollar Index (DXY) often has an inverse correlation with commodity prices, including WTI. Last week, the DXY experienced some fluctuations, but its overall strength has been a factor weighing on dollar-denominated commodities. With the DXY currently hovering around 97.9, any further strength in the dollar could exacerbate the downward pressure on oil prices. A stronger dollar makes oil more expensive for holders of other currencies, potentially dampening global demand. Conversely, a weaker dollar can provide some support to oil prices, acting as a buffer against bearish fundamental news. Traders are closely monitoring the DXY's reaction to upcoming US economic data, particularly inflation and interest rate expectations.
The performance of major equity indices, such as the S&P 500 and Nasdaq 100, also provides insights into market sentiment. Last week, US equities showed a mixed performance, with some indices ending the week on a strong note while others showed signs of topping out. The S&P 500, for instance, ended higher at 6572.87, but the Nasdaq 100's surge to 26682.75 suggests a potential divergence or a rotation within the market. Generally, a risk-on environment, characterized by rising equity markets, tends to correlate with higher energy prices as demand expectations increase. However, if the equity markets show signs of a broader downturn, it could signal a decrease in risk appetite, leading investors to shed commodities and seek safer assets. This correlation is particularly important given the current macroeconomic backdrop, where inflation and interest rate uncertainty could impact both equities and commodities.
The interplay between these correlated assets is crucial. For example, if the DXY were to break above its key resistance levels while equities start to falter, it would strongly suggest a risk-off sentiment that would likely weigh heavily on WTI. Conversely, a sustained rally in the S&P 500 coupled with a weakening dollar could provide a tailwind for oil prices, potentially helping WTI to recover from its recent lows. Understanding these cross-asset relationships is vital for a holistic market view, moving beyond a single-instrument analysis to a more comprehensive understanding of the forces at play.
Navigating the Week Ahead: Key Events and Outlook
The upcoming week promises to be pivotal for WTI crude oil, with several key economic events on the calendar that could significantly influence price direction. On the fundamental front, market participants will be scrutinizing inflation data, particularly the Consumer Price Index (CPI) and Personal Consumption Expenditures (PCE) price index releases. These figures will provide crucial insights into the persistence of inflationary pressures in the US economy and could heavily influence the Federal Reserve's monetary policy decisions. If inflation comes in hotter than expected, it could reinforce expectations for a more cautious or even hawkish stance from the Fed, potentially strengthening the dollar and pressuring oil prices.
Employment data, including Non-Farm Payrolls (NFP) and the unemployment rate, will also be closely watched. Strong employment figures could signal a robust economy, supporting energy demand and providing a basis for higher oil prices. However, if the data suggests a weakening labor market, it could fuel concerns about an economic slowdown, which would likely have a negative impact on WTI. The market's reaction to these releases will be amplified by the current sentiment, which appears to be leaning bearish following last week's sharp decline and inventory build-up. Traders will be looking for confirmation of either a sustained downtrend or signs of a bottoming process.
The ongoing diplomatic developments, particularly concerning Iran and the Strait of Hormuz, will continue to be a significant wildcard. Any news suggesting a de-escalation or, conversely, a flare-up in regional tensions could trigger sharp price movements. While the market has reacted to hopes of a diplomatic solution, the underlying supply risks in the Middle East remain a constant background factor that could quickly reassert itself. Traders will need to remain vigilant for any geopolitical headlines that could disrupt the current narrative and shift the focus back to supply-side concerns.
From a technical standpoint, the $86.42 level represents a crucial psychological point. A decisive close below this level could invite further selling, targeting the support at $85.07 and subsequently $83.97. The $83.27 level stands as a significant floor, and a break below it would significantly alter the bullish outlook that prevailed in recent months. On the upside, a sustained move above $86.87 would be the first step towards challenging the bearish sentiment. If WTI can reclaim the $88.67 resistance level, it would signal a potential reversal, opening the door for a test of higher price points. However, given the current bearish momentum and the strong downward trend indicated by the ADX on intraday charts, such a move would require a significant catalyst, likely stemming from improved demand forecasts or renewed supply concerns.
Bearish Scenario: Downside Pressure Mounts
65% ProbabilityNeutral Scenario: Consolidation Around $86.42
25% ProbabilityBullish Scenario: Reversal Potential Emerges
10% ProbabilityFrequently Asked Questions: WTI Analysis
What happens if WTI breaks below the $83.27 support level?
A decisive break below $83.27 would invalidate the current neutral outlook and likely trigger further downside. This could lead to a test of lower support levels, potentially revisiting the $80-$82 range, especially if fundamental drivers like high inventories and weakening demand persist.
Should I buy WTI at current levels around $86.42 given the oversold stochastic on the daily chart?
Buying solely based on the daily oversold stochastic at $86.42 carries significant risk due to the strong bearish momentum on shorter timeframes. A more prudent approach would be to wait for confirmation, such as a break above $88.67 resistance or a clear bullish divergence on the 1-hour RSI, before considering long positions.
Is the RSI at 37.67 on the 1-hour chart a reliable sell signal for WTI?
An RSI of 37.67 on the 1-hour chart indicates bearish momentum, aligning with the recent price decline. While it suggests selling pressure, it's not necessarily a standalone sell signal, especially given the oversold conditions on longer timeframes. It reinforces the bearish bias but confirmation from price action, like a break of support, is advisable.
How will upcoming US inflation data affect WTI crude oil prices this week?
Higher-than-expected inflation data could lead to a more hawkish stance from the Federal Reserve, potentially strengthening the dollar and dampening oil demand expectations. This would likely put further downward pressure on WTI, possibly pushing it towards the $83.27 support level. Conversely, softer inflation might ease Fed concerns, potentially supporting oil prices.
| Indicator | Value | Signal | Interpretation |
|---|---|---|---|
| RSI (1H) | 37.67 | Bearish | Downward momentum, approaching oversold. |
| MACD (1H) | -2.15 | Bearish | Negative momentum below signal line. |
| Stochastic (1H) | K:43.63, D:24.15 | Bullish Signal | %K above %D, potential bounce. |
| ADX (1H) | 37.6 | Strong Trend | Confirms strong downward trend. |
| RSI (1D) | 43.94 | Bearish | Neutral, but trending down. |
| MACD (1D) | -1.82 | Bearish | Negative momentum, but potentially waning. |
| Stochastic (1D) | K:15.23, D:17.04 | Oversold | Deeply oversold, potential reversal. |
| ADX (1D) | 38.29 | Strong Trend | Confirms strong downward trend. |
The path forward for WTI crude oil appears to hinge on a delicate balance of competing forces. The bearish sentiment, fueled by significant inventory builds and temporary de-escalation of geopolitical risks, has established strong downward momentum on shorter timeframes. However, the oversold conditions on longer daily charts suggest that the commodity may be approaching a level where a technical bounce could occur, provided no further negative fundamental shocks emerge. The upcoming economic data releases, particularly inflation figures and their implications for Federal Reserve policy, will be critical in shaping market expectations and, consequently, the direction of oil prices. Traders should remain cautious, prioritizing risk management and seeking confirmation before committing to positions. Patience will likely be rewarded as the market digests the latest data and geopolitical developments, ultimately revealing the true strength of either the bulls or the bears.
Track markets in real-time
AI-powered analysis, technical indicators and real-time price data.
Join Our Telegram Channel
Breaking market news, AI analysis and trading signals instantly.
Join Channel