

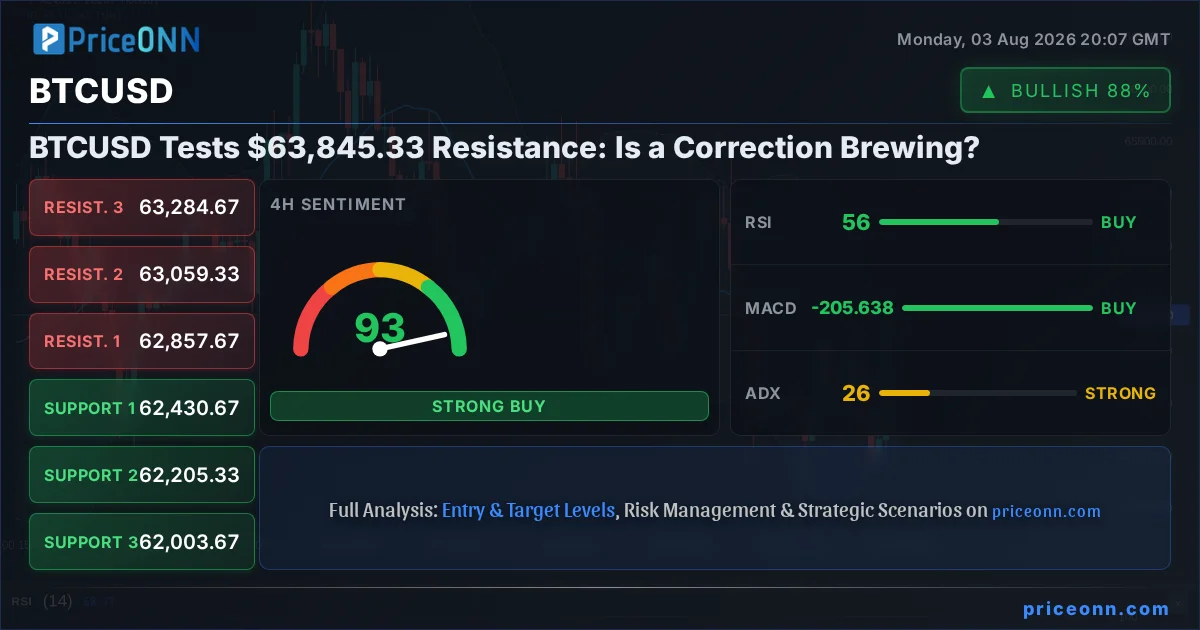
Bitcoin's dance around the $63,850 mark presents a critical juncture for traders this week. The digital gold has been consolidating, testing a key resistance level at $63,845.33, a price point that has acted as a significant barrier in recent price action. This tug-of-war between buyers and sellers at this pivotal level is not just a technical observation; it reflects a broader market sentiment grappling with the implications of macroeconomic shifts and the ongoing maturation of the cryptocurrency ecosystem. Understanding the forces at play, from on-chain metrics to the subtle shifts in institutional flows, is paramount for navigating this volatile landscape.
- RSI at 63.33 signals a strong uptrend but hints at potential overbought conditions if resistance at $63,845.33 holds.
- The critical support for BTCUSD sits at $63,481.67, tested multiple times this week; a break below could signal a deeper correction.
- MACD histogram shows positive momentum, but divergence on the 4H chart suggests bulls may be losing steam.
- Fed rate expectations and DXY movements are currently influencing BTCUSD, with the dollar index at 99.97 showing a neutral-to-bullish stance.
The current price action for BTCUSD, hovering around $63,850.00, is a complex interplay of technical signals and underlying market fundamentals. On the 1-hour chart, the Relative Strength Index (RSI) at 63.33 indicates a healthy uptrend without being excessively overbought, suggesting there might still be room for upward movement. However, the Average Directional Index (ADX) at 26.27 points to a strong existing trend, which could mean that current resistance levels are robust. The Stochastic Oscillator is showing %K at 88.74 and %D at 88.32, firmly in overbought territory on the 1H timeframe, a signal that often precedes a pullback or consolidation. This divergence in signals - a strong trend indicated by ADX but overbought conditions by Stochastic - creates a nuanced picture, demanding careful observation.
Looking at the 4-hour timeframe, the technical indicators offer a slightly different perspective. The RSI at 55.89 remains in neutral territory, suggesting room for further price appreciation. However, the Stochastic Oscillator's %K at 45.19 and %D at 53.18 presents a bearish crossover, indicating potential downward momentum. The MACD histogram is positive, but the fact that it's trending downwards on this timeframe, coupled with the Stochastic signal, suggests that the upward momentum might be waning. The ADX at 26.17 still points to a strong trend, but the conflicting signals from RSI and Stochastic require traders to be cautious. The market sentiment appears to be leaning towards a cautious approach, with many traders watching for confirmation before committing to a significant directional bet.
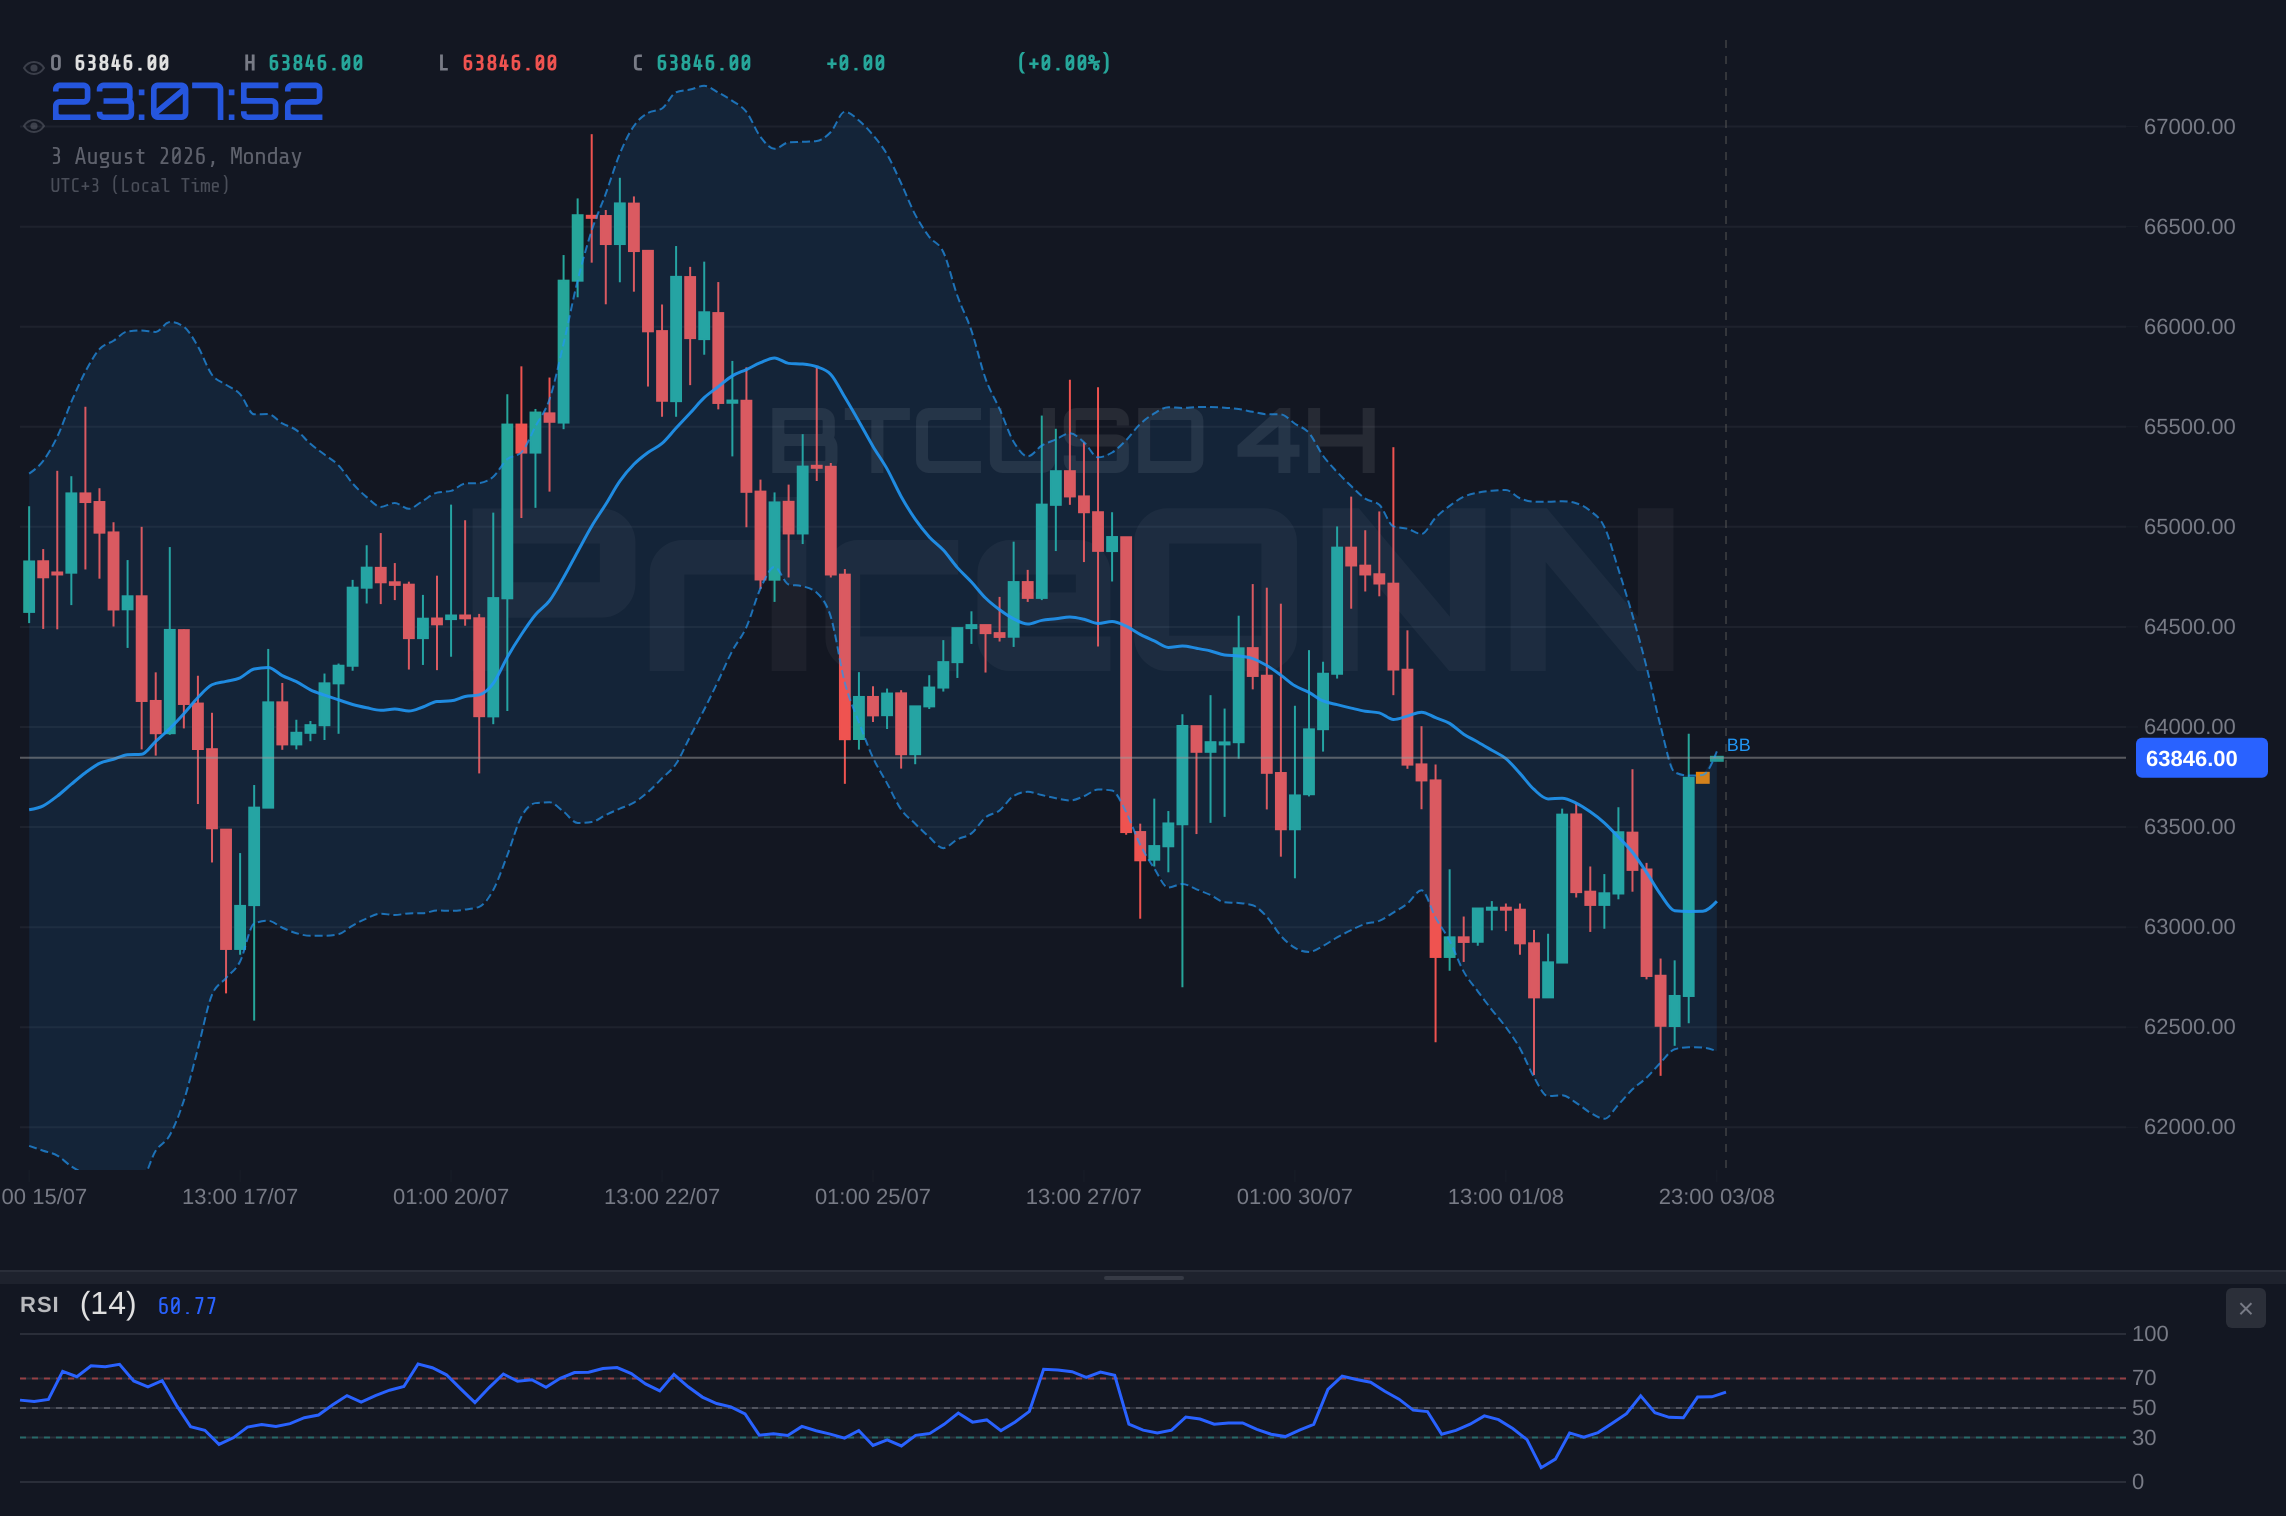
The daily chart for BTCUSD, currently trading at $63,850.00, paints a picture of a market that has experienced a significant run-up but is now facing resistance. The RSI at 49.23 is in neutral territory, neither indicating overbought nor oversold conditions, which is typical for a market consolidating after a strong move. The MACD is showing negative momentum with the MACD line below the signal line, suggesting a bearish bias on this longer timeframe. The Stochastic Oscillator, with %K at 30.56 and %D at 27.25, is flashing a bullish signal as %K crosses above %D, but it's still in the lower range, indicating potential for a recovery. The ADX at 15.81 suggests a weak trend, which aligns with the consolidation observed. This complex mix of signals across different timeframes highlights the indecision currently present in the market.
Navigating the Resistance: $63,845.33 as a Critical Barrier
The immediate focus for BTCUSD traders is the resistance level at $63,845.33. This price point has been a consistent ceiling, and a decisive break above it is crucial for any sustained bullish continuation. Historically, when Bitcoin has approached such significant resistance zones, a period of consolidation or a sharp pullback often follows if buying pressure isn't strong enough to overcome the selling. The current market data shows that the immediate resistance is $63,975.67, followed by $64,103.33 and $64,222.67. A clear breach and hold above these levels would be necessary to invalidate the bearish signals observed on longer timeframes and to rekindle bullish sentiment.
Conversely, the support levels are equally important for understanding the downside risk. On the 1-hour chart, immediate support is found at $63,728.67, followed by $63,609.33 and $63,481.67. A break below $63,481.67 would likely trigger stop-loss orders and could lead to a more significant price drop, potentially retesting lower levels. The 4-hour support levels are $62,430.67, $62,205.33, and $62,003.67, representing a more substantial downside target if the current bullish momentum falters completely. The daily support levels are even lower, starting at $62,875.33, then $62,276.67, and $61,905.33. The proximity of these levels to the current price action underscores the importance of risk management in any trading strategy right now.
The interplay between these support and resistance levels, viewed through the lens of the provided technical indicators, paints a picture of a market at a crossroads. The strong ADX readings across multiple timeframes suggest that when a trend does emerge, it could be significant. However, the conflicting signals from RSI and Stochastic, particularly the overbought conditions on the 1H chart and the bearish crossover on the 4H, suggest that the immediate path of least resistance might be sideways or slightly downwards until a clearer catalyst emerges. This is not the time for aggressive directional bets; rather, it's a period that calls for patience and a focus on defined risk parameters.
The Macroeconomic Undercurrents: DXY and Inflation Concerns
While the technicals provide a granular view, the broader macroeconomic landscape cannot be ignored. The Dollar Index (DXY), currently trading at 99.97, is showing a neutral-to-bullish bias. A stronger dollar typically exerts downward pressure on risk assets like Bitcoin, as it makes dollar-denominated assets more expensive for holders of other currencies. The DXY's current position, hovering around the 100 mark, is a critical psychological level that historically influences global markets. If the dollar strengthens further, it could contribute to a downside move in BTCUSD, especially if it coincides with risk-off sentiment in the broader equity markets.
The persistent concerns around inflation, though perhaps easing from their peaks, continue to shape central bank policy expectations. While specific inflation data (CPI, PCE) and employment figures (NFP) are not provided in the immediate market data, the general understanding is that central banks remain vigilant. Any hints of persistent inflation could lead to expectations of prolonged higher interest rates, which generally dampens appetite for riskier assets like cryptocurrencies. Conversely, signs of cooling inflation could pave the way for potential rate cuts, a scenario that has historically been supportive of Bitcoin's price appreciation. The market is keenly awaiting any new economic data releases or central bank commentary that could clarify the future path of monetary policy.
The correlation between Bitcoin and traditional risk assets, particularly the S&P 500 and Nasdaq, remains a crucial factor. The S&P 500 is currently showing a positive daily change of 0.74% at 6572.87, indicating a risk-on sentiment in equities. Similarly, the Nasdaq 100 is up 2.03% at 28776.77, further reinforcing this positive risk appetite. Historically, Bitcoin has often moved in tandem with these indices, especially with the advent of Bitcoin ETFs, which have integrated it more closely into the traditional financial system. A sustained rally in equities could provide a tailwind for BTCUSD, while a reversal in stock markets might drag Bitcoin lower, despite any bullish technical signals.
On-Chain Metrics and Market Sentiment: A Deeper Dive
Beyond price action, on-chain data provides invaluable insights into the health of the Bitcoin network and investor behavior. While specific on-chain metrics like active addresses, whale movements, or exchange flows are not detailed in the provided market data, their general significance cannot be overstated. An increase in active addresses and significant accumulation by large holders (whales) are typically bullish signals, indicating growing network adoption and confidence. Conversely, large outflows to exchanges or a decrease in active addresses can signal potential selling pressure or a decline in network activity. Traders often look for confluence between on-chain data and price action to confirm trends.
The current market sentiment, as reflected in the technical indicators and price action, appears to be cautiously optimistic but hesitant to commit to a strong directional move. The RSI hovering in the mid-range across timeframes, coupled with mixed signals from MACD and Stochastic, suggests a period of indecision. This often occurs when the market is processing conflicting information – strong technical uptrends on shorter timeframes versus potential overbought conditions and resistance levels on longer ones, all while macro factors remain in flux. The lack of a clear, universally agreed-upon narrative makes it challenging for many participants to make bold decisions.
The concept of Bitcoin dominance is also a key factor to consider, especially in the context of altcoin performance. While not explicitly provided, a rising Bitcoin dominance usually implies that capital is flowing into Bitcoin at the expense of altcoins, often seen as a sign of market consolidation or a flight to perceived safety within the crypto space. Conversely, a falling dominance might indicate that altcoins are outperforming Bitcoin, possibly signaling a more risk-on appetite within the crypto market. At current levels, understanding BTC dominance would help gauge the broader crypto market's health and potential opportunities in the altcoin space.
Trade Scenarios and Risk Management
Given the current technical picture and market conditions, it's prudent to outline potential scenarios. The primary focus remains on the $63,845.33 resistance. A bullish scenario would involve a decisive close above this level, ideally with increasing volume, confirming a breakout. Such a move would likely target the next resistance at $63,975.67 and potentially higher levels, invalidating the bearish signals and reigniting upward momentum. This scenario would be supported by a weakening DXY and continued strength in equity markets.
Bearish Reversal: Testing Lower Support
65% ProbabilityConsolidation Phase: Range-Bound Trading
25% ProbabilityBullish Breakout: Confirmed Upside Move
10% ProbabilityA neutral scenario would see BTCUSD continue to trade within a defined range, likely between the immediate support at $63,481.67 and the resistance at $63,845.33. This could be a period of accumulation or distribution before the next significant move. In such a scenario, traders might look for scalping opportunities within the range, focusing on short-term price action and tighter risk management.
The bearish scenario hinges on the failure to break the $63,845.33 resistance. If BTCUSD closes below the immediate support at $63,728.67, and more importantly, below $63,481.67, it would likely signal a deeper correction. The targets in this case would extend to the daily support levels, potentially retesting areas around $62,875.33 or even lower. This scenario would be more probable if the DXY strengthens significantly or if there's a negative shock from upcoming economic data or geopolitical events.
Frequently Asked Questions: BTCUSD Analysis
What happens if BTCUSD breaks above the $63,845.33 resistance level?
A decisive break and sustained hold above $63,845.33, targeting $63,975.67, would invalidate near-term bearish signals. This could trigger further upside momentum, potentially retesting the $64,103.33 and $64,222.67 resistance levels, especially if equity markets remain strong and the DXY shows weakness.
Should I buy BTCUSD at current levels of $63,850.00, given the mixed signals?
Buying at current levels requires careful risk management due to the strong resistance at $63,845.33 and mixed signals across timeframes. A more prudent approach might be to wait for a confirmed breakout above resistance or a clear retest and hold of support around $63,481.67. The probability of a bearish scenario is currently higher, suggesting caution.
Is RSI at 63.33 a sell signal for BTCUSD right now?
An RSI of 63.33 on the 1-hour chart indicates strong bullish momentum but is not yet in extreme overbought territory. While it suggests the price has moved up significantly, it doesn't automatically signal a sell. However, combined with the overbought Stochastic (88.74) and resistance at $63,845.33, it highlights potential for a short-term pullback or consolidation.
How will the current DXY strength affect BTCUSD this week?
The DXY at 99.97 is showing a neutral-to-bullish stance, which generally creates headwinds for risk assets like BTCUSD. If the dollar index continues to climb towards the 100 mark, it could increase selling pressure on Bitcoin, potentially pushing it towards its support levels. Conversely, a weakening DXY would likely support a bullish move for BTCUSD.
The path forward for BTCUSD hinges on its ability to decisively break through the $63,845.33 resistance or hold key support levels around $63,481.67. Traders must remain disciplined, manage their risk meticulously, and wait for clear signals. The market is dynamic, and while current indicators present a complex picture, the confluence of technical levels, macroeconomic factors, and on-chain activity will ultimately dictate the next significant move. Patience and a data-driven approach are key to navigating these choppy waters and capitalizing on potential opportunities.
| Indicator | Value | Signal | Interpretation |
|---|---|---|---|
| RSI (14) | 63.33 | Neutral | Approaching overbought, watching resistance |
| MACD Histogram | +0.59 | Bullish | Positive momentum, but trending down on 4H |
| Stochastic | K=88.74, D=88.32 | Bearish | Overbought on 1H, potential pullback |
| ADX | 26.27 | Bullish | Strong trend, but needs confirmation on breakout |
| Bollinger | Upper Band | Watch | Price testing upper band, potential reversal zone |
Key Levels
Support Levels
Resistance Levels
Track markets in real-time
AI-powered analysis, technical indicators and real-time price data.
Join Our Telegram Channel
Breaking market news, AI analysis and trading signals instantly.
Join Channel