

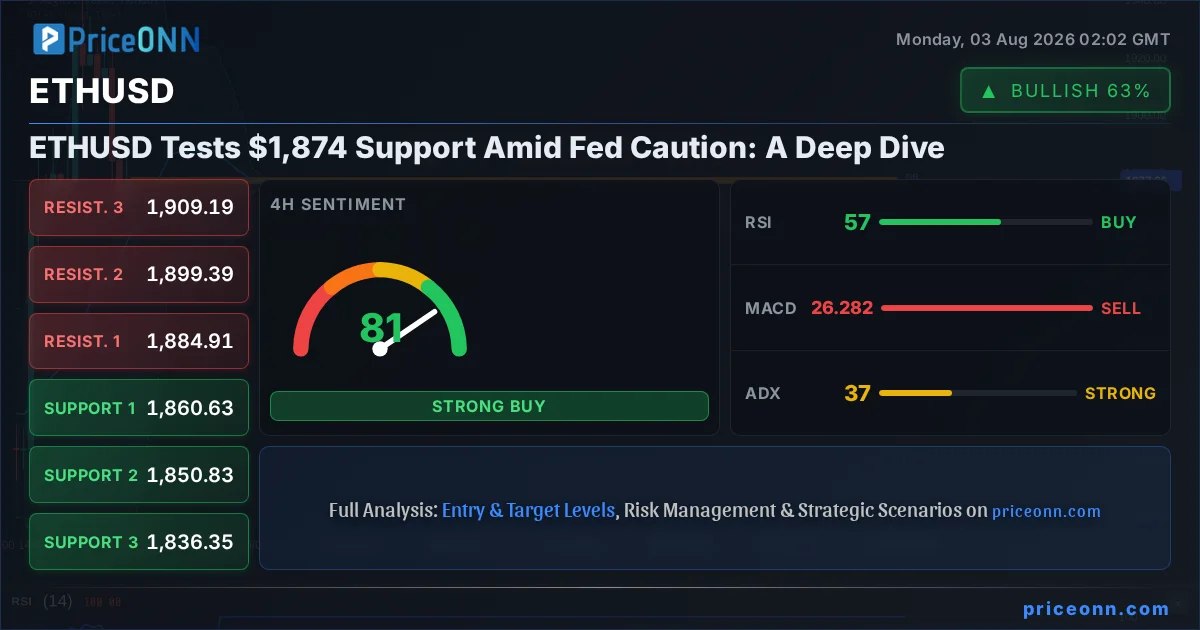
The Federal Reserve's cautious stance on inflation, coupled with lingering geopolitical tensions, is casting a shadow over risk assets, and Ethereum (ETHUSD) is no exception. As the primary symbol for today's analysis, ETHUSD is currently trading precariously close to a critical support level at $1,874. This price point is not just a random number; it represents a significant confluence of technical factors and market sentiment that could dictate the short-to-medium term trajectory of the second-largest cryptocurrency. Understanding the interplay between macroeconomics, broader market correlations, and Ethereum's specific on-chain dynamics is crucial for navigating this pivotal moment. The market is at a crossroads, and the signals emerging from the data warrant a detailed examination.
- ETHUSD is testing the $1,874 support level, with the 4-hour RSI at 56.88 indicating a neutral-to-bullish trend, but facing downward pressure.
- The current price of $1,877.38 is hovering just above key support zones, while resistance lies at $1,891.84 on the 1-hour chart.
- DXY at 100.7 is showing signs of upward momentum on the 1-hour chart, potentially pressuring risk assets like ETHUSD.
- The Nasdaq 100's 1-hour trend is bearish at 32.77 RSI, suggesting a risk-off environment that could impact crypto markets.
- A confirmed close above $1,891.84 would be needed to invalidate the current bearish pressure and signal a potential upward move for ETHUSD.
The recent market action, particularly the 2.28% daily drop in ETHUSD to $1,877.38, underscores the fragility of crypto's recovery. While the 1-day chart RSI at 59.95 and Stochastic at 84.55 suggest underlying bullish momentum and potential for further upside, the immediate pressure is undeniable. This divergence between short-term weakness and longer-term bullish signals is a classic sign of market indecision, amplified by external macroeconomic factors. The Federal Reserve's recent communications have been decidedly cautious, hinting at a prolonged period of higher interest rates to combat persistent inflation. This narrative directly impacts risk assets, as higher rates increase the cost of capital and reduce the present value of future earnings, making assets like Ethereum less attractive to institutional investors.
Macroeconomic Headwinds and Crypto Correlations
DXY Strength and Risk Appetite
The US Dollar Index (DXY) provides a crucial lens through which to view the broader market sentiment. Currently at 100.7, the DXY's upward trajectory on the 1-hour chart, supported by a 56.6 RSI, signals increasing demand for the dollar. Historically, a strengthening dollar often correlates with a risk-off environment, leading to outflows from riskier assets like cryptocurrencies and commodities. This inverse relationship is particularly evident when considering gold (XAUUSD), which has seen a notable 1.46% daily decline to $4,001.21, with its 1-hour RSI at 37.81 and ADX at 20.26, indicating a bearish trend under pressure. Similarly, major stock indices are showing signs of strain. The Nasdaq 100, a bellwether for tech and growth stocks, is down 1.16% on the day, with its 1-hour RSI at a low 32.77, painting a picture of declining risk appetite. This macro backdrop creates a challenging environment for ETHUSD, as capital tends to rotate towards perceived safe-haven assets during periods of economic uncertainty.
Inflationary Concerns and Central Bank Policy
The persistent inflation figures continue to be a primary concern for central banks globally, especially the US Federal Reserve. While specific Fed meeting minutes or rate decisions are not detailed in the provided data, the general market sentiment points towards a 'higher for longer' interest rate environment. This is crucial for ETHUSD because it affects the cost of capital for investors and institutions looking to deploy funds into digital assets. Furthermore, the correlation between crypto markets and traditional risk assets, particularly tech stocks like the Nasdaq 100, means that any negative sentiment driven by macroeconomic factors will likely spill over. The Nasdaq 100's weakness, seen in its 1-hour trend and MACD signals, suggests that speculative capital may be retreating, a trend that typically weighs on altcoins and even Bitcoin. The current price action for ETHUSD, hovering around $1,877.38, reflects this broader uncertainty, with traders hesitant to commit significant capital without clearer macroeconomic signals or a stronger technical breakout.
Ethereum's On-Chain and Technical Posture
Short-Term Technicals: A Battle for $1,874
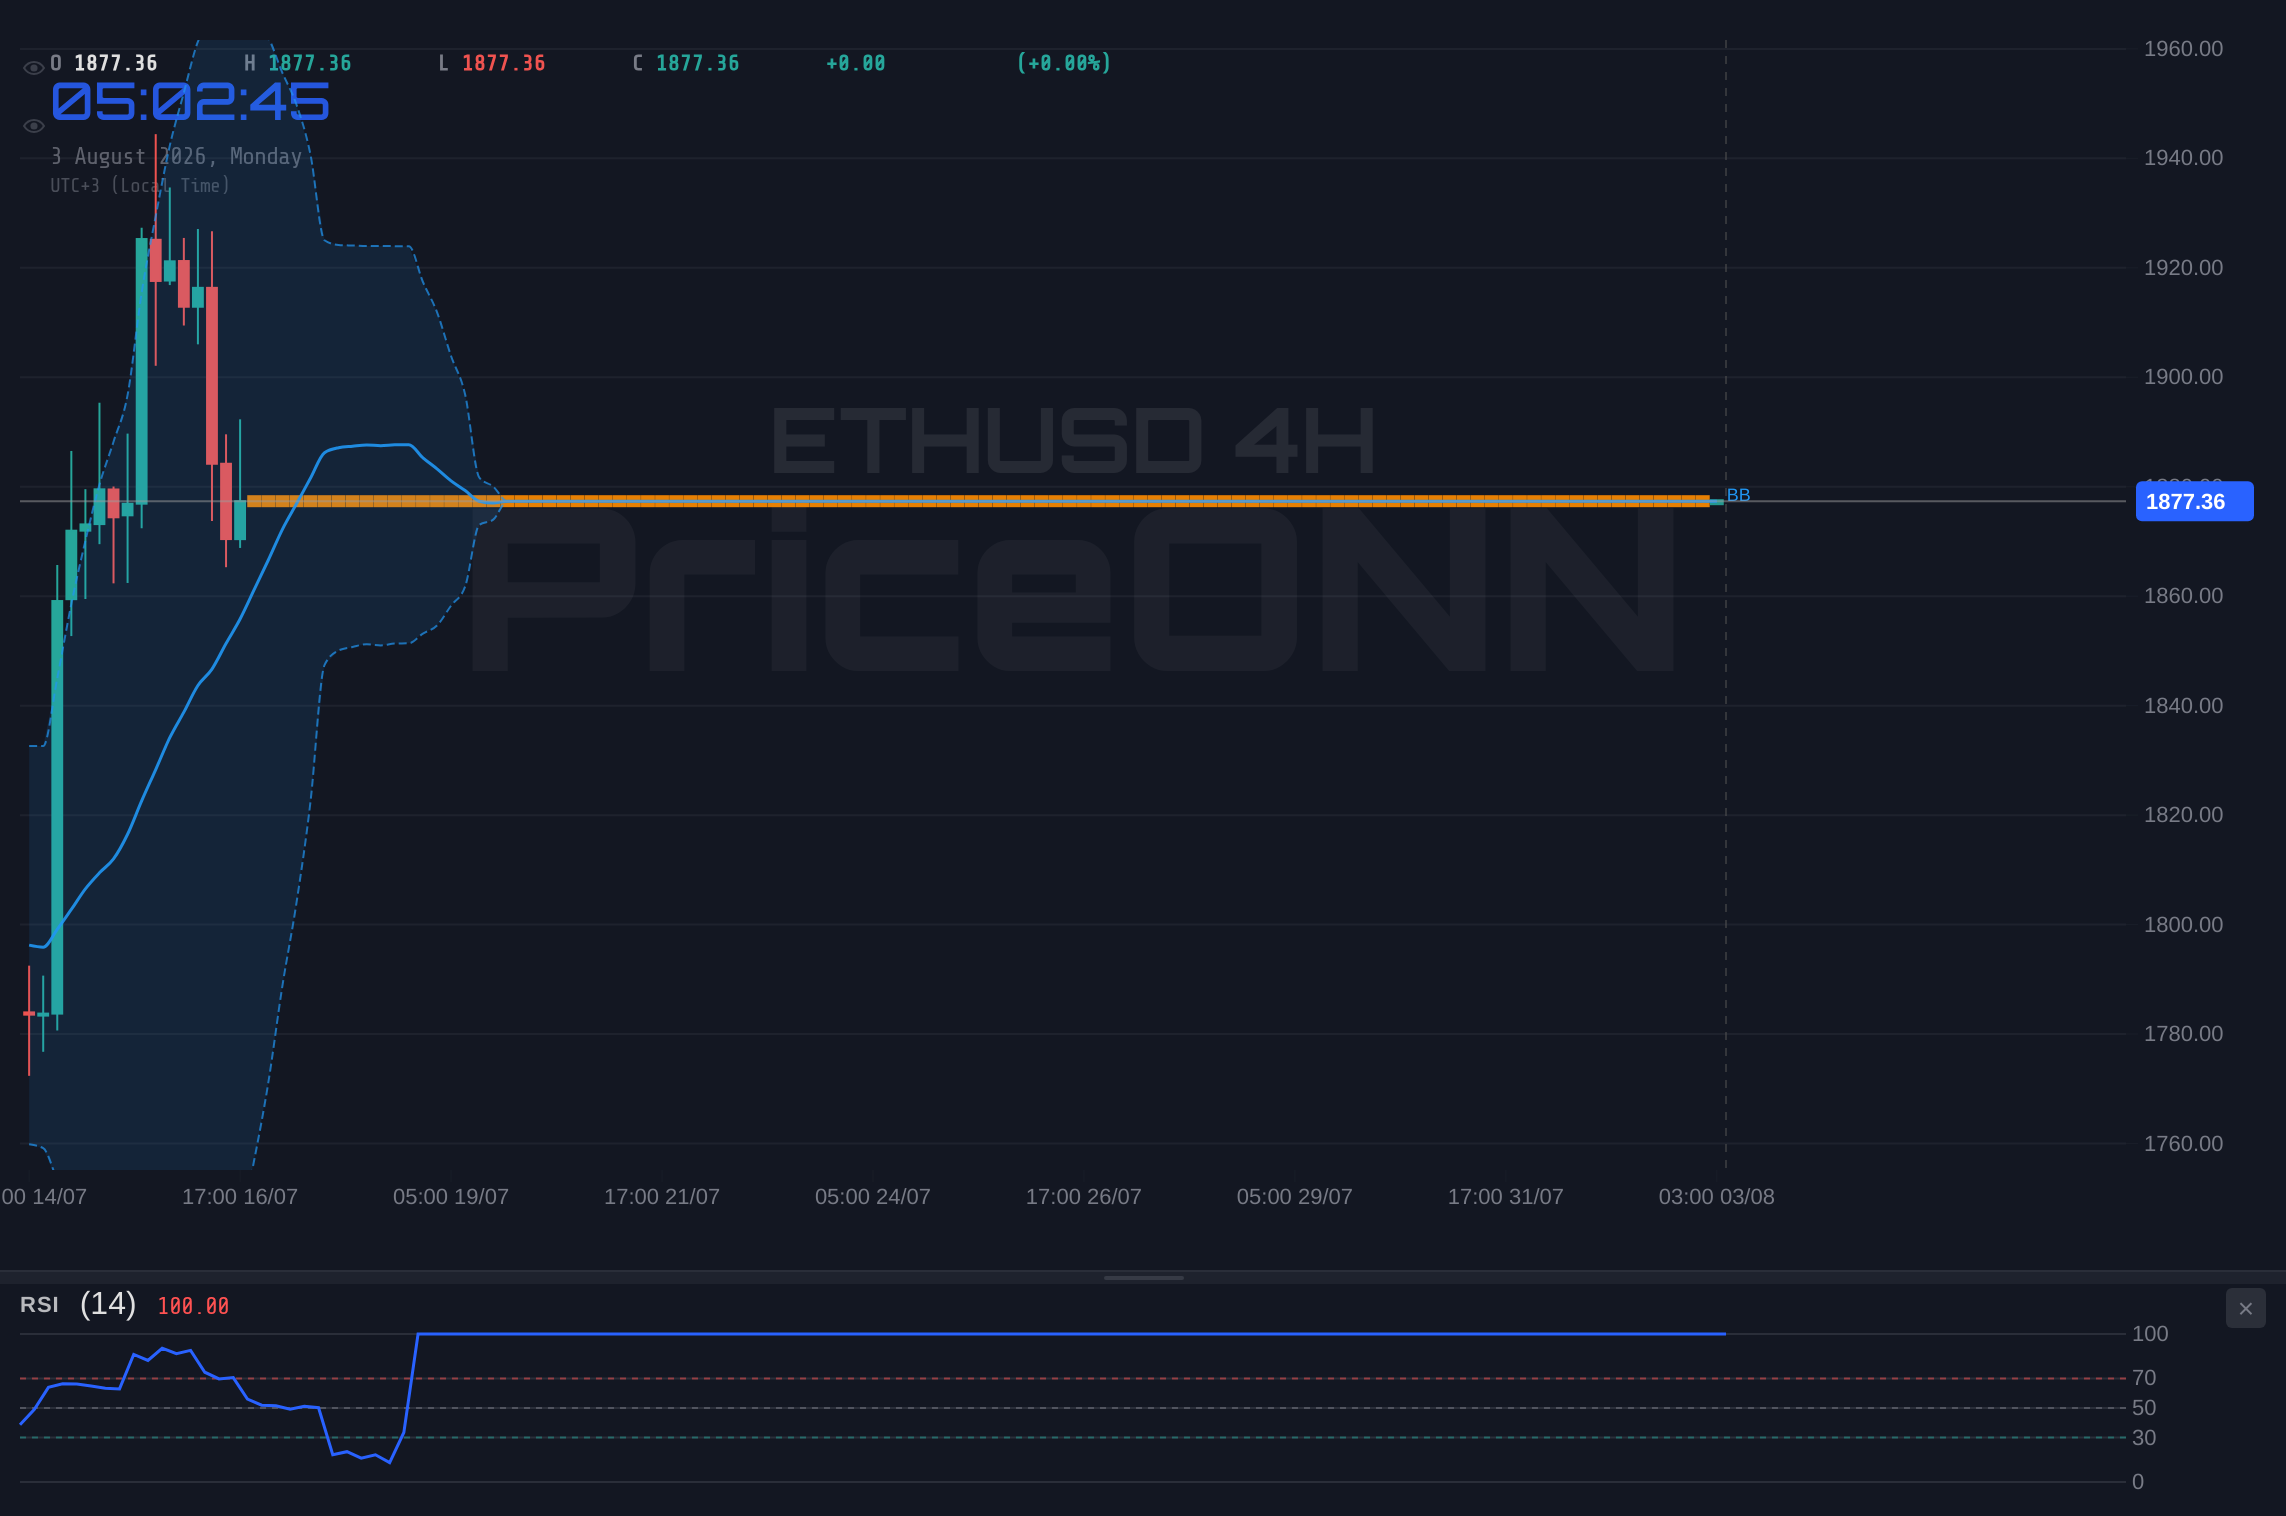
On the 1-hour timeframe, ETHUSD is exhibiting mixed signals, a common occurrence during periods of consolidation or transition. The price is currently trading just above the $1,874 support level, a level that has seen some action. The RSI at 39.48 indicates a move away from oversold conditions but is still below the 50-neutral line, suggesting bearish momentum is still present, though potentially waning. The MACD is below its signal line, reinforcing the short-term bearish tone. However, the Stochastic oscillator is showing a potential bullish reversal signal, with %K at 26.28 crossing above %D at 20.63, hinting at a possible short-term bounce. The ADX at 29.09 points to a strong downtrend on this timeframe, which means any potential bounce might be met with selling pressure. The overall signal on this timeframe is SAT, leaning towards caution.
Mid-Term Indicators: A Glimmer of Hope?
Shifting to the 4-hour chart, the picture for ETHUSD becomes slightly more constructive, though still cautious. The price is above the $1,874 support, and the RSI at 56.88 is comfortably in neutral territory, leaning towards bullish. The MACD is negative but showing signs of potentially crossing its signal line, which could signal a shift in momentum. The Stochastic, however, is giving a bearish signal with %K at 18.24 below %D at 57.76, indicating potential further downside on this timeframe. The ADX at 25.63 suggests a strong uptrend, which is somewhat contradictory to the bearish Stochastic signal. The overall signal for the 4-hour timeframe is AL. This mixed bag of signals highlights the current indecision in the market, where short-term bearish pressures are battling against longer-term bullish undercurrents.
Long-Term Trend: The Bullish Foundation
The daily chart for ETHUSD presents the most optimistic outlook, albeit with the caveat of current short-term weakness. The price at $1,877.38 is supported by a strong daily uptrend, as indicated by the ADX at 22.66. The RSI at 59.95 is in bullish territory, and the Stochastic oscillator is showing a strong bullish signal with %K at 84.55 above %D at 79.73, suggesting further upside potential. The MACD is positive and above its signal line, reinforcing the bullish momentum on this timeframe. The Bollinger Bands are also indicating an uptrend, with the price trading above the middle band. This longer-term bullish structure provides a foundation for a potential recovery, but it hinges on ETHUSD holding the critical $1,874 support level and overcoming the immediate bearish headwinds.
On-Chain Metrics and Ecosystem Developments
Active Addresses and Transaction Volume
Examining on-chain data for Ethereum provides vital context to the price action. While specific real-time on-chain metrics like active addresses or transaction volume are not provided, we can infer potential trends. A sustained price decline, even if minor, often correlates with a decrease in active addresses and transaction counts, as speculative interest wanes. Conversely, a recovery from support levels typically coincides with a resurgence in network activity. If ETHUSD can hold the $1,874 support and begin to rally, we would expect to see an increase in active addresses and transaction fees (gas prices), indicating renewed network engagement. Currently, the subdued price action suggests that network activity might be mirroring the cautious sentiment seen in the price charts, with neither a significant influx nor outflow of users.
Whale Movements and Exchange Flows
The behavior of large holders, or 'whales', is a critical indicator for cryptocurrencies. Significant movements of ETH from whale wallets to exchanges could signal an intention to sell, putting downward pressure on the price. Conversely, whales accumulating ETH or moving it to cold storage suggests confidence in the asset's future appreciation. Without direct data on whale movements and exchange flows, we must rely on price action as a proxy. The current probing of the $1,874 support, coupled with the broader risk-off sentiment, might be seeing some cautious positioning from larger players. However, a decisive break below this level, especially with increased volume on exchanges, would be a strong bearish signal from the whale community. Until then, the ambiguity in price action suggests that large holders are also in a 'wait-and-see' mode.
DeFi and NFT Ecosystem Health
The underlying health of the Ethereum ecosystem, particularly its Decentralized Finance (DeFi) and Non-Fungible Token (NFT) sectors, plays a crucial role in ETHUSD's long-term value proposition. A thriving DeFi ecosystem, measured by Total Value Locked (TVL) and the volume of transactions across decentralized exchanges (DEXs) and lending protocols, supports demand for ETH as collateral and gas currency. Similarly, vibrant NFT markets contribute to network activity and fee generation. While recent data on these specific metrics isn't provided, any significant slowdown in DeFi or NFT activity would negatively impact ETH's fundamental outlook. Conversely, innovation and growth in these sectors, even amidst broader market choppiness, can provide a strong fundamental tailwind. The current price action doesn't suggest a major ecosystem collapse, but sustained weakness in ETHUSD could eventually dampen enthusiasm and investment in these crucial areas.
Trade Scenarios and Risk Management
Bearish Scenario: The $1,874 Support Break
60% ProbabilityNeutral Scenario: Consolidation Around $1,877
25% ProbabilityBullish Scenario: Recovery from Support
15% ProbabilityNavigating the Current Technical Landscape
The immediate focus for ETHUSD traders is the $1,874 support level. On the 1-hour chart, a break below this could trigger a cascade towards the $1,860-$1,850 region, as indicated by the 4-hour support levels. The bearish signals on the 1-hour timeframe, including the MACD and RSI below 50, support this downside risk. Invalidation of this bearish thesis would occur if ETHUSD manages to reclaim and hold above the $1,891.84 resistance. A successful break and hold above this level, particularly on increased volume, could signal a short-term reversal, targeting higher resistance levels like $1,903.83 and potentially $1,915.34. The neutral scenario anticipates a period of consolidation, where price action remains tight between the immediate support and resistance, offering limited trading opportunities but potentially setting the stage for a more decisive move later.
The Role of Macroeconomic Drivers
The probability assigned to each scenario is heavily influenced by the macroeconomic outlook. The current strength in the DXY (100.7) and the bearish sentiment in the Nasdaq 100 (RSI 32.77 on 1H) lend weight to the bearish scenario. If this risk-off environment persists, capital is likely to continue flowing away from assets like ETHUSD. Conversely, any signs of a Fed pivot, a cooling in inflation data, or a stabilization in global risk appetite could shift the probabilities towards the neutral or even bullish scenarios. For instance, a weaker-than-expected US jobs report or a dovish shift in Fed commentary could alleviate pressure on ETHUSD and potentially fuel a recovery. Traders must remain attuned to these macro signals, as they are currently the dominant force shaping the price action around this critical $1,874 support level.
Risk Management is Paramount
Given the conflicting signals across different timeframes and the significant macroeconomic uncertainty, disciplined risk management is paramount. For traders considering a bearish position, a clear invalidation level above the current price, such as a close above $1,891.84, is essential. Stop-losses should be strategically placed to mitigate potential losses if the market reverses unexpectedly. For those anticipating a bounce, entry triggers should be confirmed by bullish price action and ideally supported by a shift in macro sentiment. Waiting for a confirmed daily close above $1,891.84, as outlined in the bullish scenario, would offer a higher probability setup. In a consolidation scenario, traders might look for range-bound strategies, but with the understanding that a breakout or breakdown is inevitable and requires a reassessment of positions.
Frequently Asked Questions: ETHUSD Analysis
What happens if ETHUSD breaks below the $1,874 support level?
If ETHUSD experiences a decisive daily close below $1,874, the bearish scenario becomes more probable. This could trigger a move towards the 4-hour support levels at $1,860.63 and $1,850.83. The current macroeconomic climate, with a strong DXY at 100.7, supports such a downward move.
Should I consider buying ETHUSD at current levels around $1,877.38 given the RSI at 59.95?
While the daily RSI at 59.95 suggests underlying bullish momentum, the immediate price action is testing support. A cautious approach is warranted. Waiting for confirmation, such as a sustained close above $1,891.84 or a clear shift in macro sentiment, would offer a more robust entry signal than buying at current levels with significant downside risk.
Is the MACD signal on the 1-hour chart (negative momentum) a sell signal for ETHUSD?
The negative MACD momentum on the 1-hour chart, alongside an RSI below 50, does indicate short-term bearish pressure. However, it should be considered alongside longer-term signals and the critical $1,874 support. A bearish MACD signal alone is not a definitive sell signal, especially when contradicted by longer-term bullish indicators or a strong support level holding.
How will the current DXY strength at 100.7 affect ETHUSD's price action this week?
The rising DXY at 100.7 typically correlates with a risk-off environment, which tends to put downward pressure on assets like ETHUSD. If the dollar continues to strengthen, it increases the likelihood of ETHUSD testing and potentially breaking below its key support levels as capital seeks safer havens.
The market is currently at a critical juncture for ETHUSD. While longer-term indicators suggest a bullish foundation, the immediate bearish pressures stemming from macroeconomic uncertainty and a strengthening dollar cannot be ignored. The $1,874 support level is the line in the sand; its defense or failure will likely dictate the next significant price movement. Traders and investors must remain vigilant, monitor both technical levels and macro catalysts, and prioritize risk management above all else. Patience and discipline will be key in navigating these choppy waters, waiting for clearer signals before committing substantial capital.
Track markets in real-time
AI-powered analysis, technical indicators and real-time price data.
Join Our Telegram Channel
Breaking market news, AI analysis and trading signals instantly.
Join Channel