

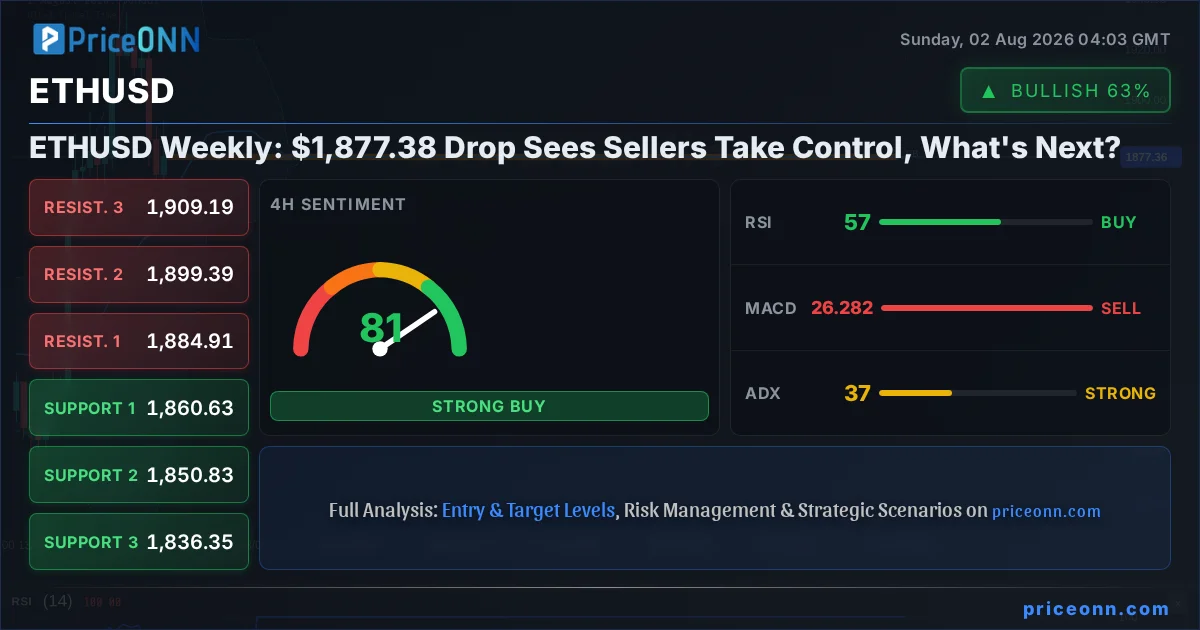
The Ethereum network, represented by its native token ETHUSD, saw a challenging week as the price shed 2.28% to close around $1,877.38. This decline wasn't a gentle dip; it was a decisive move that saw sellers firmly establish control, pushing the asset into a bearish trend on multiple higher timeframes. While the 1-hour chart shows some tentative signs of stabilization, the overwhelming sentiment across the 4-hour and daily charts points towards continued downward pressure. This analysis delves into the technical indicators, crucial support and resistance levels, and the broader market context to decipher the path forward for ETHUSD.
- ETHUSD experienced a -2.28% drop this week, closing at $1,877.38, with a clear bearish trend on daily and 4-hour charts.
- Key support levels are being tested, with the immediate floor at $1,868.34, while resistance looms at $1,891.84 on the 1-hour chart.
- Technical indicators show mixed signals on the short-term, but a prevailing bearish sentiment on longer timeframes suggests caution for bulls.
- The correlation with DXY and broader market risk appetite will be crucial in determining ETHUSD's next move as traders await key economic data.
This past week, ETHUSD found itself under significant selling pressure, a stark contrast to the more neutral or bullish undertones seen in some other crypto assets. The price action saw a notable decline from its weekly high of $1927.09 down to $1865.30, ultimately settling at $1,877.38. This drop of $43.81 represents a substantial move in percentage terms and has shifted the technical landscape considerably. The question on many traders' minds is whether this is a temporary pullback within a larger uptrend or the beginning of a more significant correction. Analyzing the data, particularly the multi-timeframe signals, provides crucial insights into the current market structure and potential future movements.
The 1-hour timeframe for ETHUSD presents a somewhat conflicted picture, a common occurrence during periods of market transition. While the overall trend is classified as neutral with a 50% strength, the technical indicators paint a mixed palette. The RSI(14) at 39.48 hovers in neutral territory but leans towards a bearish inclination, suggesting that while not yet oversold, the downward momentum is palpable. MACD confirms this, showing negative momentum with the MACD line below its signal line, indicating selling pressure. Bollinger Bands are trading below the middle band, reinforcing the bearish tilt on this very short-term view. However, the Stochastic Oscillator offers a glimmer of hope for bulls, with the %K line at 26.28 and %D at 20.63, suggesting a potential upward cross and a move out of oversold conditions. The ADX at 29.09, however, indicates a strong downtrend, which contradicts the potential bullish signal from Stochastic. This conflict highlights the need to look at higher timeframes for a clearer directional bias.
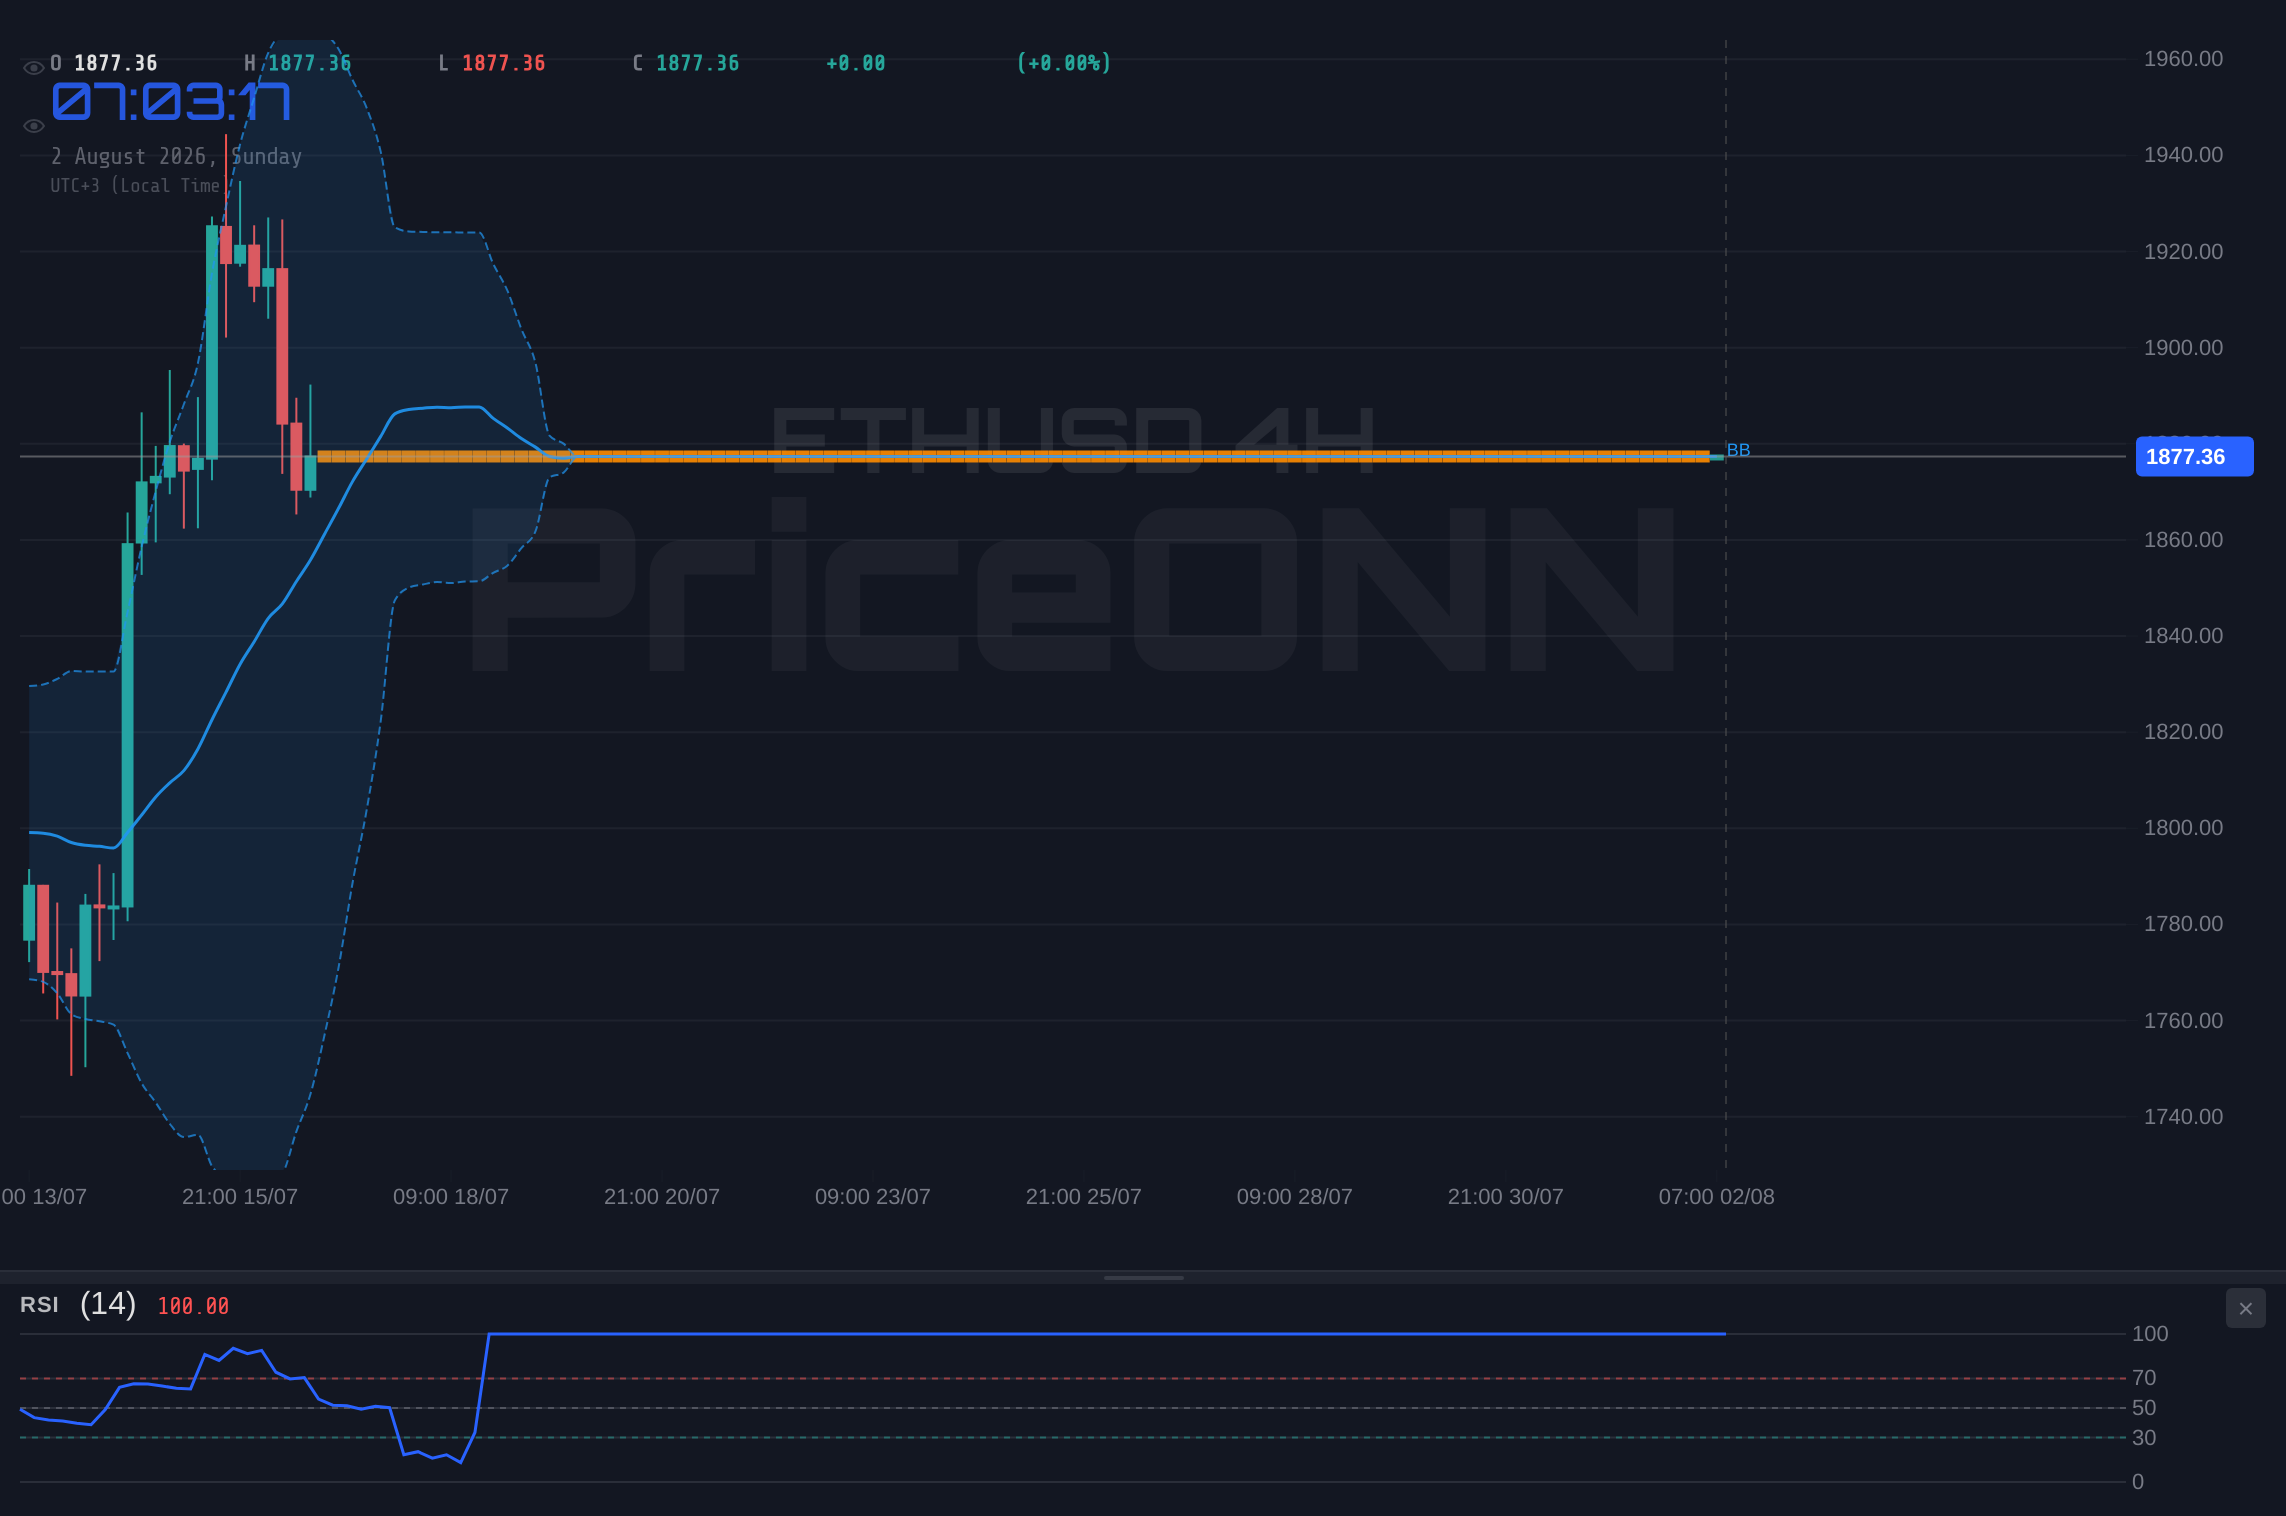
Moving to the 4-hour timeframe, the picture becomes clearer and decidedly more bearish for ETHUSD. The trend is classified as bullish with a strength of 94%, but this seems to be a remnant of previous upward momentum rather than a current conviction. The price is currently trading within a range defined by immediate support at $1860.63 and resistance at $1884.91. The RSI(14) is at 56.88, still in neutral territory but showing a slight upward eğilim, which could be interpreted as lingering buying interest or simply a pause in the decline. The MACD, however, is more concerning, displaying negative momentum with the MACD line below its signal line, and Bollinger Bands are trading below the middle band, indicating downward pressure. The Stochastic Oscillator is giving a bearish signal with K at 18.24 and D at 57.76, suggesting further downside potential. The ADX at 36.73 signals a strong uptrend, which is a stark contradiction to the other indicators and the general price action. This divergence between ADX and other indicators on the 4-hour chart suggests that while a trend might have been in place, its strength is being questioned, and the prevailing negative momentum from MACD and Stochastic warrants attention.
The daily timeframe for ETHUSD solidifies the bearish outlook, classifying the trend as bullish with a strength of 86%, but again, this likely reflects prior strength rather than current conviction. The immediate support is found at $1874.22, a level that was tested this week, with more significant support floors at $1827.25 and $1792.15. Resistance is faced first at $1956.29, then at $1991.39 and $2038.36. The RSI(14) at 59.95 is in the upper neutral zone, suggesting room for upward movement but also nearing overbought territory if the price were to recover significantly. The MACD, crucially, shows positive momentum with the MACD line above its signal line, a bullish sign that contradicts the recent price action. However, Bollinger Bands are trading above the middle band, indicating a general upward bias. The Stochastic Oscillator is giving a strong bullish signal with K at 84.55 and D at 79.73, indicating a potential upward trend continuation. The ADX at 22.66 signifies a medium-strength uptrend. Despite the bullish signals from MACD, Stochastic, and ADX on the daily chart, the recent price action and the bearish signals on the shorter timeframes suggest that these bullish indicators might be lagging or about to reverse. The overall picture is one of caution, where the established uptrend is being severely tested.
Navigating the Current Market Storm: What the Indicators Tell Us
The confluence of indicators on ETHUSD presents a classic case of conflicting signals across different timeframes, a scenario that demands careful interpretation rather than blind adherence to any single metric. On the shortest timeframe, the 1-hour chart, we see a battleground where a bearish MACD and Bollinger Band setup is being challenged by a potentially turning Stochastic oscillator. The ADX, however, stubbornly points to a strong downtrend, suggesting that any short-term bounce might be a mere correction within a larger downward move. This is where experienced traders will look for confirmation; a sustained break above the immediate resistance at $1891.84 would be needed to invalidate the bearish short-term outlook, while a push towards the support at $1868.34 could signal further downside.
The 4-hour chart, while still showing a bullish trend classification, is flashing warning signs. The MACD's negative momentum and the bearish Stochastic signal are significant, indicating that the underlying pressure is to the downside, despite what the ADX might suggest about trend strength. This divergence is critical. It implies that the market participants who drove the previous uptrend may be losing conviction, or new sellers are entering the market. The RSI at 56.88, while not yet overbought, is also not showing the robust strength typically seen at the top of a strong uptrend. This suggests that the upside may be limited from current levels, and traders should be wary of chasing any rallies without clear confirmation of renewed buying interest.
On the daily chart, the bullish signals from MACD and Stochastic are more established, reflecting the longer-term uptrend that ETHUSD has been in. However, the recent price action, which saw a significant drop, cannot be ignored. The RSI at 59.95 is still comfortably in neutral territory, offering room for upside if the bulls can regain control. The ADX at 22.66 indicates a medium-strength uptrend, which is consistent with a market that is consolidating or experiencing a healthy pullback rather than a full-blown reversal. The key here is to watch how price reacts to the immediate support levels. A failure to hold $1874.22 could invalidate the daily bullish setup and signal a deeper correction, potentially targeting the $1827.25 level.
DXY Strength and Equity Market Weakness: The Macro Backdrop
The broader macroeconomic environment continues to play a significant role in shaping the price action of assets like ETHUSD. The Dollar Index (DXY) has shown renewed strength, currently trading at 100.7. A rising DXY typically exerts downward pressure on risk assets, including cryptocurrencies and precious metals, as it signifies a stronger US dollar relative to a basket of major currencies. This inverse correlation means that as the dollar strengthens, assets priced in dollars, like ETHUSD, tend to become more expensive for holders of other currencies, potentially dampening demand.
Furthermore, the performance of major equity indices like the SP500 and Nasdaq100 cannot be overlooked. The SP500 is showing some resilience, trading at 6572.87 with a daily gain, but the Nasdaq100 has experienced a more significant drop, currently at 29164.86. This mixed performance in equities, with tech-heavy indices like the Nasdaq showing weakness, suggests a cautious or risk-off sentiment in the broader market. Cryptocurrencies, often perceived as high-risk assets, tend to suffer when there is a general deleveraging or a flight to safety. This environment, characterized by a strengthening dollar and potential weakness in tech stocks, creates headwinds for ETHUSD, making it harder for the cryptocurrency to attract significant inflows.
The energy sector, represented by Brent crude oil at $83.79, is also a crucial indicator, often acting as a barometer for inflation expectations and geopolitical risks. The recent dip in oil prices, though not dramatic, adds another layer of complexity. Higher oil prices can fuel inflation concerns, potentially leading to more hawkish central bank policies, which would typically be negative for risk assets. Conversely, falling oil prices might ease inflation fears but could also signal weakening global demand, which is detrimental to economic growth and risk appetite. The current neutral stance on oil, with conflicting signals across timeframes, means it's not providing a clear directional bias for ETHUSD but highlights the underlying global economic uncertainties.
Key Levels and Price Action: Where the Battle Lines Are Drawn
For ETHUSD, the $1,877.38 mark is more than just a price point; it's a critical juncture where the tug-of-war between buyers and sellers is playing out intensely. On the 1-hour chart, the immediate support at $1868.34 is the first line of defense for the bulls. A decisive breach of this level would likely trigger further selling, potentially targeting the next support at $1856.83. Conversely, resistance on this short-term timeframe is capped at $1891.84. A sustained move above this level would be the first sign that the immediate bearish pressure is easing, opening the door for a test of higher resistance levels.
The 4-hour chart paints a slightly different picture, with support more firmly established at $1860.63. This level has held previously and represents a more significant barrier to the downside. However, the bearish signals on this timeframe are concerning. The inability to reclaim the middle Bollinger Band, which is now acting as resistance around $1884.91, suggests that the selling pressure is persistent. If $1860.63 were to break, the next logical target would be $1850.83, a level that could see a more significant reaction from the market. Resistance on this timeframe is at $1884.91, and breaking above it would be a crucial first step for any bullish recovery.
On the daily chart, the established uptrend is being severely tested around the $1874.22 support level. This is a key area to watch. If ETHUSD can hold this level and show signs of bouncing, the bullish narrative for the daily timeframe remains intact, with targets potentially reaching towards $1956.29. However, a daily close below $1874.22 would be a strong bearish signal, invalidating the current uptrend and opening up the path towards the more significant support at $1827.25. The price action around these levels will be paramount in determining the short-to-medium term direction for ETHUSD.
Trade Decision: A Watchful Stance Amidst Conflicting Signals
Given the current technical landscape for ETHUSD, characterized by bearish short-term signals clashing with lingering bullish indicators on the daily timeframe, a definitive directional trade recommendation is premature. The asset is currently in a 'WATCH_ZONE'. The score of 1/8 reflects the high degree of uncertainty and the lack of a clear, high-conviction setup.
A valid bullish setup would require ETHUSD to demonstrate strength by holding above the critical support level at $1874.22 on the daily chart. A daily close above this level, ideally accompanied by a surge in buying volume and a shift in short-term indicators towards bullish momentum (e.g., MACD crossover on the 1-hour chart, RSI moving above 50), would signal a potential continuation of the prior uptrend. This would open the door for targets towards the $1956.29 resistance level.
Conversely, a bearish setup would be confirmed by a decisive break and sustained hold below the $1874.22 support level. If ETHUSD fails to hold this key area and closes below it on the daily chart, it would invalidate the bullish thesis. This scenario would likely trigger further downside, with the next significant support target at $1827.25. Traders should be cautious and wait for clearer signals before committing to a directional trade, managing risk diligently as the market navigates these critical levels.
Bearish Scenario: Sellers Consolidate Control
65% ProbabilityNeutral Scenario: Consolidation Around Key Levels
25% ProbabilityBullish Scenario: Recovery Attempt
10% ProbabilityFrequently Asked Questions: ETHUSD Analysis
What happens if ETHUSD breaks below the $1874.22 support level on the daily chart?
A break below $1874.22 on the daily chart would invalidate the current bullish setup and signal a potential continuation of the recent downtrend. This could lead to further declines, with the next significant target being the $1827.25 support level.
Should I buy ETHUSD at current levels around $1,877.38, given the mixed signals?
Buying at current levels around $1,877.38 is not recommended due to the conflicting signals and the bearish pressure seen on shorter timeframes. A confirmed hold above $1874.22 with bullish confirmation on lower timeframes would present a more favorable risk/reward for a long position.
Is the RSI at 59.95 on the daily chart a sell signal for ETHUSD?
An RSI of 59.95 on the daily chart is not inherently a sell signal; it sits in the upper neutral zone, indicating room for upside but also nearing overbought territory. It suggests that while the uptrend has been strong, momentum might be moderating, and a price reversal could occur if selling pressure intensifies.
How will the expected US Payrolls report impact ETHUSD this week?
A stronger-than-expected US Payrolls report could strengthen the DXY and increase risk-off sentiment, potentially pushing ETHUSD lower. Conversely, a weaker report might lead to a dollar pullback and a risk-on environment, which could support a recovery in ETHUSD, especially if it holds key support levels.
The past week has underscored the inherent volatility and complexity of the cryptocurrency market, with ETHUSD facing significant headwinds. While the daily chart still holds some bullish undertones from previous price action, the immediate bearish pressure on shorter timeframes cannot be ignored. The interplay between technical indicators, key price levels, and the broader macroeconomic environment, particularly the strength of the DXY and the sentiment in equity markets, will dictate ETHUSD's trajectory in the coming days. Patience and disciplined risk management are paramount for traders navigating this uncertain terrain. Waiting for a clear signal, whether a decisive break of support or a confirmation of recovery above key resistance, will be crucial for making informed trading decisions.
Track markets in real-time
AI-powered analysis, technical indicators and real-time price data.
Join Our Telegram Channel
Breaking market news, AI analysis and trading signals instantly.
Join Channel