

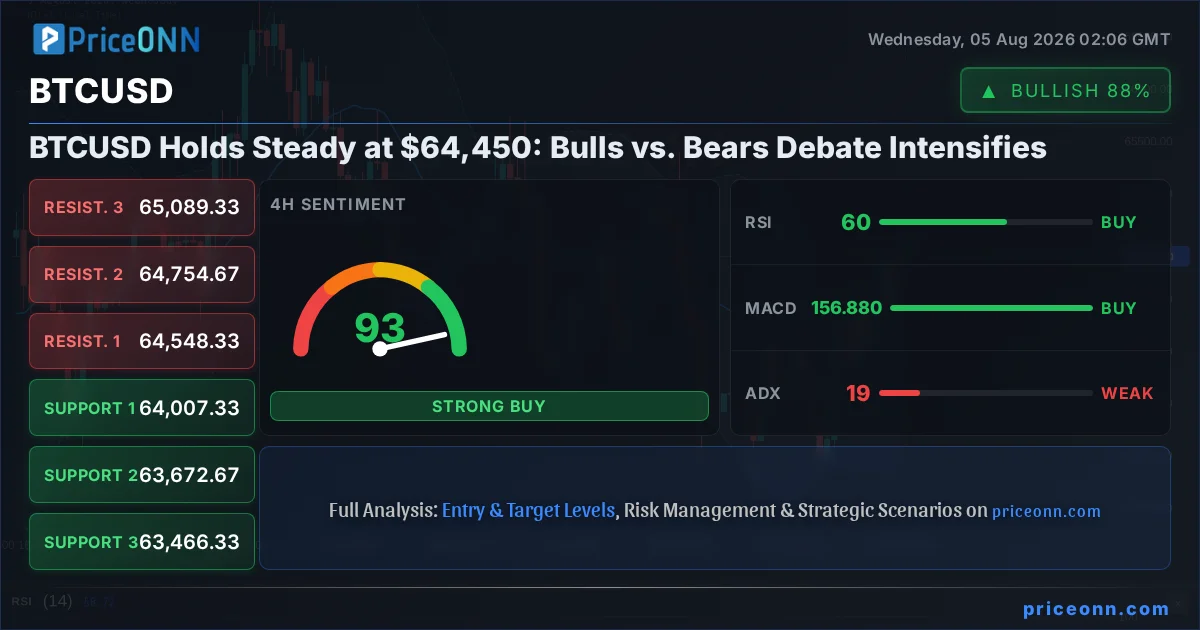
Is Bitcoin finally consolidating its gains, or is this just a brief pause before another leg up? BTCUSD is currently locked in a tight battle around the $64,450.00 mark, a level that has become a critical pivot point for both bulls and bears. This tug-of-war isn't just a random price fluctuation; it's a reflection of the fundamental tension between macroeconomic forces, evolving crypto-specific narratives, and the ever-present dance between fear and greed in the digital asset market. Understanding the dynamics at play here is crucial for anyone looking to navigate this complex landscape. The market is sending mixed signals, and discerning the true path forward requires a deep dive into the data, historical context, and the subtle shifts in market sentiment.
- RSI at 61.92 signals overbought pressure on the 1H chart, but remains in neutral territory on daily charts, suggesting underlying strength.
- Critical support for BTCUSD sits at $63,700.67, a level tested multiple times this week, while resistance looms at $64,348.67.
- MACD histogram shows positive momentum on most timeframes, but divergence on the 1H chart suggests potential waning bullish momentum.
- The correlation with DXY, currently at 99.91, is a key factor, with dollar weakness generally supporting Bitcoin's upward trajectory.
The current market environment presents a fascinating dichotomy. On one hand, the persistent strength in major indices like the S&P 500 (trading at 6572.87) and Nasdaq (29758.01) suggests a broader risk-on sentiment, which historically bodes well for riskier assets like Bitcoin. The Nasdaq's impressive 3.29% daily surge, driven by strong positive momentum across multiple timeframes, certainly paints a picture of robust investor confidence. This risk appetite could easily spill over into the crypto market, fueling demand for BTCUSD. Furthermore, the fact that BTCUSD itself is showing a daily rise of 1.06%, reaching $64,450.00, indicates that buyers are still present and willing to step in at these levels. The 1-hour and 4-hour charts show a generally bullish trend, with multiple indicators aligning to suggest upward movement. The ADX at 24.9 on the 1H chart indicates a mid-strength trend, and the overall signal points towards buying interest.
The Bull Case: Why Bitcoin Could Break Higher
Let's dive into why the bulls might be in control, or at least have a strong argument for a continued rally. The primary driver for bullish sentiment often stems from the broader macroeconomic landscape and crypto-specific tailwinds. Firstly, the persistent weakness in the US Dollar Index (DXY), currently hovering around 99.91 with a slight daily dip, historically correlates with a rise in Bitcoin's price. As the dollar weakens, investors often seek alternative stores of value or riskier assets that offer higher potential returns, and Bitcoin fits that bill perfectly. The fact that the DXY is showing negative momentum on its 1-hour and 4-hour charts, with RSI readings below 50, reinforces this narrative. This dollar weakness could be a significant tailwind for BTCUSD, potentially pushing it towards higher resistance levels.
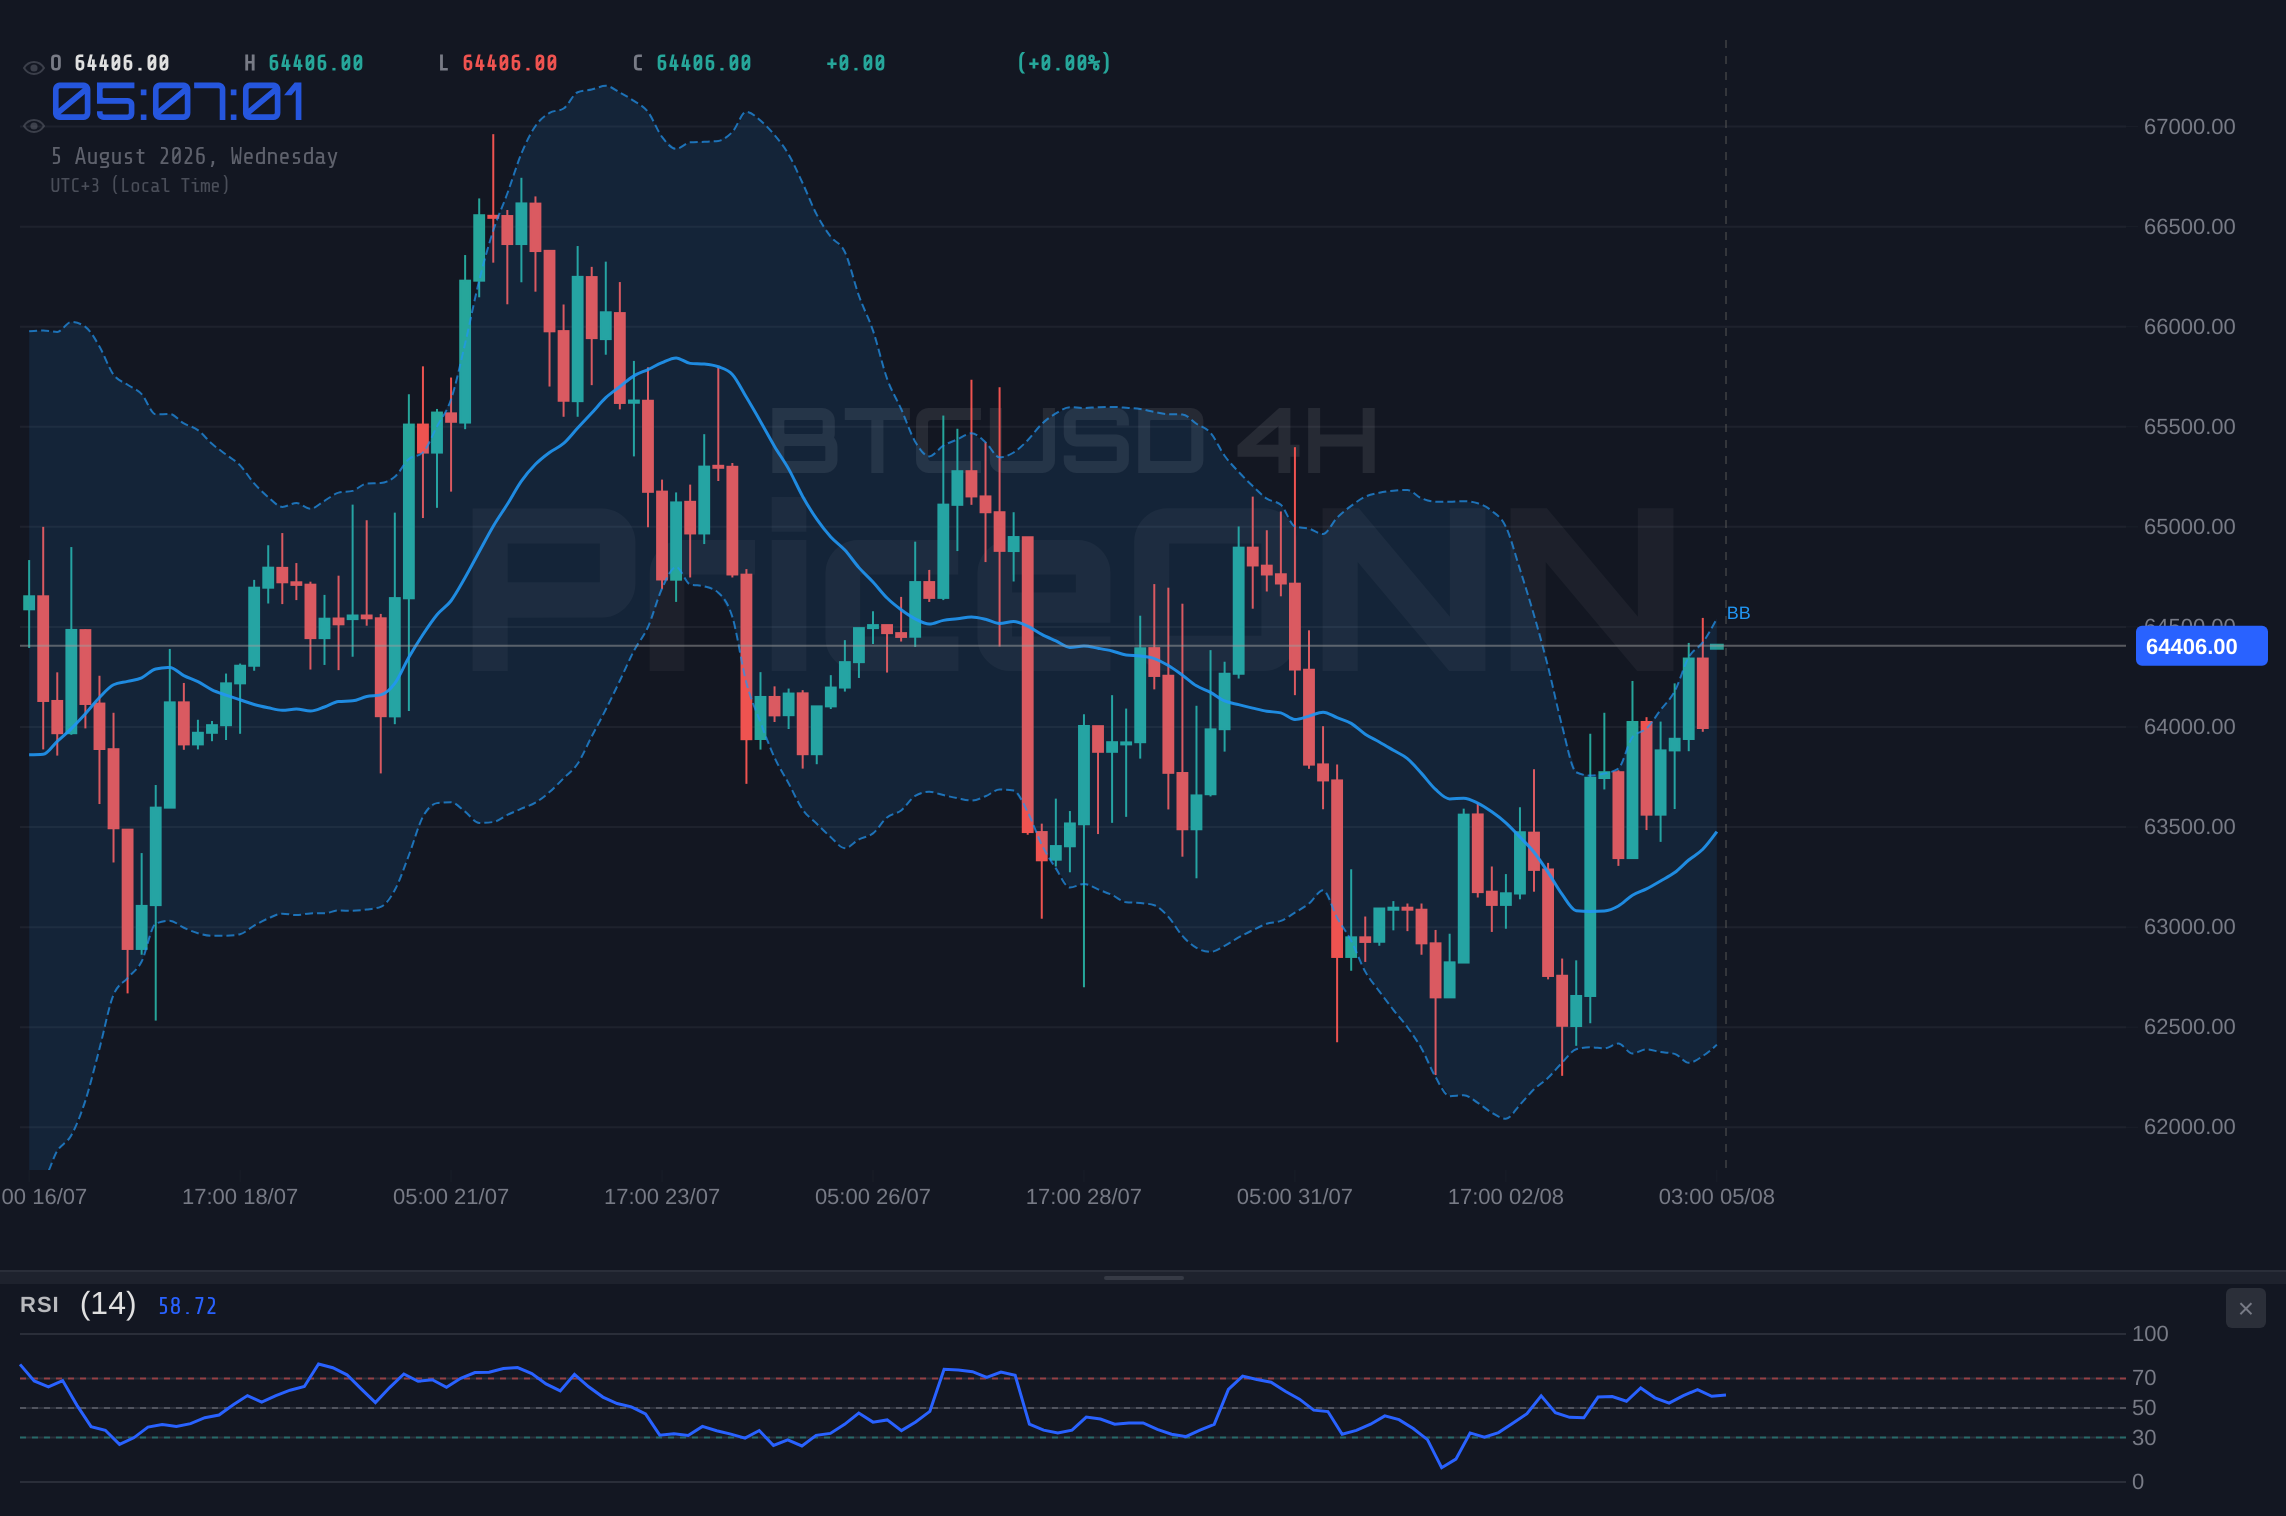
Secondly, the strength observed in traditional markets, particularly the Nasdaq's significant jump, cannot be ignored. When major stock indices surge, it typically signals increased investor confidence and a greater willingness to take on risk. This 'risk-on' sentiment often translates into capital flowing into speculative assets, including cryptocurrencies. The Nasdaq's performance, with its ADX at a very strong 56.57 on the 1H chart, indicates a powerful uptrend that could inspire similar moves in Bitcoin. The positive MACD momentum and Stochastic K line above D on the 4-hour chart further support the idea of sustained buying pressure. This broad market optimism creates a favorable environment for Bitcoin to potentially break through its current consolidation.
On the crypto-specific front, we're seeing continued developments that could underpin bullish sentiment. While specific on-chain data like active addresses or whale movements isn't provided in this snapshot, the general market narrative often involves institutional adoption and the growth of the DeFi ecosystem. Reports of increased institutional interest, whether through ETF flows or direct investment, can significantly boost confidence. Furthermore, the underlying technology and network growth, often measured by hash rate and developer activity, provide a fundamental basis for long-term value appreciation. Even without explicit numbers here, the prevailing sentiment in many crypto circles remains one of cautious optimism, with the belief that Bitcoin's scarcity and network effects will continue to drive value over the long term. The overall 'AL' signals across multiple timeframes on the 1H and 4H charts for BTCUSD further bolster the bull case, suggesting that technical indicators are leaning towards upward movement.
The consistent 'AL' (Buy) signals across 1H and 4H timeframes for BTCUSD, coupled with positive MACD momentum and rising Stochastic K lines, indicate strong short-to-medium term buying pressure. The ADX on the 1H chart at 24.9 suggests a mid-strength trend is in play, ready to potentially accelerate if key resistance levels are breached.
The Bear Case: Why Caution is Warranted
However, the picture isn't entirely rosy for the bulls. Several factors suggest that caution is indeed warranted, and a bearish reversal could be on the horizon. One of the most immediate concerns comes from the technical indicators themselves, particularly when viewed across different timeframes. While the 1-hour and 4-hour charts show bullish tendencies, the daily chart presents a more cautionary tale. The RSI on the daily timeframe is sitting at 52.11, still in neutral territory but showing a slight downward tendency, which can sometimes precede a trend reversal. More importantly, the MACD on the daily chart is displaying negative momentum, with the MACD line below its signal line. This indicates that the longer-term trend might be losing steam, despite short-term gains. The Stochastic indicator on the daily chart also shows a potential bearish crossover (%K
Furthermore, the current price action itself, hovering around $64,450.00, represents a significant psychological and technical resistance zone. The provided data shows a key resistance level at $64,348.67 for the 1-hour timeframe and $64,548.33 for the 4-hour timeframe. If BTCUSD fails to decisively break and hold above these levels, it could lead to a period of consolidation or even a sharp pullback. The fact that the price is currently trading near these upper bounds, without overwhelming conviction, suggests that sellers are becoming more active. The ADX on the 1-hour chart at 24.9 indicates a mid-strength trend, which could easily reverse if the bulls fail to maintain momentum. A failure to break higher could lead to profit-taking and a test of the support levels, starting with $63,700.67 on the 1-hour chart.
Another point of concern is the mixed signals from correlated assets. While the Nasdaq and S&P 500 are showing strength, the DXY's movement isn't a clear-cut bullish signal for Bitcoin. Although the DXY is down slightly, its daily trend on the 4-hour chart is still considered neutral (50% strength) with a strong downtrend reading from ADX at 33.97, which can be contradictory. If the dollar were to suddenly reverse its trend and start strengthening, it would likely put significant downward pressure on Bitcoin, as seen historically. Moreover, the oil market, a key indicator of inflation and geopolitical risk, is showing significant weakness. Brent crude is down 4.59% and WTI down 4.92%, indicating a potential slowdown in global demand or easing inflation concerns. While lower oil prices might reduce inflation fears, thus potentially easing pressure on central banks to hike rates, a sharp fall can also signal broader economic concerns, which could dampen risk appetite across all markets, including crypto.
The daily chart indicators for BTCUSD are flashing caution. Negative MACD momentum and a potential Stochastic crossover suggest that the longer-term trend might be weakening. A failure to break key resistance at $64,348.67 could trigger a sell-off towards the $63,700.67 support level.
Navigating the Crossroads: What the Data Tells Us
The current technical picture for BTCUSD is a classic example of market indecision, where short-term bullish momentum clashes with potential longer-term bearish divergences. On the 1-hour chart, we see a generally bullish setup with RSI at 61.92, MACD showing positive momentum, and Stochastic giving a buy signal (%K > %D). The ADX at 24.9 suggests a developing trend. However, these positive short-term signals are tempered by the daily chart's indicators. The daily RSI at 52.11 is neutral but trending down, the MACD displays negative momentum, and the Stochastic shows a bearish crossover. This conflict highlights the importance of a multi-timeframe analysis. Short-term traders might be tempted to buy on the strength, aiming for resistance levels like $64,348.67, but longer-term investors should be wary of the potential for a reversal if daily indicators continue to deteriorate.
The correlation with other markets is also a critical piece of the puzzle. The DXY's current neutral stance on the 4-hour chart, despite a slight dip, means its direction could easily shift. If the dollar strengthens unexpectedly, perhaps due to hawkish comments from Fed officials or a sudden flight to safety, it could quickly turn the tide against Bitcoin. Similarly, while the Nasdaq's rally is impressive, a reversal in equities, driven by inflation concerns or economic slowdown fears, would likely drag Bitcoin down with it. The significant drop in oil prices (Brent at 78.73, WTI at 76.58) adds another layer of complexity. While it might ease inflation pressures, the magnitude of the drop could also signal underlying economic weakness, which is generally bad news for risk assets. This uncertainty means that relying solely on the strength of the Nasdaq might be a risky strategy.
From a price action perspective, the $64,450.00 level is where the battle is being fought. The support levels at $63,916.67, $63,838.33, and $63,700.67 are critical. A break below $63,700.67, especially on increased volume, would likely invalidate the short-term bullish setup and open the door for a move towards the next significant support at $63,466.33 on the 4-hour chart. Conversely, a decisive close above the 1-hour resistance at $64,348.67, followed by a push towards the 4-hour resistance at $64,548.33, would strengthen the bullish case and could signal the start of a new upward leg. The volume and conviction behind any such move will be key differentiators.
A trader looking to play this consolidation might wait for a clear break of either the immediate support or resistance. A break below $63,700.67 could signal a short opportunity targeting $63,466.33. Conversely, a confirmed break above $64,548.33 on strong volume could be a long entry, targeting the next resistance cluster around $65,089.33.
The Verdict: A Watchful Stance is Prudent
Given the conflicting signals between short-term bullish momentum and longer-term technical divergences, coupled with the mixed macroeconomic and correlated asset picture, the most prudent approach for BTCUSD at $64,450.00 is a 'Watch Zone' strategy. Neither the bulls nor the bears have a decisive advantage right now. The market is waiting for a catalyst – either a clear break of key resistance or a decisive fall through support.
For the bulls to gain conviction, we need to see BTCUSD sustain a close above the $64,548.33 resistance level on the 4-hour chart, ideally with increasing volume and positive follow-through on the daily indicators. If this happens, the next targets would be the $64,754.67 and potentially the $65,089.33 levels. This would suggest that the short-term strength is translating into a more sustained uptrend. The daily RSI would need to break decisively above 55, and the MACD would need to show stronger positive momentum to confirm this bullish outlook.
Conversely, if the bears manage to push the price below the critical 1-hour support at $63,700.67, it would signal a failure of the current consolidation. The immediate downside target would be the 4-hour support at $63,466.33. A break below this level, especially if accompanied by negative news or a sharp downturn in traditional markets, could accelerate the move towards the more significant daily support levels around $62,663.67. In such a scenario, the daily chart indicators would likely turn more bearish, confirming the reversal.
Until one of these scenarios plays out with conviction, ranging is likely to continue. Traders should pay close attention to the DXY's movement, the performance of major equity indices, and any shifts in inflation or interest rate expectations. The $64,450.00 level is not just a price point; it's a battleground. Patience and discipline will be key. Waiting for a confirmed breakout or breakdown, supported by volume and aligned indicators across multiple timeframes, will be crucial for navigating this uncertain period. The market is telling us to wait and watch; forcing a trade here could be premature.
Frequently Asked Questions: BTCUSD Analysis
What happens if BTCUSD breaks below the $63,700.67 support level?
A break below $63,700.67 on the 1-hour chart would invalidate the current consolidation, signaling potential weakness. This could lead to a test of the next support at $63,466.33, with further downside risk towards daily support around $62,663.67 if the bearish momentum continues.
Should I buy BTCUSD at current levels of $64,450.00 given the mixed signals?
Given the conflicting signals between short-term bullishness and longer-term bearish divergences, buying at current levels carries significant risk. A more prudent approach is to wait for a confirmed breakout above $64,548.33 or a breakdown below $63,700.67, supported by volume and aligned indicators.
Is the RSI at 61.92 on the 1H chart a sell signal for BTCUSD?
An RSI of 61.92 on the 1-hour chart is in the neutral zone, leaning towards overbought conditions but not yet indicating an immediate sell signal. However, combined with potential divergences on longer timeframes, it suggests that bullish momentum might be slowing, warranting caution rather than an outright sell.
How will the DXY's current level of 99.91 affect BTCUSD this week?
With the DXY at 99.91 and showing some weakness, it generally provides a supportive backdrop for BTCUSD. However, the DXY's trend is neutral on 4H, meaning a sudden reversal could occur. If the dollar strengthens significantly, it would likely put downward pressure on Bitcoin, potentially triggering a move towards lower support levels.
Bearish Scenario: Support Breakdown
65% ProbabilityBullish Scenario: Resistance Breakout
25% ProbabilityNeutral Scenario: Range-Bound Consolidation
10% ProbabilityTrack markets in real-time
AI-powered analysis, technical indicators and real-time price data.
Join Our Telegram Channel
Breaking market news, AI analysis and trading signals instantly.
Join Channel