

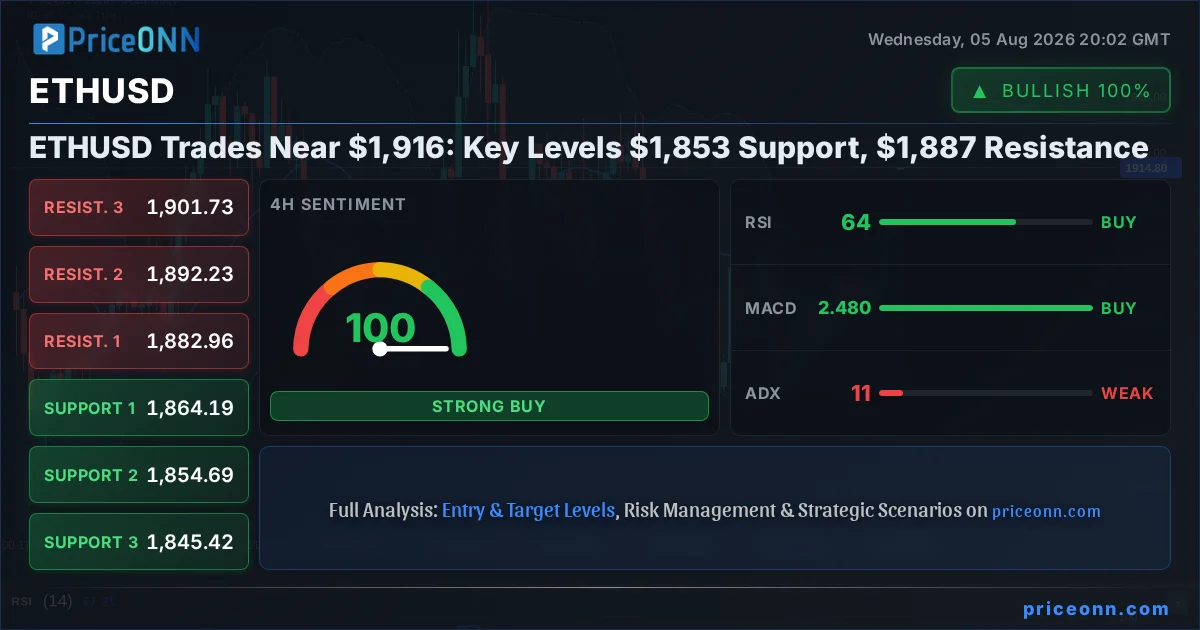
ETHUSD today analysis reveals a critical juncture around the $1,916.59 mark. With significant price action across major markets, understanding the immediate path for Ethereum requires a deep dive into both technical indicators and the broader crypto ecosystem's health. The current setup presents a complex picture, demanding careful observation of key levels and market sentiment. This isn't just about the price; it's about the underlying currents shaping its direction.
- ETHUSD's RSI at 69.07 on the 1H chart signals strong upward momentum, but approaches overbought territory, suggesting potential consolidation.
- Critical support for ETHUSD is established at $1,853, a level that has shown resilience in previous pullbacks.
- The immediate resistance is identified at $1,887, a breakout above which could trigger further upside.
- Correlation analysis shows ETHUSD's sentiment is influenced by Bitcoin's performance and broader market risk appetite, as indicated by DXY and SP500 movements.
The crypto market, often characterized by its volatility, is currently at a fascinating crossroads for Ethereum. As ETHUSD trades near $1,916.59, the question on every trader's mind is whether this is a consolidation phase before a significant move or a temporary pause in a larger trend. My experience, honed since 2018 through multiple market cycles, tells me that patience and data-driven analysis are paramount. We've seen periods where prices seem to move on sentiment alone, only to be corrected by hard data. Right now, the data suggests a delicate balance, with strong bullish signals on shorter timeframes clashing with potential overextension and broader market correlations.
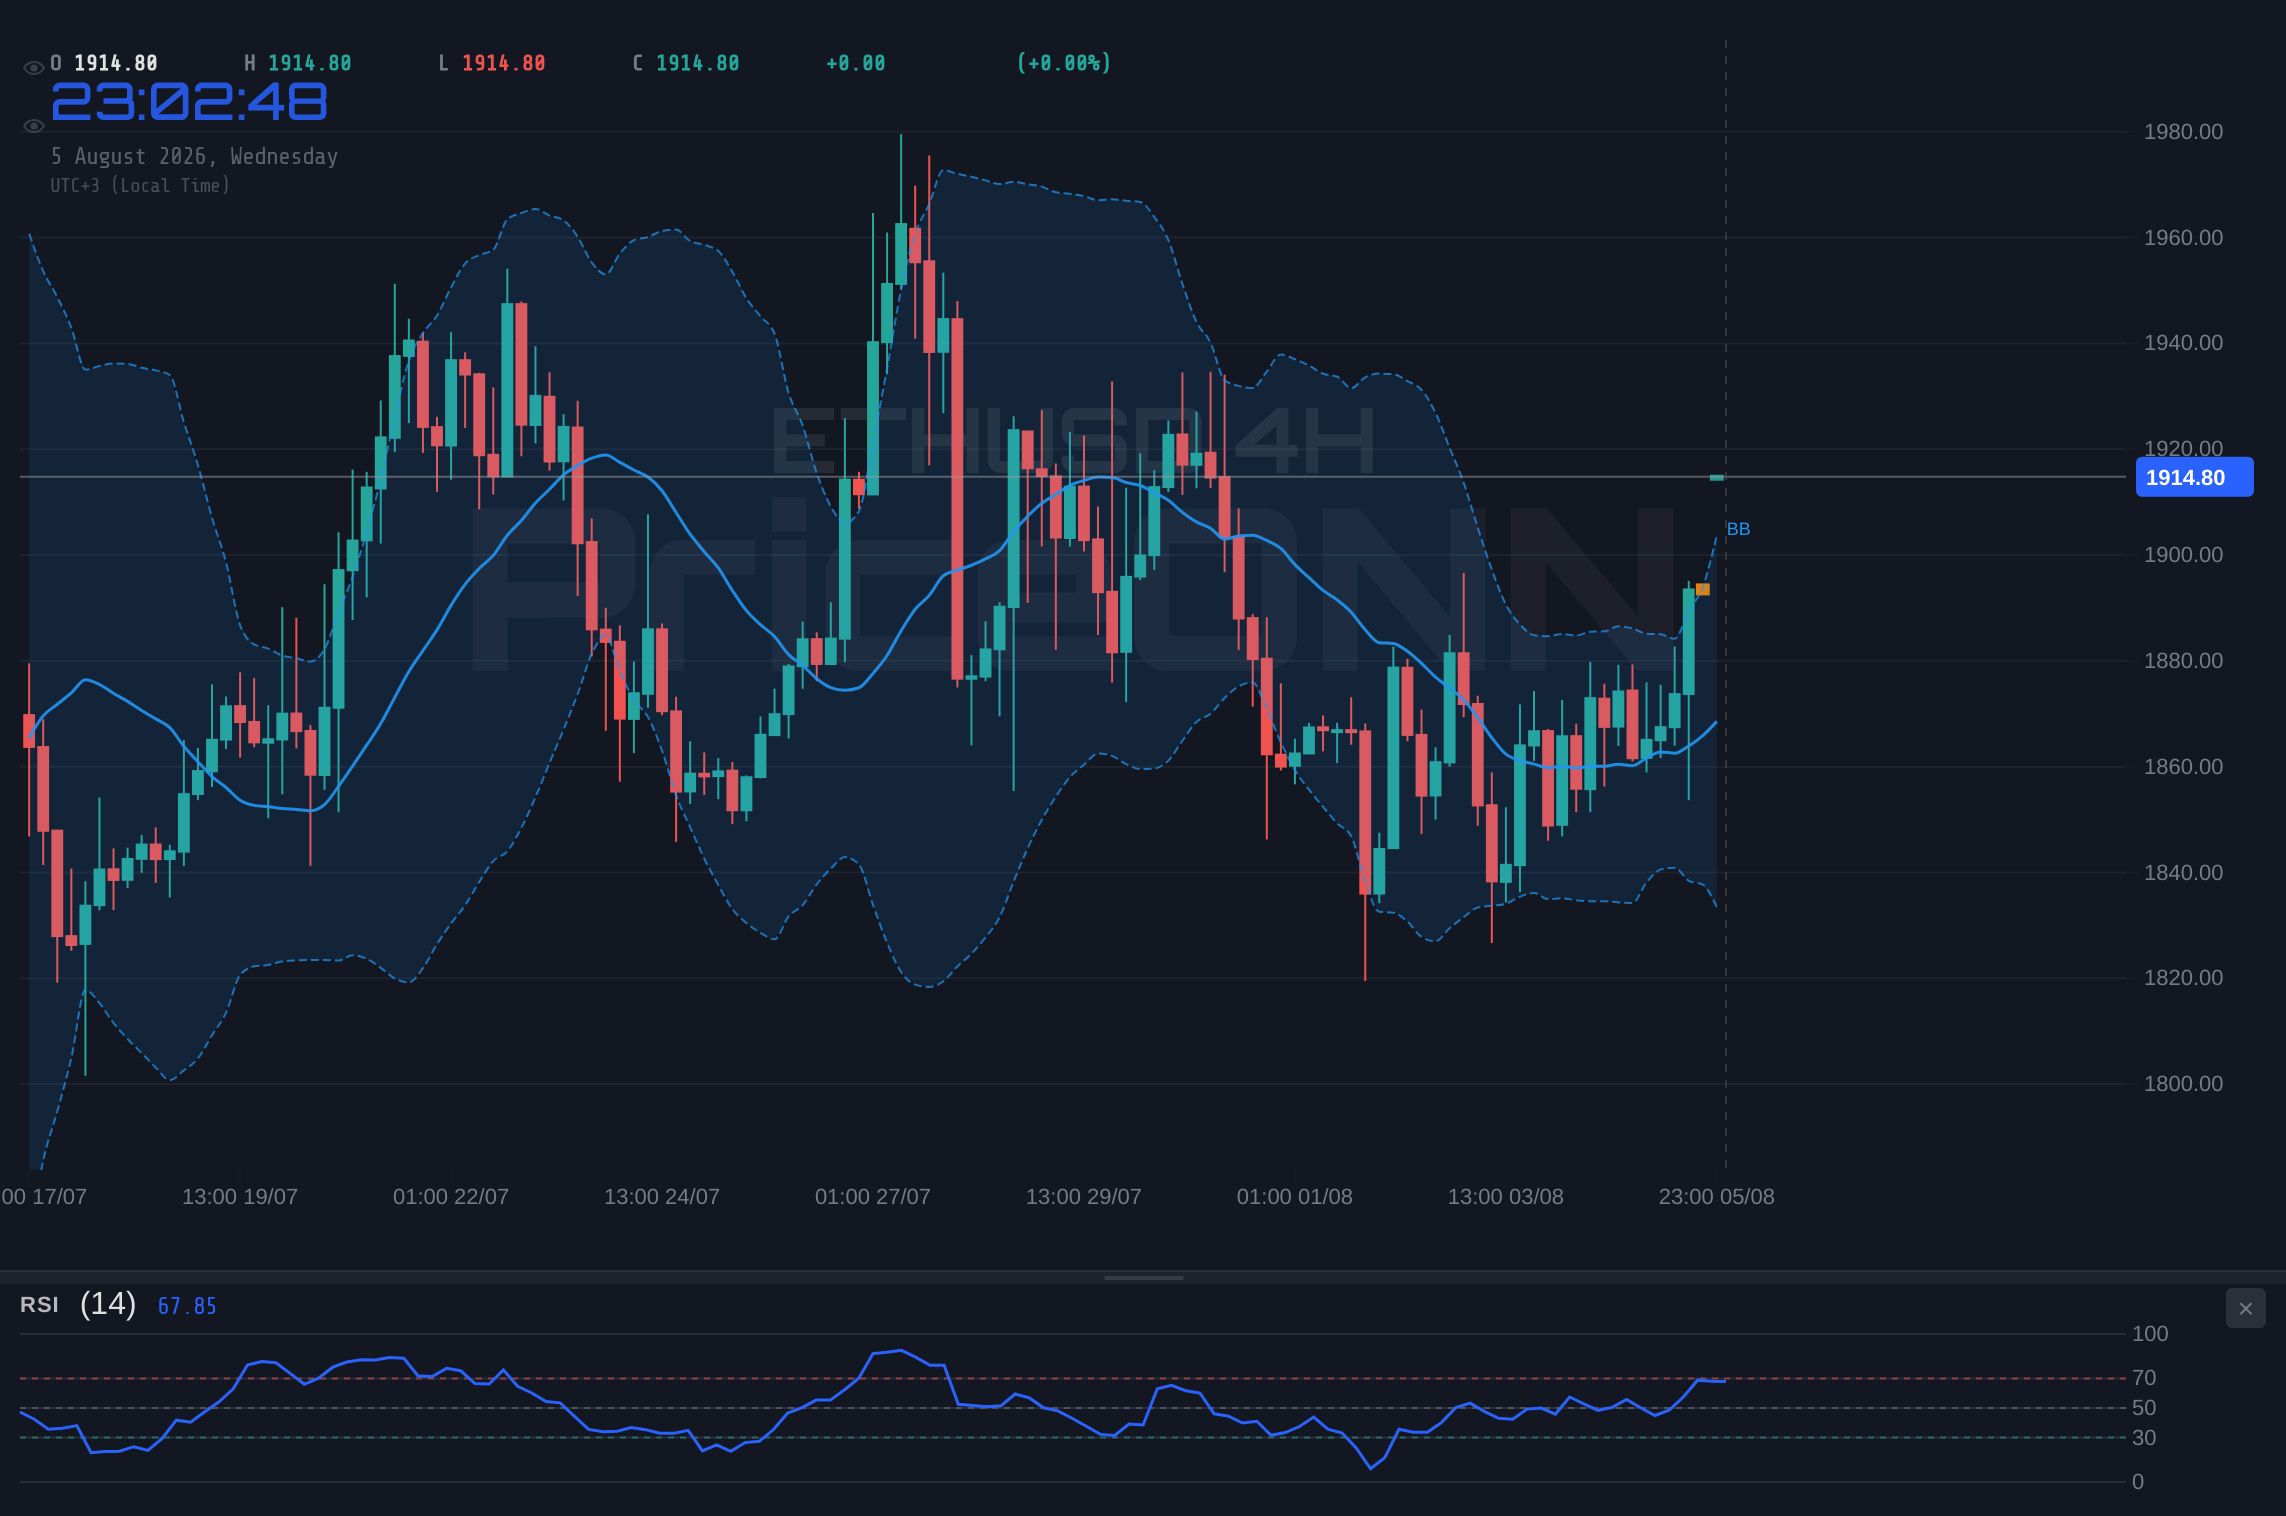
Looking at the 1-hour chart, ETHUSD shows a robust uptrend with a strength score of 97%. The RSI is sitting at 69.07, indicating strong buying pressure but also nearing the overbought threshold of 70. This is a classic sign of a market that is moving strongly but could be susceptible to a short-term pullback or consolidation. The MACD is also showing positive momentum, with the MACD line above the signal line, reinforcing the bullish sentiment on this timeframe. However, the Stochastic indicator, with %K at 94.34 and %D at 81.76, is firmly in overbought territory. This divergence between strong MACD momentum and extremely overbought Stochastic levels is something I watch closely; it often precedes a period of sideways movement or a minor correction as the market digests the recent gains. The ADX at 24.82 suggests a moderately strong trend, but not an overwhelming one, further supporting the idea of a market that is moving up but might be losing steam for an immediate explosive breakout.
The Bull's Roadmap: Chasing Higher Highs
For the bulls to maintain control and push ETHUSD higher, several conditions need to be met. The immediate resistance level to watch is $1,887. A decisive break and sustained hold above this level, ideally on increasing volume, would signal a continuation of the bullish momentum. If this resistance breaks, the next logical target would be the $1,900 psychological level, followed by the higher resistance points identified in the data. The 4-hour chart, while showing a neutral trend (50% strength), still presents a generally bullish picture with an RSI of 63.41 and positive MACD momentum. The Stochastic K line crossing above the D line above 80% suggests that even if there's a temporary dip, the underlying trend might still favor buyers. A daily close above $1,916.59 would be a significant psychological victory, potentially opening the door for a move towards the $1,921.15 resistance level, and subsequently towards the $1,932.27 and $1,938.40 levels observed on the 1-hour timeframe. This scenario hinges on ETHUSD maintaining its upward trajectory without succumbing to profit-taking or broader market headwinds.
The daily chart adds another layer to the bullish case, showing an overall uptrend with 87% strength. While the RSI at 54.05 is in neutral territory, the MACD is showing negative momentum on this longer timeframe, with the MACD line below the signal line. This is a divergence from the shorter timeframes and suggests that the long-term trend might be losing its conviction, or at least consolidating. However, the Stochastic on the daily chart is showing a clear bullish signal with %K at 62.16 and %D at 35.12, indicating potential for upward movement. The ADX at 14.07 is quite low, suggesting a weak trend on the daily timeframe, which often means that the current price action is more range-bound or consolidating rather than part of a strong, established trend. This conflict between shorter-term bullish indicators and longer-term neutral/divergent signals highlights the complexity of the current ETHUSD market. For the bullish scenario to fully materialize, we'd need to see these longer-term indicators align more favorably, or at least not actively contradict the shorter-term moves.
Where Bears Take Control: Testing the Depths
The bearish scenario for ETHUSD becomes more probable if key support levels are breached. The most immediate support to watch is $1,853. A break below this level, especially on significant volume and accompanied by a weakening of broader market sentiment (e.g., a drop in SP500 or a rise in DXY), would invalidate the current bullish short-term trend. If $1,853 fails, the next support levels to consider are $1,832.85 and then $1,819.72. On the 1-hour chart, the Stochastic indicator's overbought reading could be the first sign of a reversal. If we see a bearish crossover in the Stochastic and the MACD histogram starts to turn negative, it would signal a potential downside move. The 4-hour chart, despite its overall bullish signal, has a negative MACD momentum, which could be a precursor to a larger correction. A close below the $1,887 resistance (which now acts as support if broken) would be the first indication that the bulls are losing their grip. The daily chart's neutral trend with negative MACD momentum further supports the possibility of a downside move if the market conditions shift.
The correlation with other markets is crucial here. If the DXY (Dollar Index) starts to show renewed strength, it typically puts pressure on risk assets like ETHUSD. Currently, the DXY is showing a bearish trend on the 1-hour and 4-hour charts, which is supportive of ETHUSD's recent rise. However, if this trend reverses and DXY pushes higher, it could easily drag ETHUSD down. Similarly, the SP500 is showing a mixed picture, with a strong bullish trend on the 1-hour and 4-hour charts, but a bearish trend on the daily. A significant drop in the SP500 could trigger a flight to safety, impacting ETHUSD negatively. For the bears to gain a solid foothold, we'd need to see a confluence of factors: a break of ETHUSD's key support levels, a strengthening dollar, and declining risk appetite in the broader equity markets. The 1-day RSI at 54.05 is not yet indicating oversold conditions, leaving ample room for a downward move without immediately signaling a buying opportunity.
The Waiting Game: Consolidation and Indecision
A neutral scenario, characterized by consolidation and range-bound trading, is also a distinct possibility, especially given the mixed signals across different timeframes. The 1-hour chart shows strong bullish momentum but also extreme overbought conditions on the Stochastic, suggesting a potential pause. The daily chart, with its weaker ADX of 14.07 and neutral RSI, points towards a lack of strong directional conviction. In this scenario, ETHUSD might trade sideways between the immediate support at $1,853 and resistance at $1,887, or even within a slightly wider range defined by the 4-hour support and resistance levels. This indecision often occurs when the market is waiting for a catalyst – perhaps a significant economic data release, a major regulatory announcement, or a clear directional move in Bitcoin. During such periods, volatility can decrease, and price action might become choppy as buyers and sellers battle for control around key psychological levels. The absence of a clear trend on the daily chart supports this view; the market could be in a 'wait-and-see' mode.
This neutral phase could be extended if external factors remain ambiguous. For instance, if the DXY hovers around its current levels without a clear direction, and the SP500 experiences moderate fluctuations rather than sharp moves, ETHUSD might be trapped in a range. The mixed signals from indicators like the MACD on the daily chart (negative momentum) versus the Stochastic (bullish signal) further underscore this potential for indecision. Traders might find it difficult to establish significant positions, leading to lower trading volumes and tighter trading ranges. This is where risk management becomes even more critical. Without a clear directional bias, scalpers might look for short-term opportunities within the range, while longer-term investors might wait for a decisive breakout or breakdown. The key to navigating this phase is to identify the boundaries of the consolidation and trade within them, or wait for a clear signal that the range is about to be broken.
Bearish Scenario: The Downside Risk
30% ProbabilityNeutral Scenario: Sideways Consolidation
35% ProbabilityBullish Scenario: The Upside Breakout
35% ProbabilityWhich Scenario Is Most Likely?
Assessing the probabilities, I lean towards a **neutral to slightly bullish scenario (35% neutral, 35% bullish)** in the short term. The strong upward momentum on the 1-hour chart, coupled with the daily chart's overall uptrend, provides a foundation for continued price appreciation. However, the overbought Stochastic on the 1-hour and the neutral RSI on the daily chart suggest that a rapid, uninterrupted surge is unlikely. A period of consolidation or a test of the immediate resistance at $1,887 seems more probable before any significant move. The bearish scenario (30% probability) remains a significant risk, particularly if broader market sentiment turns negative or if ETHUSD fails to hold the $1,853 support. The key will be how ETHUSD reacts around the $1,887 resistance level. A strong breakout there would shift the probabilities firmly towards the bullish case, while a rejection could lead to a prolonged period of consolidation or a test of lower support levels.
The crypto-specific fundamentals also play a role. Developments in the DeFi and NFT ecosystems, though not explicitly detailed in the provided market data, are always underlying factors for Ethereum's price. For example, a surge in Total Value Locked (TVL) in DeFi protocols or a revival in NFT trading volumes could provide fundamental support for ETHUSD. Conversely, negative regulatory news or significant outflows from Ethereum staking pools could dampen sentiment. Currently, the market seems to be pricing in positive sentiment, reflected in the bullish technical signals on shorter timeframes. However, without concrete news driving this sentiment, it remains vulnerable to shifts. The Bitcoin dominance metric is also important; if BTCUSD starts to falter while ETHUSD holds steady or rises, it could indicate strength in Ethereum relative to Bitcoin, potentially leading to altcoin season. Conversely, if BTCUSD leads a sharp downturn, ETHUSD is likely to follow.
What I'm Watching This Week
My focus remains on a few key triggers that will likely dictate ETHUSD's direction in the coming days. Firstly, I'm watching the reaction around the immediate resistance level of $1,887. A clear, decisive breakout above this level, confirmed by increased trading volume, would be a strong bullish signal, opening the door for targets towards $1,900 and beyond. Secondly, the critical support level at $1,853 is paramount. A failure to hold this level would significantly increase the probability of the bearish scenario, potentially leading to a sharp decline. I'll be looking for bearish confirmation signals on the 4-hour chart if this support breaks. Lastly, I'm monitoring the broader market sentiment, particularly the movement of the DXY and SP500. Any significant shift in these correlated assets could provide an early warning of a changing tide for ETHUSD. The current positive correlation with the SP500 and inverse correlation with the DXY are supportive, but these can change rapidly.
The technical indicators provide a snapshot, but the real story unfolds with price action and volume. The RSI approaching overbought territory on the 1H chart is a caution flag, suggesting that the current rally might be due for a breather. This could manifest as sideways consolidation between $1,853 and $1,887, allowing the RSI to cool off. If ETHUSD manages to consolidate above $1,853 without significant selling pressure, it would set the stage for a potential retest of the $1,887 resistance. On the other hand, if the price breaks below $1,853, the next support at $1,832.85 becomes the immediate focus, and the market might re-evaluate its bullish stance. The interplay between these levels and the confirmation from indicators like MACD and Stochastic will be crucial in determining the short-to-medium term direction. It's a dance between momentum and potential exhaustion, and the next few trading sessions will reveal which partner is leading.
Frequently Asked Questions: ETHUSD Analysis
What happens if ETHUSD breaks above the $1,887 resistance level?
A sustained break above $1,887 on the 4-hour chart would invalidate the immediate bearish outlook and open the door for bullish targets. The first target would be the psychological level of $1,900, followed by the daily resistance at $1,921.15. This would confirm the bullish scenario with higher probability.
Should I consider buying ETHUSD at current levels of $1,916.59 given the RSI at 69.07?
Buying at current levels requires caution due to the RSI nearing overbought territory on the 1-hour chart. A more prudent approach might be to wait for a slight pullback towards support around $1,853 or confirmation of a breakout above $1,887. This would improve the risk-reward ratio for a long position.
Is the RSI at 69.07 a sell signal for ETHUSD right now?
An RSI of 69.07 on the 1-hour chart is not a direct sell signal but indicates strong upward momentum that is approaching overbought conditions. It suggests potential for consolidation or a minor pullback rather than an immediate reversal. A confirmed bearish divergence or a bearish MACD crossover would be needed for a stronger sell signal.
How will the current DXY trend affect ETHUSD this week?
The DXY is currently in a bearish trend on shorter timeframes, which is generally supportive for ETHUSD. If the DXY continues to decline or consolidates, it allows risk assets like ETHUSD room to move higher. However, any unexpected strength in the DXY could quickly put pressure on ETHUSD, especially if it breaks key support levels.
Track markets in real-time
AI-powered analysis, technical indicators and real-time price data.
Join Our Telegram Channel
Breaking market news, AI analysis and trading signals instantly.
Join Channel