

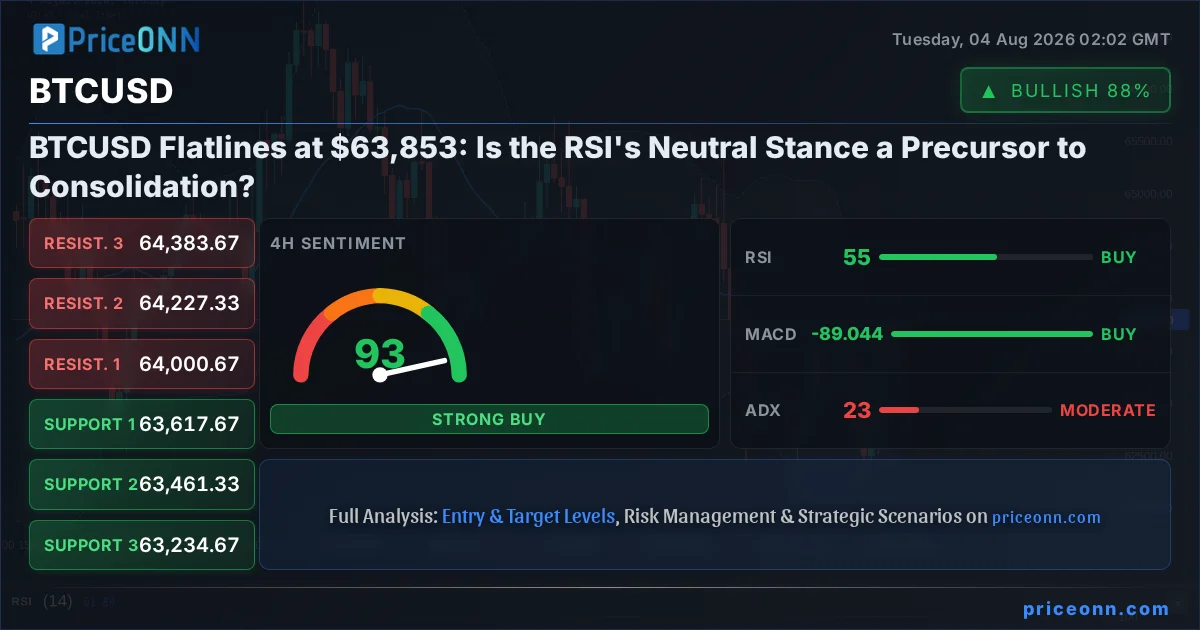
Bitcoin's current price action around $63,853 presents a curious picture; the market seems to be holding its breath, caught in a delicate balance between potential upside and downside pressures. This isn't a moment of dramatic collapse or euphoric ascent, but rather a period of consolidation that requires a nuanced understanding of the underlying technical signals. Having navigated through the volatile cycles of 2024, witnessing price swings from the depths of fear to the peaks of greed, this current state of equilibrium around $63,853 demands a trader's sharpest focus. The question on everyone's mind is: what does this prolonged pause signify, and where might BTCUSD head next?
- RSI at 60.13 on the 1H chart suggests a neutral momentum, indicating neither strong buying nor selling pressure is dominant.
- Critical support for BTCUSD is identified at $62,977.33, a level that has shown resilience in recent price action.
- Resistance is currently observed around $63,775.33, a key level that needs to be convincingly broken for upside continuation.
- The correlation with the DXY, currently at 100.02, is a significant factor, with dollar strength potentially capping crypto gains.
Navigating the Crossroads: BTCUSD at $63,853
The cryptocurrency market, particularly Bitcoin, has a penchant for dramatic narratives. Yet, sometimes the most crucial insights lie not in the explosive moves, but in the quiet periods of indecision. BTCUSD currently finds itself at such a juncture, trading at precisely $63,853. This price point isn't just a number; it represents a delicate equilibrium that has emerged after a period of significant volatility. The 1-hour chart shows a neutral trend with a power of 50%, a clear indication that neither the bulls nor the bears have gained a decisive upper hand. This lack of directional conviction is further underscored by the RSI(14) hovering at 60.13. While not yet in overbought territory, this reading suggests that the immediate upward momentum has stalled, and any further gains might require a fresh catalyst.
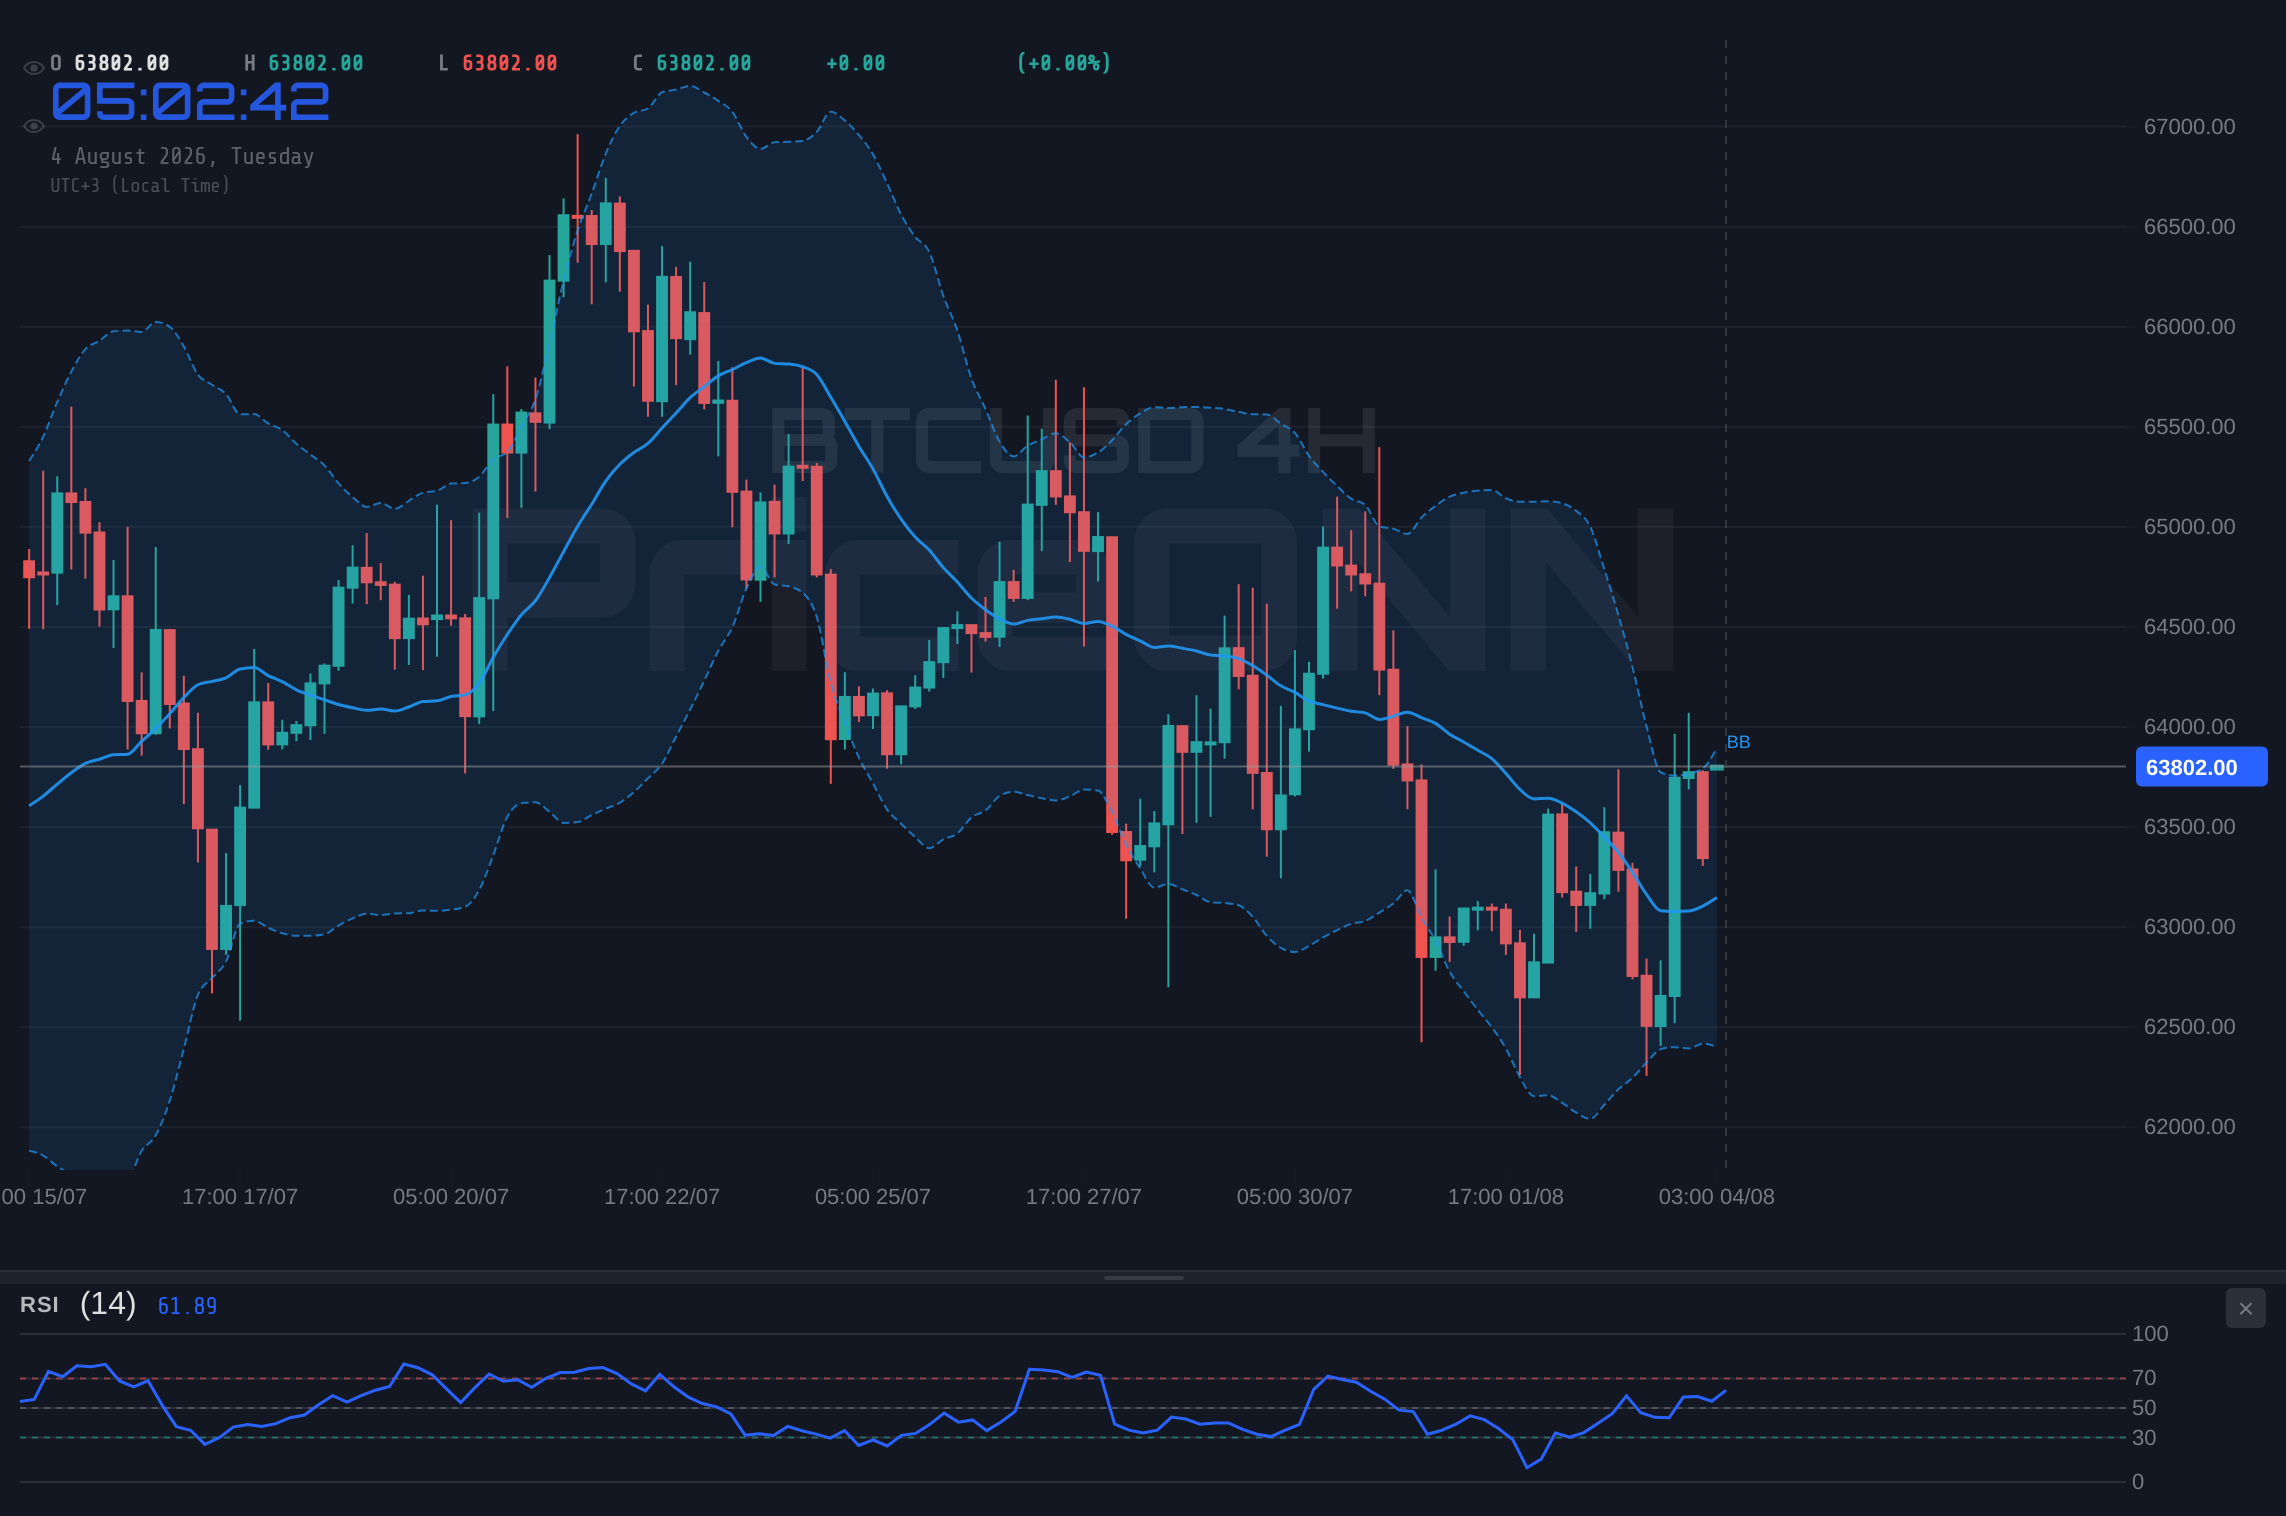
The price action itself paints a picture of consolidation. The daily trading range, from $62,257 to $64,071, while seemingly wide, reflects a market that is currently churning within defined boundaries rather than embarking on a clear trajectory. This 'flatlining' at $63,853 is precisely what requires our attention. It’s a signal that the market is digesting recent price action and waiting for new information. The MACD on the 1-hour chart still shows positive momentum, sitting above its signal line, but this needs to be viewed in conjunction with the RSI's plateau. It's like a car revving its engine but staying in neutral – the potential is there, but the movement hasn't materialized yet. This is a critical phase for traders; chasing the current price could lead to being caught on the wrong side of the next move.
The Tale of Two Timelines: Conflicting Signals
Diving deeper into the technicals, the multi-timeframe analysis reveals a landscape of conflicting signals, a hallmark of consolidation phases. On the 4-hour chart, the trend is still considered neutral with a 50% power, but the ADX at 23.24 suggests a moderately strong downtrend. This is a curious contradiction to the 1-hour chart's bullish signals. The Stochastic oscillator on the 4-hour timeframe presents a bullish signal (%K > %D), with K at 86.25 and D at 53.58, indicating a potential move higher from oversold conditions, but this is happening in a zone of strong downtrend indication. This divergence is precisely why caution is paramount. The market is not giving a clear directive; instead, it's presenting pieces of a puzzle that don't yet fit neatly together.
The daily (1D) timeframe paints an even more complex picture. Here, the trend is classified as bullish with 88% power, yet the MACD is showing negative momentum, sitting below its signal line. Furthermore, the RSI(14) at 49.25 is inching towards the bearish territory, and the Stochastic oscillator is giving a bullish signal (%K > %D, K=30.59, D=27.26), but this is occurring in a zone of falling ADX (15.81), indicating a weak trend. This contrast between the daily's bullish lean and the shorter timeframes' mixed signals highlights the current uncertainty. The market is essentially caught between conflicting data points. A trader looking at the daily might feel optimistic, but a glance at the 1-hour or 4-hour charts reveals the immediate headwinds and the lack of clear direction. This is where risk management becomes the primary tool in a trader's arsenal.
Correlation Analysis: DXY and Equities Loom Large
Bitcoin, despite its decentralized nature, does not trade in a vacuum. Its price movements are increasingly influenced by broader macroeconomic factors and correlated assets. The US Dollar Index (DXY), currently trading at 100.02, is a key barometer. Historically, a strengthening dollar tends to put pressure on risk assets like Bitcoin. While the DXY's 1-hour and 4-hour charts show mixed signals, its daily trend is neutral with 50% power, and the ADX at 24.19 indicates a moderate downtrend. However, its upward movement to 100.02 suggests that dollar strength is a factor that cannot be ignored. If the DXY continues to find footing and push higher, it could act as a significant drag on BTCUSD, even if other indicators suggest a bullish bias.
The performance of major equity indices also plays a crucial role in the risk appetite narrative. The SP500, currently at 6572.87, and the Nasdaq 100 at 28921.67, are both showing strong bullish trends on the 1-hour and 4-hour charts, despite some overbought conditions appearing on the 1-hour RSI. On the daily timeframe, however, the SP500 shows a strong downtrend (ADX 47.51), while the Nasdaq 100 shows a strong uptrend (ADX 29.66). This divergence in the daily equity trends adds another layer of complexity. Generally, a robust performance in equities suggests a higher risk tolerance in the market, which is typically beneficial for Bitcoin. Conversely, a significant pullback in these indices could easily trigger a flight to safety, impacting BTCUSD negatively. The current mixed signals from the equity markets, particularly the daily SP500 weakness, warrant a cautious approach.
Fundamental Undercurrents: What's Driving the Pause?
Beyond the immediate technical indicators, the fundamental landscape provides context for Bitcoin's current stalemate. While there have been no major negative headlines in the last 48 hours directly impacting BTCUSD, the absence of significant positive news also contributes to the muted price action. The crypto market's overall capitalization has seen a slight dip, as noted by a report indicating a 1% fall in the past 24 hours, returning to levels seen earlier. This suggests a broader market sentiment that isn't overwhelmingly bullish. The lack of substantial inflows into Bitcoin ETFs or significant whale movements reported in the live data means that the market is not being driven by large-scale institutional conviction at this moment.
On-chain metrics, while not provided in real-time for this analysis, are crucial for understanding the underlying health of the Bitcoin network. Active addresses, transaction volumes, and exchange flows would offer deeper insights into user activity and potential accumulation or distribution phases. In the absence of this data, we rely on price action and macro correlations. The current neutral RSI and the tight trading range suggest that speculative interest may be waning temporarily, or that market participants are waiting for a clearer signal from either the macro environment or a significant on-chain development. The absence of a strong narrative - be it regulatory clarity, a major tech upgrade, or a geopolitical event directly impacting digital assets - leaves Bitcoin trading on technicals alone, which, as we've seen, are currently conflicted.
The Oil Shock and Its Ripple Effects
While the focus is on BTCUSD, the energy market provides a critical lens through which to view inflation expectations, a key driver for central bank policy and, by extension, crypto markets. Brent crude is currently trading at $83.41, and WTI at $81.50. Both have experienced significant daily drops, with Brent down 5.63% and WTI down 5.52%. This sharp decline in oil prices, reportedly influenced by factors like Trump's stance on Iran and the replacement of Russian crude in Georgia, has important implications. Lower oil prices can reduce inflationary pressures. This is a double-edged sword for risk assets like Bitcoin. On one hand, it might ease the pressure on central banks to maintain hawkish monetary policies, potentially paving the way for rate cuts which are generally positive for crypto. On the other hand, a sharp drop in oil can sometimes signal weakening global demand, which could negatively impact broader risk sentiment.
The market's reaction to these oil price movements is still unfolding. The fact that both Brent and WTI are showing mixed signals across different timeframes - 1-hour bullish for Brent, 4-hour bearish for WTI, and daily downtrends for both - indicates uncertainty about the future direction of energy prices and their inflationary impact. For BTCUSD, this translates into a less predictable macro environment. If the oil price drop is interpreted as a sign of cooling inflation, it could indirectly support Bitcoin by increasing the likelihood of a looser monetary policy down the line. However, if it signals a broader economic slowdown, the correlation with risk assets could lead to downward pressure on Bitcoin. This interplay between energy prices, inflation, and monetary policy adds another layer of complexity to the current neutral stance observed in BTCUSD.
The Trader's Dilemma: What to Watch Next
The current market environment for BTCUSD is a textbook example of a 'watch zone'. The price is hovering around $63,853, with conflicting technical signals across different timeframes and a neutral RSI. This is not a setup for aggressive long or short positions. Instead, it calls for patience and a focus on confirmation. The key levels to watch are clear: support at $62,977.33 and resistance at $63,775.33 on the 1-hour chart. A decisive break above $63,775.33, ideally with increasing volume and confirmation from other indicators like the MACD moving further into positive territory and RSI climbing above 70, could signal the start of an upward move. Conversely, a break and hold below $62,977.33, accompanied by a falling RSI below 50 and negative MACD momentum, would indicate a bearish outlook.
The lack of strong trend signals on the ADX across most timeframes (17.23 on 1H, 23.24 on 4H, 15.81 on 1D) further emphasizes the current lack of directional commitment. This suggests that any breakout might be sharp but could also be prone to failure if not supported by broader market sentiment or fundamental news. Traders should be looking for confluence - multiple indicators aligning on a direction - before committing capital. For instance, a daily close above $63,775.33, coupled with a strengthening DXY and positive equity market sentiment, would provide a higher-probability bullish setup. Without such confluence, scalpers might attempt short-term trades within the range, but swing and position traders would be wise to wait for a clearer signal.
The conflicting signals across timeframes, particularly the strong daily downtrend indicated by the SP500's ADX at 47.51, present a significant risk. A sudden shift in risk appetite could quickly turn the current neutral BTCUSD stance into a sharp decline. Always manage your risk exposure and consider stop-loss orders when trading in such uncertain conditions.
Scenario Planning: Charting Potential Paths
Bearish Scenario: Liquidity Grab Below Support
45% ProbabilityNeutral Scenario: Range-Bound Trading Continues
35% ProbabilityBullish Scenario: Breakout Above Resistance
20% ProbabilityFrequently Asked Questions: BTCUSD Analysis
What happens if BTCUSD breaks below the $62,977.33 support level?
If BTCUSD closes decisively below $62,977.33 on the 1-hour chart, it would signal a bearish continuation. The MACD would likely turn negative, and the RSI could drop below 50, potentially targeting lower support levels around $61,905.33 as indicated on the daily timeframe.
Should I consider buying BTCUSD at current levels of $63,853 given the neutral RSI?
Buying at current levels without confirmation carries significant risk due to the neutral RSI (60.13 on 1H) and conflicting signals across timeframes. A more prudent approach would be to wait for a confirmed breakout above $63,775.33 or a retest of support near $62,977.33 with bullish reversal signs.
Is the RSI at 60.13 a sell signal for BTCUSD right now?
An RSI of 60.13 on the 1-hour chart is not inherently a sell signal; it indicates neutral momentum with a slight bullish leaning but suggests that immediate upside may be limited. A true sell signal would typically involve RSI moving below 50 or showing bearish divergence, especially when confirmed by other bearish indicators like MACD.
How might the DXY at 100.02 affect BTCUSD this week?
With the DXY at 100.02, which is a key psychological level and shows a moderate downtrend on the daily, its influence on BTCUSD is significant. A continued rise in the DXY could cap potential upside for BTCUSD, especially if the dollar strength is driven by risk-off sentiment, even if other crypto-specific indicators appear neutral or bullish.
Technical Outlook Summary
| Indicator | Value | Signal | Interpretation |
|---|---|---|---|
| RSI (14) | 60.13 | Neutral | Suggests stalled momentum, watching for overbought/oversold. |
| MACD Histogram | Positive | Bullish Momentum | Indicates upward pressure, but needs confirmation. |
| Stochastic | K=31.74, D=55.82 | Bearish Crossover | Suggests potential pullback from current levels. |
| ADX | 21.68 | Weak Trend | Indicates lack of strong directional commitment. |
| Bollinger Bands | Middle Band Breakout | Watch | Price above middle band suggests upward bias, but needs confirmation. |
Key Levels for BTCUSD
Support Levels
Resistance Levels
Track markets in real-time
AI-powered analysis, technical indicators and real-time price data.
Join Our Telegram Channel
Breaking market news, AI analysis and trading signals instantly.
Join Channel