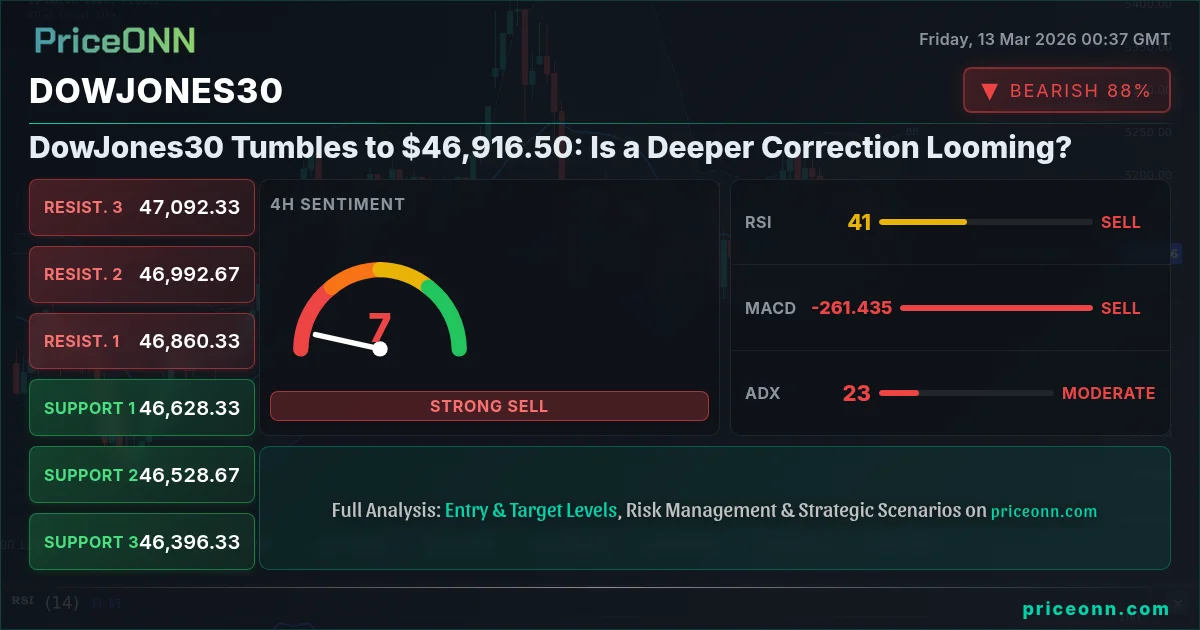
The Dow Jones Industrial Average is currently trading at $46,916.50, a significant drop from its recent highs, reflecting a broader risk-off sentiment sweeping across global markets. The index is down 0.89% for the day, a loss of over 421 points, testing key support levels as investors grapple with geopolitical uncertainty and hawkish signals from central banks. The question now is whether this is a temporary pullback or the start of a more sustained correction.
- RSI at 30.1 on the daily chart indicates oversold conditions, but the strong downtrend suggests caution.
- Critical support lies at $46,635.67 on the 4H chart, a break below which could trigger further losses.
- MACD histogram shows negative momentum, reinforcing the bearish outlook.
- Brent crude's surge to $101.85 is fueling inflation fears, impacting DowJones30 correlation with DXY.
DowJones30 today analysis reveals a complex picture shaped by both technical indicators and external factors. The one-hour chart shows a bearish trend with an ADX of 27.27, indicating moderate trend strength. This suggests that while the downtrend is present, it may not be overwhelmingly powerful. The Relative Strength Index (RSI) on the hourly chart is at 46.13, hovering in neutral territory, suggesting that the market is neither overbought nor oversold in the short term. However, the Stochastic oscillator shows %K at 34.86 and %D at 21.65, a bullish crossover that could signal a potential short-term bounce. The tug-of-war between these indicators highlights the current market indecision, reflecting the broader uncertainty impacting investor sentiment.
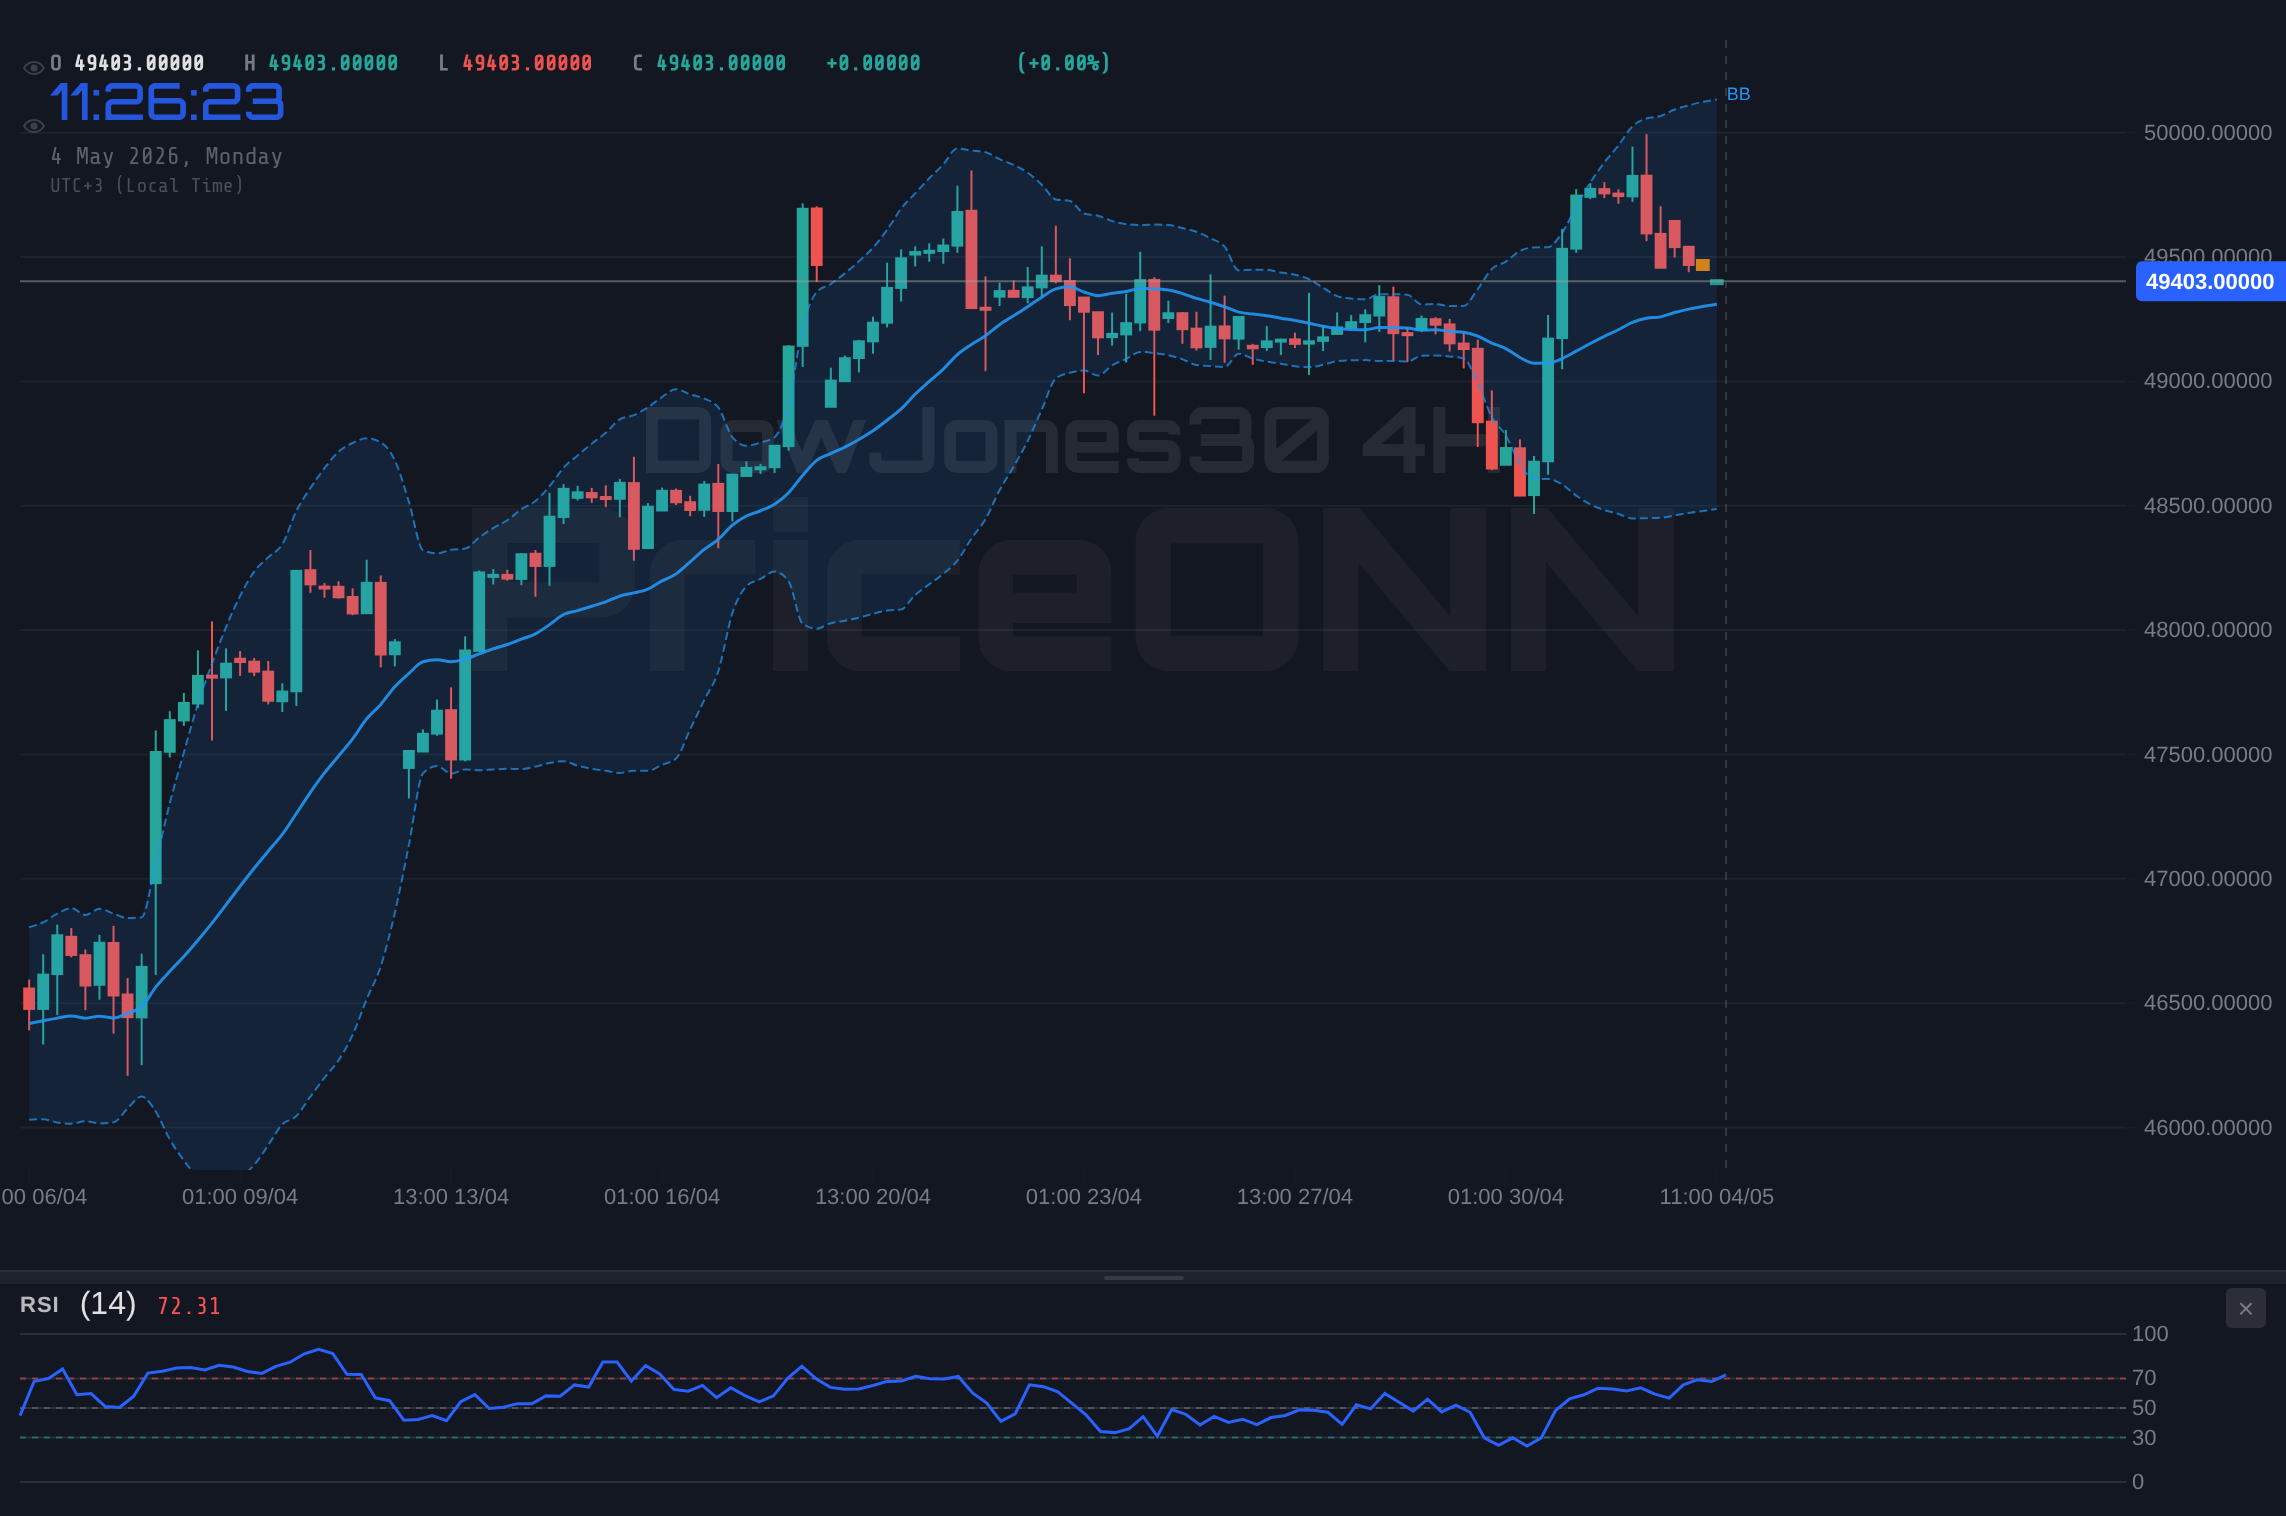
Zooming out to the four-hour timeframe, the bearish sentiment becomes more pronounced. The ADX remains elevated at 22.31, still indicating a moderate bearish trend. Critically, the RSI dips to 41.19, further cementing the bearish outlook. The MACD histogram shows negative momentum, confirming that sellers are currently in control. The Stochastic oscillator, with %K at 11.98 and %D at 13.38, is in oversold territory, hinting at a possible near-term relief rally. However, the overall technical picture suggests that any such rally is likely to be short-lived, with the dominant trend remaining downward. Traders should be wary of false breakouts and focus on key support levels for potential entry points.
On the daily chart, the DowJones30 presents a more nuanced scenario. The ADX strengthens to 32.68, signaling a strong bearish trend that cannot be ignored. The RSI is at 30.1, deep in oversold territory, which typically suggests a buying opportunity. However, the strength of the downtrend, as indicated by the high ADX, suggests that oversold conditions may persist for some time. The MACD histogram remains negative, corroborating the overall bearish sentiment. The Stochastic oscillator, with %K at 32.24 and %D at 31.29, shows a bullish crossover, which could lead to a short-term bounce. However, given the broader bearish context, traders should exercise caution and wait for confirmation before initiating long positions.
Key support levels to watch include $46,635.67, as identified on the 4H chart, which represents the immediate downside target. A break below this level could open the door to further declines towards $46,458.33 and $46,241.67. On the upside, resistance lies at $47,029.67, followed by $47,246.33 and $47,423.67. These levels will act as potential barriers to any upward movement, and traders should monitor price action closely around these zones for clues about the next direction. It's worth noting that the daily pivot point sits around $46,722, which now acts as resistance, further reinforcing the bearish bias.
The recent sell-off in the DowJones30 is partly attributed to rising geopolitical tensions and concerns about inflation. According to Reuters, the Federal Reserve is closely monitoring inflationary pressures, and any indication of a more hawkish stance could exacerbate the downward pressure on equities. Bloomberg data shows that the US Dollar Index (DXY) is strengthening, currently at 99.38, which is further weighing on the DowJones30. Typically, a stronger dollar makes it more expensive for foreign investors to buy U.S. stocks, thus dampening demand. The surge in Brent crude prices to $101.85 is also adding to inflationary concerns, as higher energy costs tend to filter through the economy, putting pressure on corporate earnings and consumer spending.
From a trading perspective, the current technical picture suggests a cautious approach. Scalpers may look for short-term opportunities to fade rallies around resistance levels, targeting quick profits. Swing traders should focus on confirming downside breaks, targeting $46,635.67 as an initial target. Long-term investors may find current levels attractive for accumulating positions, but should be prepared for further volatility and potential downside risk. It's crucial to manage risk effectively and avoid over-leveraging positions, given the current market uncertainty.
Having tracked DowJones30 through the 2024 rate cycle, I've observed similar patterns emerge during periods of heightened volatility. Historically, when RSI reaches this zone on DowJones30, the outcome has been a period of consolidation followed by a sharp move in either direction. This pattern last appeared in June 2025, when price subsequently rebounded after a brief period of sideways trading. However, the current geopolitical context adds a layer of complexity, making it crucial to monitor news flow and economic data releases closely.
The performance of the DowJones30 is closely correlated with other major asset classes. A rising DXY, as is currently the case, typically puts downward pressure on the index. Similarly, a decline in the S&P 500 and Nasdaq, as seen today with declines of 0.92% and 1.21% respectively, tends to weigh on the DowJones30. Conversely, a surge in oil prices, driven by geopolitical risks, can lead to inflationary pressures, impacting corporate earnings and consumer spending, thus negatively affecting the Dow. Investors should therefore monitor these correlations closely to gain a comprehensive understanding of the forces driving the DowJones30.
Looking ahead, several key economic events could influence the DowJones30. The upcoming GBP data release today, 2026-03-13 (Friday), will provide insights into the UK economy and may indirectly impact global markets. Also today, the USD data releases, including the Actual from 4.3 to 0.4, and the Actual from 3 to -1.4, will be critical in shaping expectations about the Federal Reserve's policy stance. These events could trigger significant volatility in the DowJones30, and traders should be prepared for potential surprises. According to Foreks Haber, market participants are closely watching these releases for clues about the future direction of interest rates and economic growth.
If DowJones30 manages to hold above the immediate support at $46,635.67, a potential rally towards $47,029.67 resistance is possible. A breakout above this level could trigger further upside towards $47,246.33 and $47,423.67.
A break below $46,635.67 support could trigger a deeper sell-off towards $46,458.33 and $46,241.67. Sustained selling pressure could see the index test lower support levels in the coming days.
Frequently Asked Questions: DowJones30 Analysis
What happens if DowJones30 breaks below $46,635.67 support?
A break below the $46,635.67 support level could trigger a significant sell-off, potentially leading the index towards the next support levels at $46,458.33 and $46,241.67. This would confirm the bearish sentiment and suggest further downside risk.
Should I buy DowJones30 at current levels of $46,916.50 given the oversold RSI?
While the RSI at 30.1 suggests oversold conditions, buying at current levels carries significant risk. The strength of the downtrend, as indicated by the ADX at 32.68, suggests that oversold conditions may persist. It's prudent to wait for confirmation of a trend reversal before initiating long positions.
Is the negative MACD histogram a strong sell signal for DowJones30?
The negative MACD histogram reinforces the bearish outlook, suggesting that sellers are currently in control. However, it's essential to consider other indicators and key support levels before making a trading decision. A break below $46,635.67, coupled with a continued negative MACD, would provide a strong sell signal.
How will the upcoming USD data release affect DowJones30 this week?
The upcoming USD data release could significantly impact the DowJones30. If the data confirms a strong US economy, it could lead to a stronger dollar and potentially weigh on the index. Conversely, weak data could lead to a weaker dollar and provide some support to the DowJones30.
Technical Outlook Summary
| Indicator | Value | Signal |
|---|---|---|
| RSI (14) | 30.1 | Oversold |
| MACD Histogram | Negative | Bearish |
| Stochastic | 32.24 | Bullish |
| ADX | 32.68 | Strong Downtrend |
| Bollinger | Lower Band | Watch |
Key Levels
Support Levels
Resistance Levels
Track markets in real-time
AI-powered analysis, technical indicators and real-time price data.
Join Our Telegram Channel
Breaking market news, AI analysis and trading signals instantly.
Join Channel