The dollar index (DXY) finds itself at a pivotal juncture, trading near $99.39 amid a confluence of factors, from escalating geopolitical tensions to shifting expectations regarding Federal Reserve policy. Bulls and bears are locked in a fierce tug-of-war, each vying for control of the narrative and the direction of the market. The question now is: can the DXY sustain its upward momentum and breach the psychologically significant 100 level, or will it succumb to selling pressure and retreat?
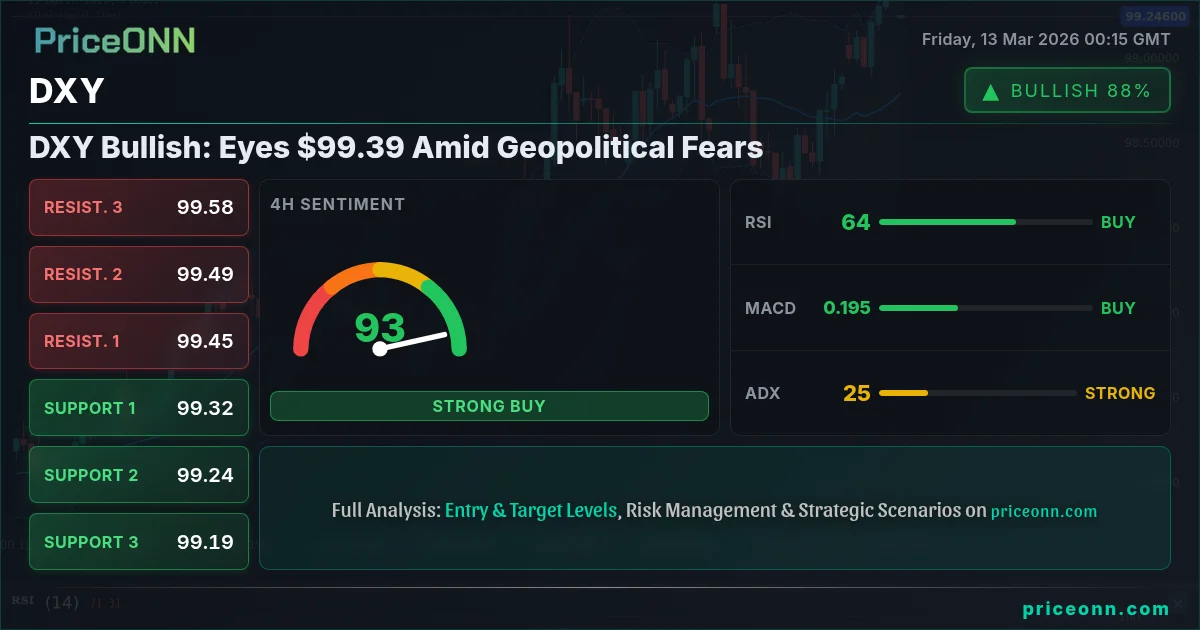
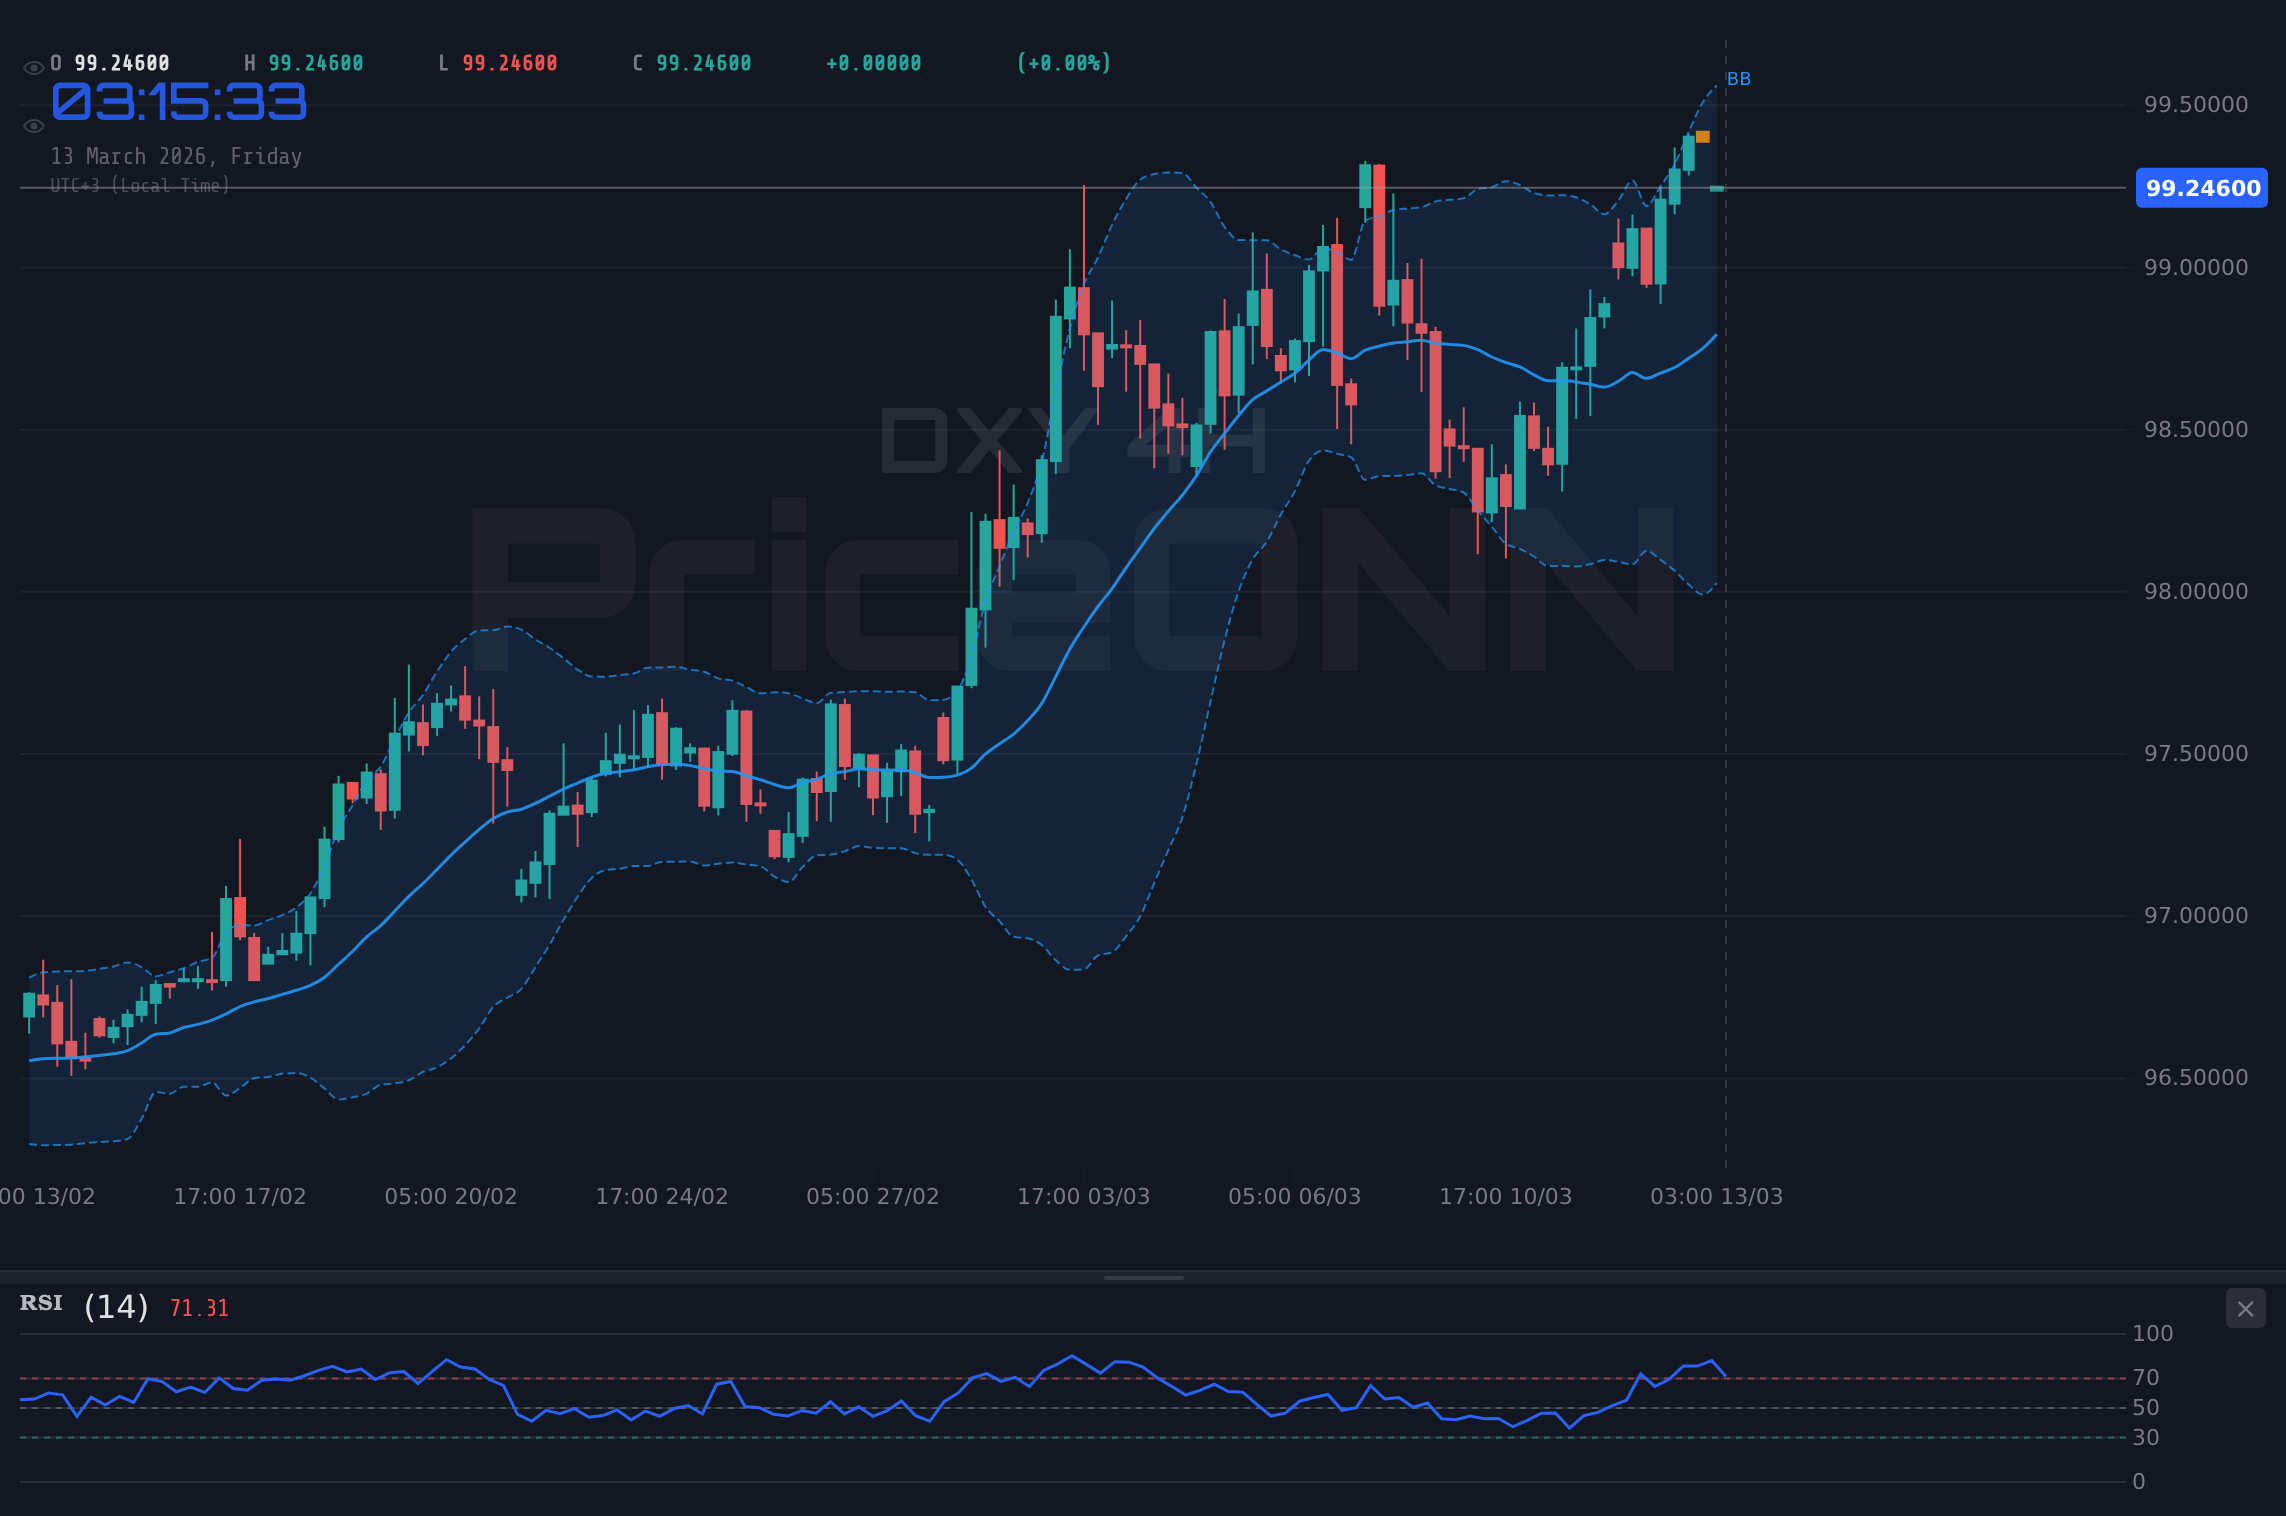
- RSI at 72.54 on the 1H chart signals overbought conditions, suggesting a possible pullback.
- Key resistance lies at $99.39, a break above which could trigger further gains.
- The DXY's positive correlation with rising Brent crude oil prices, currently at $101.85, adds to inflationary pressures.
- Upcoming USD data releases on Friday will be crucial in determining the DXY's short-term direction.
To understand the current dynamics, it's essential to delve into the bull and bear cases for the DXY. Let’s examine both, and then see how the technicals might tip the scales.
The Bull Case for DXY
The bullish argument for the DXY centers primarily on its safe-haven appeal amidst heightened geopolitical risks. As reported by Reuters, escalating tensions in the Middle East and Eastern Europe have triggered a flight to safety, with investors seeking refuge in the perceived stability of the US dollar. With the ongoing conflict in Ukraine and renewed tensions in the Middle East, the demand for US dollars as a store of value is likely to remain elevated. Furthermore, the relatively hawkish stance of the Federal Reserve, compared to other major central banks, provides additional support for the DXY. While other central banks are contemplating easing monetary policy, the Fed is expected to maintain its restrictive stance for the foreseeable future, bolstering the dollar's attractiveness to yield-seeking investors. The DXY is showing a strong upward trend with a score of 100% on the 1H timeframe. The current price is near the high of the day, indicating the bullish movement may continue.
Furthermore, the strength of the US economy relative to its peers lends credence to the bullish narrative. Recent economic data has painted a picture of resilience, with robust job growth and steady consumer spending. This economic outperformance supports the case for a stronger dollar, as it suggests that the Fed may have more room to maneuver in terms of monetary policy. A strong dollar is often seen as a reflection of a healthy economy, further attracting foreign investment and reinforcing the bullish cycle. As WTI crude oil eyes $100, rising oil prices stoke inflation fears, potentially pushing the Federal Reserve toward a more hawkish stance. The 1H Stochastic K=96.25, D=89.07 further indicates that the asset is in overbought territory and the bullish trend is strong.
The Bear Case for DXY
Conversely, the bearish argument for the DXY hinges on the possibility of a dovish pivot by the Federal Reserve and the potential for a slowdown in the US economy. While the Fed has maintained a hawkish tone, there are signs that it may be nearing the end of its tightening cycle. Inflation, while still above the Fed's target, has shown signs of moderating in recent months, potentially paving the way for a shift in policy. Moreover, concerns about the sustainability of the US economic expansion have begun to surface, with some economists predicting a recession in the not-too-distant future. A weakening economy could prompt the Fed to ease monetary policy, undermining the dollar's appeal. The RSI(14) is at 72.54, indicating that the asset may be overbought and a selling pressure may be building.
The decline in risk appetite can also increase the value of the DXY. The SP500 is down 1.21% which indicates a decline in investor confidence. A decline in investor confidence can lead to investors seeking safe-haven assets, thus increasing the value of the DXY. The current price of the SP500 is 6682.55. Additionally, the potential for increased global trade tensions could also weigh on the DXY. While the US has reached trade agreements with some countries, disputes with others remain unresolved. Escalating trade wars could disrupt global economic activity and lead to a decline in demand for US dollars. It is important to note that the daily change of the DXY is only 0.51% and the price has remained relatively stable. The next few trading sessions will be important to determine if the bullish trend will continue.
Technicals as Tiebreaker
Turning to the technicals, the DXY's current price action presents a mixed picture. On the one hand, the index is trading above its 200-day moving average, suggesting a long-term uptrend. The 1H ADX of 33.98 confirms a strong upward trend. On the other hand, the Relative Strength Index (RSI) on the 1H timeframe is at 72.54, indicating overbought conditions and the potential for a pullback. The Stochastic K=96.25, D=89.07 further confirms that the asset is in overbought territory. The DXY is currently facing resistance around the $99.39 level. The index has struggled to break above this level in recent sessions, suggesting that it may be a significant barrier to further gains. The next resistance level sits at 99.43. The support level sits at 99.33.
A break above $99.39 could open the door for a test of the psychologically important 100 level, while a failure to do so could lead to a retreat towards the $99.33 support level. Scalpers should watch for a break above the immediate resistance at $99.39 for potential long opportunities, while swing traders may want to wait for a confirmed breakout above 100 before entering long positions. Long-term investors should focus on the overall trend and consider adding to their positions on pullbacks. Having tracked DXY through the 2024 rate cycle, I’ve observed similar patterns where initial breakouts lead to short-term pullbacks before resuming the upward trend. Historically, when the RSI reaches this zone on DXY, the outcome has often been a period of consolidation before the next move. The 1D ADX score is 27.64, which indicates a strong upward trend.
Economic Calendar and Geopolitical Factors
Looking ahead, several key economic events and geopolitical developments could influence the DXY's trajectory. The upcoming USD data releases on Friday will be closely watched for clues about the health of the US economy and the Fed's policy outlook. Better-than-expected data could bolster the dollar, while weaker-than-expected data could weigh on it. Additionally, any escalation of geopolitical tensions could trigger further safe-haven flows into the dollar, while a de-escalation could lead to a reversal. The market sentiment is also an important factor to consider. A risk-on environment could lead to a decline in demand for US dollars, while a risk-off environment could increase demand. The current market sentiment is mixed, with some investors remaining cautious due to geopolitical risks, while others are becoming more optimistic about the global economic outlook.
Trade Plan
Given the technical and fundamental backdrop, a cautious bullish approach appears warranted. While the DXY is facing resistance at $99.39, the overall trend remains positive, and the potential for further safe-haven flows is significant. The ADX is at 24.62, indicating a moderate trend. The RSI and MACD histogram are aligned, providing a clear directional signal. However, the Stochastic is in an extreme zone, making entry timing uncertain. Therefore, traders should exercise patience and wait for a confirmed breakout above $99.39 before entering long positions. Here are the potential scenarios:
A break above $99.39 resistance targets $99.43 and then $99.45. Continued geopolitical tensions and a hawkish Fed stance would support this scenario.
Failure to break $99.39 leads to a decline towards $99.33 and possibly $99.31. A dovish Fed pivot or easing of geopolitical tensions could trigger this.
Correlation Analysis
The DXY's performance is closely correlated with several other key markets. A rising DXY typically puts downward pressure on gold, as the precious metal becomes more expensive for holders of other currencies. Conversely, a falling DXY tends to support gold prices. Similarly, the DXY has an inverse relationship with major currency pairs such as EURUSD, GBPUSD, AUDUSD, and NZDUSD. A stronger dollar weakens these currencies, while a weaker dollar strengthens them. The DXY is also influenced by movements in US Treasury yields. Rising yields tend to support the dollar, as they attract foreign investment, while falling yields tend to weigh on it. The DXY's correlation with equities is more complex and can vary depending on the prevailing market conditions. In general, a risk-on environment tends to be negative for the dollar, as investors seek higher-yielding assets, while a risk-off environment tends to be positive for the dollar, as investors seek safe-haven assets.
Frequently Asked Questions: DXY Analysis
What happens if DXY breaks above $99.39 resistance?
A break above the $99.39 resistance level could signal further upside for the DXY, potentially leading to a test of the psychologically important 100 level. The next resistance level is $99.43. Continued geopolitical tensions and a hawkish Fed stance would support this scenario.
Should I buy DXY at current levels of $99.39 given RSI at 72.54?
Given the RSI reading of 72.54 on the 1H timeframe, which indicates overbought conditions, it may be prudent to exercise caution before initiating new long positions at the current level of $99.39. A potential pullback is possible. Traders should look for a confirmed breakout above $99.39 before considering long positions.
Is RSI at 72.54 a sell signal for DXY right now?
While an RSI reading of 72.54 suggests overbought conditions, it is not necessarily a definitive sell signal. A more conservative approach would be to wait for confirmation of a bearish reversal pattern or a break below a key support level before initiating short positions. The support level sits at $99.33.
How will the USD data releases on Friday affect DXY this week?
The upcoming USD data releases on Friday will be crucial in determining the DXY's short-term direction. Better-than-expected data could bolster the dollar, while weaker-than-expected data could weigh on it. Traders should pay close attention to these releases and adjust their positions accordingly.
Technical Outlook Summary
| Indicator | Value | Signal |
|---|---|---|
| RSI (14) | 72.54 | Overbought |
| MACD Histogram | Positive | Bullish |
| Stochastic | 96.25/89.07 | Overbought |
| ADX | 33.98 | Strong Trend |
| Bollinger | Upper Band | Watch |
Key Levels
Support Levels
Resistance Levels
Track markets in real-time
AI-powered analysis, technical indicators and real-time price data.
Join Our Telegram Channel
Breaking market news, AI analysis and trading signals instantly.
Join Channel