

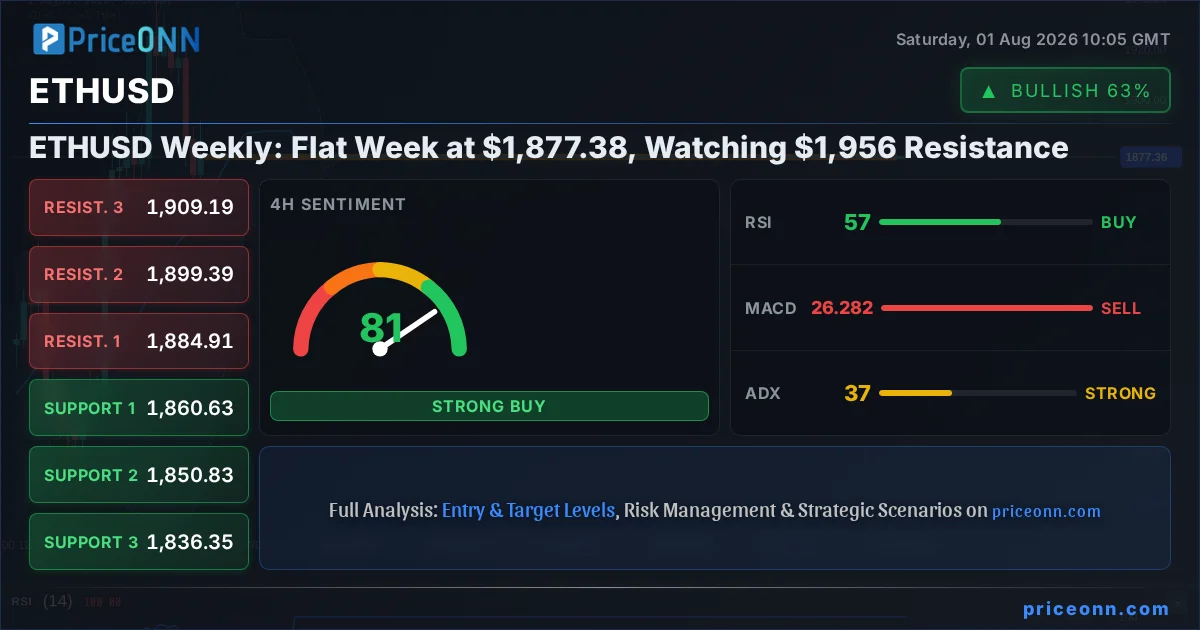
The crypto market, particularly Ethereum (ETHUSD), has experienced a period of consolidation, trading flat around the $1,877.38 mark. This lack of decisive movement sets the stage for a crucial battle between bulls and bears, with key levels like $1,956 resistance and $1,827 support becoming the focal points for the upcoming week. After a week characterized by ranging price action, traders are keenly observing the interplay of technical indicators, macro-economic undercurrents, and the ongoing narrative surrounding institutional adoption to decipher ETHUSD's next significant move. This analysis dives deep into the current market sentiment, technical setups, and the fundamental drivers that could shape Ethereum's trajectory.
- ETHUSD is currently trading flat around $1,877.38, indicating a neutral market sentiment with indecision.
- The Relative Strength Index (RSI) at 39.48 on the 1H chart signals falling momentum, suggesting potential for further downside pressure.
- Key resistance is observed at $1,956.29, a level that needs a decisive break for bullish sentiment to re-emerge.
- Critical support lies at $1,827.25, a level that has held firm on the 1D chart, acting as a potential floor for the current consolidation.
- The correlation with the strengthening DXY at 100.7 is exerting pressure on crypto assets, including ETHUSD.
Navigating the Sideways Shuffle: ETHUSD's Consolidation Phase
The Indecisive Dance Around $1,877.38
Ethereum (ETHUSD) has found itself in a rather uninspired holding pattern, hovering precariously around the $1,877.38 level. This period of consolidation, often characterized by a lack of significant directional conviction, can be frustrating for traders seeking clear trends. However, within this apparent stillness, a critical battle is being waged between the bulls, who aim to push the price towards higher resistance levels, and the bears, who are looking to capitalize on any weakness to drive prices lower towards established support zones. The current market sentiment, as reflected by the mixed signals across different timeframes and indicators, suggests that neither side has gained a definitive upper hand. The price action on the 1-hour chart, for instance, shows a neutral trend with a power of 50%, underscoring the equilibrium. Yet, the underlying momentum, particularly the negative MACD reading and the RSI at 39.48, hints at a subtle bearish undertone on shorter timeframes, suggesting that while the price is holding, the underlying pressure might be downwards. This delicate balance is precisely why monitoring key technical levels becomes paramount, as a break above resistance or below support could signal the end of this placid period.
The Psychology of Flat Markets
Sideways markets are often a test of patience and discipline. For many, the lack of clear direction can lead to impulsive trading decisions, attempting to force a move that isn't yet present. This is where a deep understanding of market cycles and trader behavior becomes invaluable. Consolidation phases are not merely pauses; they are periods of digestion where previous trends are re-evaluated, new capital flows are assessed, and underlying supply and demand dynamics are subtly shifting. In the context of ETHUSD, this flat week might be a precursor to a significant move, or it could simply be a prolonged period of equilibrium before the next directional impulse. The key takeaway for traders is to resist the urge to over-trade and instead focus on identifying the conditions that would validate either a bullish continuation or a bearish breakdown. The current price of $1,877.38 represents a critical junction, and the behavior of price around this level in the coming days will be highly instructive.
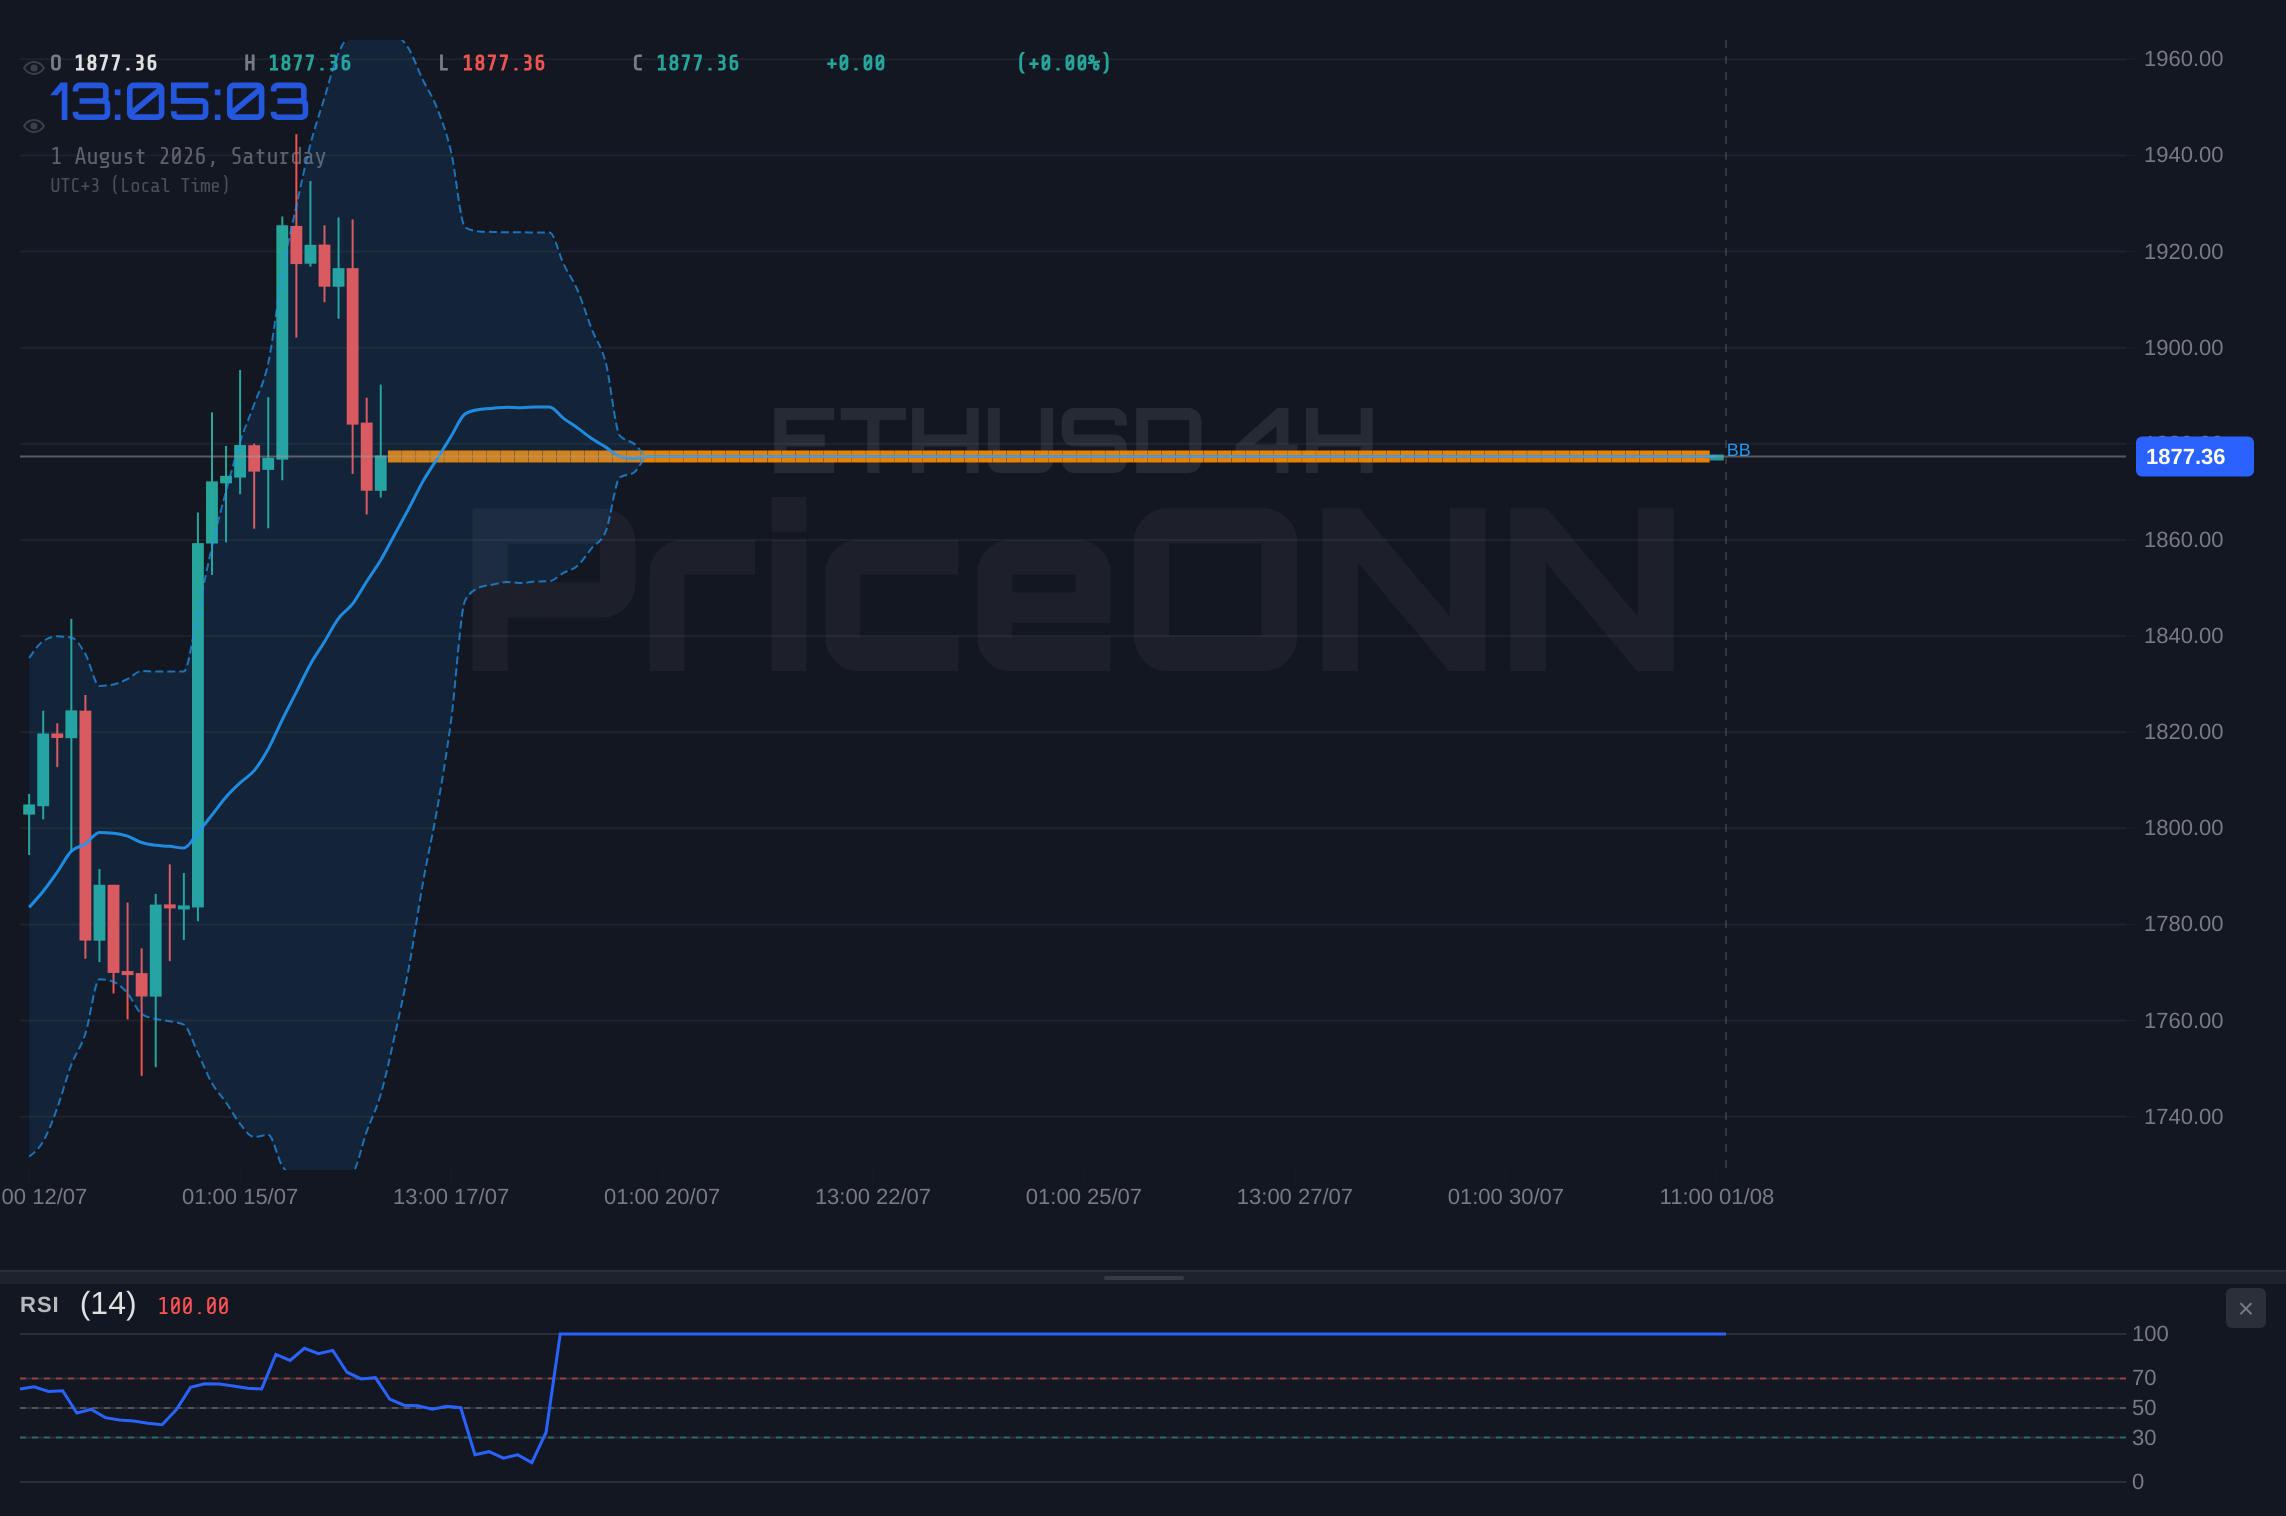
The Bull Case: Reclaiming the High Ground
Rallying Towards Resistance at $1,956
For the bulls to regain control and signal a potential continuation of the prior upward trend, a decisive move above the immediate resistance levels is imperative. The data points to the first significant hurdle at $1,903.83 on the 1-hour timeframe, followed by a more substantial resistance zone between $1,915.34 and $1,956.29. A successful breach and hold above these levels would invalidate the current consolidation narrative and open the door for further upside potential. On the 4-hour chart, the trend is already leaning bullish with a strength of 94%, and the RSI at 56.88, while not showing extreme overbought conditions, indicates a healthy upward momentum building. Similarly, the daily chart shows a bullish trend with 86% strength, and the RSI at 59.95 supports this view. The Stochastic oscillator on the daily chart, with K at 83.32 and D at 75.77, is signaling a bullish crossover in the overbought territory, which, while sometimes preceding a pullback, often confirms strong upward momentum in trending markets. A break above the $1,956.29 resistance, particularly with increasing volume, would be a strong signal for bulls, suggesting that the market is ready to re-test higher price points, potentially targeting psychological levels beyond $2,000.
The Role of Macro and On-Chain Support
The bullish narrative for ETHUSD isn't solely reliant on technical breaks; it also requires a supportive macro-economic environment and positive on-chain developments. While the current DXY reading of 100.7 exerts some pressure, any signs of dollar weakness or a shift in central bank rhetoric towards a more dovish stance could provide a tailwind for risk assets like Ethereum. Furthermore, looking at on-chain metrics, a sustained increase in active addresses, a growing number of whale holdings, and positive exchange flows (indicating accumulation rather than distribution) would further bolster the bull case. The current on-chain data, though not detailed here, would need to show a trend of accumulation to confirm the bullish technical signals. The correlation with Bitcoin (BTCUSD) also plays a crucial role; if Bitcoin can solidify its position above $64,000, it often pulls Ethereum along with it. The daily MACD on ETHUSD is currently positive, with the MACD line above its signal line, which is a classic bullish indicator, suggesting that underlying momentum is building, even if it's not yet reflected in a decisive price breakout. This confluence of technical strength on higher timeframes and potential macro tailwinds provides a foundation for the optimistic outlook.
A confirmed daily close above the $1,956.29 resistance level, ideally accompanied by increased trading volume, would strongly signal a continuation of the bullish trend.
The Bear Case: Testing the Defenses at $1,827
The Threat of a Breakdown Below $1,827 Support
Conversely, the bearish argument hinges on the failure of current support levels and the potential for a more significant downturn. The immediate support on the 1-hour chart is identified at $1,868.34, followed by $1,856.83. However, the more critical level, as indicated by the daily chart's structure, is $1,827.25. A decisive break below this level would signify a failure of the current consolidation to hold and could trigger a cascade of selling as stop-loss orders are likely to be positioned just beneath it. The technical indicators on shorter timeframes paint a concerning picture for bulls. The 1-hour RSI at 39.48 is well within the neutral zone but trending downwards, and the MACD is showing negative momentum with the MACD line below its signal line. The Stochastic on the 1-hour chart, while showing a potential bullish crossover, is doing so from oversold levels, which might not carry significant weight if broader bearish momentum persists. The ADX on the 1-hour chart at 29.09 indicates a strong downtrend is already in play on this timeframe, further supporting the bearish thesis. If ETHUSD were to fall below $1,827.25, the next significant support level to watch would be $1,792.15, a substantial drop from current prices.
Macro Headwinds and Bearish Technicals
Several factors could contribute to a bearish outcome for ETHUSD. The strengthening US Dollar Index (DXY), currently at 100.7, is a significant headwind. Historically, a rising dollar often correlates with falling prices in riskier assets like cryptocurrencies. The US economy's GDP growth slowing to 1.5% in the second quarter, missing forecasts, while potentially leading to a less hawkish Fed, also signals economic headwinds that could dampen investor appetite for risk. The negative momentum observed in the MACD on the 1-hour and 4-hour charts, coupled with the bearish signals from Stochastic on the 4-hour chart (%K
A decisive daily close below the $1,827.25 support level would invalidate the current consolidation and likely accelerate selling pressure.
The Tightrope Walk: Technical Indicators in Conflict
Conflicting Signals Across Timeframes
The current technical landscape for ETHUSD presents a classic case of conflicting signals across different timeframes, reflecting the market's indecision. While the 1-hour chart displays bearish momentum with RSI at 39.48 and negative MACD, hinting at potential downside, the 4-hour and daily charts show stronger bullish trends. The 4-hour chart exhibits a bullish trend with 94% strength and an RSI of 56.88, suggesting underlying upward momentum. Similarly, the daily chart reinforces this with an 86% bullish trend strength and an RSI of 59.95. This divergence is where skilled traders find their edge. The Stochastic oscillator offers a mixed bag: a bullish signal on the 1-hour and daily charts (K > D), but a bearish signal on the 4-hour chart (K
Interpreting the Mixed Signals
When faced with such mixed signals, the prudent approach is often to wait for confirmation or to trade based on the higher timeframe trend, while acknowledging the risks from shorter-term counter-movements. The daily chart's bullish bias, supported by RSI and MACD, suggests that the longer-term outlook might still be positive. However, the immediate bearish pressure on the 1-hour chart, coupled with the significant resistance at $1,956.29, means that the upside is currently capped. The Stochastic's bullish crossover on the daily chart, while appearing in overbought territory, can sometimes precede significant rallies in strong trends. The key question becomes: which timeframe's signals are more likely to prevail? Given the mixed signals and the current consolidation, it's reasonable to assume that price action around the $1,877.38 level will dictate the short-term direction. A break above $1,903.83 could signal a move towards the $1,956.29 resistance, validating the daily bullish bias. Conversely, a failure to hold $1,868.34 and a subsequent break below $1,827.25 would align with the bearish signals seen on the shorter timeframes and invalidate the higher timeframe bullish outlook. The market is essentially waiting for a catalyst to break this stalemate.
Focus on price action relative to the $1,827 and $1,956 levels. Higher timeframe indicators suggest potential upside, but confirmation is needed. Shorter-term indicators show bearish momentum which could lead to a test of support.
The Macroeconomic Backdrop: DXY Strength and Growth Slowdown
Dollar's Resurgence and its Impact on ETHUSD
The recent strengthening of the US Dollar Index (DXY), now trading at 100.7, is a significant factor influencing ETHUSD and other risk assets. The dollar regained traction following a post-Fed drop, partly fueled by worsening geopolitical situations expected to continue fueling inflation. A stronger dollar typically exerts downward pressure on commodities like gold and silver, and by extension, on cryptocurrencies, which are often seen as higher-risk assets. This inverse correlation means that as the dollar gains strength, the cost of dollar-denominated assets like ETHUSD effectively increases for holders of other currencies, potentially dampening demand. While the US economy grew at a slower-than-expected pace of 1.5% in the second quarter, missing forecasts, this slowdown hasn't immediately led to a weaker dollar. Instead, the market seems to be pricing in continued economic resilience or perhaps a prolonged period of higher interest rates if inflation remains sticky. This macro environment creates a challenging backdrop for ETHUSD, requiring any bullish momentum to overcome the headwinds of a strong dollar.
Economic Slowdown and Fed Rate Expectations
The US GDP growth slowing to 1.5% in the second quarter is a key data point that traders are dissecting. While a slowdown might normally suggest a more dovish stance from the Federal Reserve, the context of persistent inflation means the Fed might still be hesitant to signal an end to its tightening cycle. The upcoming Non-Farm Payrolls (NFP) report, due later this week, will be crucial in shaping these expectations. Stronger-than-expected jobs data could reignite fears of further rate hikes, bolstering the dollar and pressuring ETHUSD. Conversely, a weak NFP report might lead to a reassessment of Fed policy, potentially weakening the dollar and offering some relief to risk assets. The market's reaction to this economic data will be critical. The current environment suggests that while the Fed might be nearing the end of its hiking cycle, the path forward remains data-dependent, creating ongoing volatility and uncertainty that can impact ETHUSD's price action. The interplay between inflation, growth, and Fed policy will be the dominant theme for the foreseeable future.
The strengthening DXY at 100.7, coupled with slowing US GDP growth (1.5%), creates a mixed macro environment for ETHUSD. Traders are awaiting the NFP report for clearer signals on Fed policy.
On-Chain Insights and Ecosystem Developments
Active Addresses and Transaction Volume
While specific on-chain data for ETHUSD wasn't provided in the live feed, understanding these metrics is crucial for a comprehensive analysis. A sustained increase in active addresses typically indicates growing network adoption and utility, which is a fundamental bullish sign for Ethereum. Conversely, a decline in active addresses, even if the price is holding steady, could signal waning interest and potential for future weakness. Similarly, transaction volume provides insights into network activity. High transaction volume during price consolidation might suggest accumulation or distribution among active participants, while low volume could indicate a lack of conviction. Monitoring the flow of ETH to and from exchanges is also vital. Significant inflows to exchanges often precede selling pressure, as holders may be looking to liquidate positions, whereas outflows suggest accumulation and a belief in long-term value.
Whale Movements and Smart Money Behavior
The behavior of large ETH holders, often referred to as 'whales', can significantly impact price action. Tracking the accumulation or distribution patterns of these large wallets provides valuable insight into smart money sentiment. If whales are steadily accumulating ETH, it suggests confidence in future price appreciation. Conversely, if they are seen moving large amounts of ETH to exchanges or selling off their holdings, it could be a bearish signal. Analyzing the Net Unrealized Profit/Loss (NUPL) metric can also offer clues about market sentiment. When NUPL is high, indicating widespread profits, it can signal a market top where holders might be tempted to take profits. When NUPL is low or negative, it suggests capitulation or accumulation phases, potentially signaling a bottom. Without this specific on-chain data, a part of the fundamental picture remains incomplete, but the general principles of network adoption and smart money flow remain key considerations for any ETHUSD analysis.
Monitor active addresses, transaction volume, exchange flows, and whale movements for ETH. Positive trends in these metrics would support the bullish case, while negative trends would align with bearish expectations.
The Bitcoin Dominance Factor and Altcoin Correlations
ETHUSD's Relationship with Bitcoin
Ethereum (ETHUSD) rarely moves in isolation; its price action is heavily influenced by its larger counterpart, Bitcoin (BTCUSD). The correlation between ETHUSD and BTCUSD has historically been high, meaning that when Bitcoin rises, Ethereum often follows, and vice versa. Currently, BTCUSD is trading around $64,629.65, showing some bearish momentum on shorter timeframes but maintaining a generally neutral to slightly bullish outlook on higher timeframes. For ETHUSD to break out convincingly to the upside, a strong showing from Bitcoin is often a prerequisite. If BTCUSD struggles to hold above its support levels around $63,327, it could easily drag ETHUSD down, regardless of any positive individual factors for Ethereum. Conversely, a strong move by Bitcoin above its resistance levels could provide the necessary positive sentiment and liquidity injection to help ETHUSD break through its own resistance at $1,956.29.
Altcoin Market Sentiment and ETHUSD's Role
Ethereum also acts as a bellwether for the broader altcoin market. Its performance often sets the tone for other altcoins. If ETHUSD shows strength and breaks out to new highs, it typically ushers in a period of altcoin outperformance, often referred to as an 'altcoin season'. Conversely, if ETHUSD falters or enters a prolonged downtrend, it can lead to a general risk-off sentiment in the altcoin space, causing many altcoins to underperform or decline sharply. Currently, with ETHUSD in consolidation, the altcoin market is likely experiencing similar indecision. The overall 'General Signal' across many altcoins in the provided data leans towards neutral or mixed, reflecting this lack of clear direction. Therefore, watching ETHUSD's ability to decisively break its key resistance levels is not just important for Ethereum itself, but also provides a crucial indicator for the health and direction of the entire altcoin market. A sustained rally in ETHUSD could be the catalyst needed to ignite broader interest and investment across the altcoin ecosystem.
ETHUSD's price action is closely tied to BTCUSD. A bullish breakout in Bitcoin above $65,551 would likely support a similar move in ETHUSD above $1,956.
The Regulatory Landscape and Institutional Adoption
Navigating Regulatory Uncertainty
The cryptocurrency market, and by extension ETHUSD, continues to operate under a cloud of regulatory uncertainty in various jurisdictions. While specific regulatory news impacting ETHUSD directly wasn't highlighted in the provided snippets, the broader implications of regulatory crackdowns or clarifications in major economies like the US, EU, or Asia can significantly influence market sentiment and institutional investment. For instance, any definitive regulatory clarity from the SEC regarding Ethereum's status (e.g., as a security or commodity) could drastically alter its market perception and adoption trajectory. Similarly, positive regulatory developments, such as the approval of spot Ethereum ETFs in the US or clear frameworks for staking, could unlock significant institutional capital. The current lack of clear, decisive regulatory action means that this remains a persistent overhang, capable of triggering sharp market reactions to any new developments. Traders must remain vigilant, as regulatory news can often act as a 'black swan' event, capable of causing significant volatility.
Institutional Interest and ETF Speculation
Institutional adoption remains a key narrative for the long-term growth of Ethereum. The potential approval of spot Ethereum ETFs, similar to the Bitcoin ETFs that saw significant inflows, is a major speculative driver. While such approvals are not guaranteed and face regulatory hurdles, the mere possibility fuels demand and influences market sentiment. News of major financial institutions increasing their crypto exposure, launching custody services, or integrating blockchain technology into their operations can provide fundamental support for ETHUSD. The ongoing development of Ethereum's Layer 2 scaling solutions and its increasing role in Decentralized Finance (DeFi) and Non-Fungible Tokens (NFTs) also contribute to its fundamental value proposition. However, the current price consolidation suggests that these fundamental developments are not yet translating into strong buying pressure, possibly due to the aforementioned regulatory concerns and macro-economic headwinds. Any concrete news regarding institutional product launches or regulatory approvals could be the catalyst needed to break ETHUSD out of its current range.
The potential for spot Ethereum ETF approvals remains a key long-term catalyst. Regulatory clarity or setbacks can cause significant price swings.
Trading Scenarios and Strategic Outlook
The Bullish Scenario: Breaking the Chains
The bullish case for ETHUSD hinges on a decisive break above the current consolidation range. The primary trigger for this scenario would be a sustained move and daily close above the significant resistance at $1,956.29. This level has acted as a ceiling, and overcoming it would signal strong buying pressure and potentially invalidate the bearish short-term signals. Invalidation for this bullish scenario would occur if price fails to hold the $1,868.34 level and breaks decisively below the critical support at $1,827.25. If the bullish scenario plays out, the first target would likely be the psychological level around $2,000, followed by a more extended target towards $2,038.36, based on the daily resistance levels. This scenario is supported by the bullish trends observed on the 4-hour and daily charts, as well as the potential for positive macro-economic shifts or favorable regulatory news.
The Bearish Scenario: Downside Acceleration
Conversely, the bearish scenario anticipates a breakdown from the current range. The primary trigger would be a close below the $1,827.25 support level on the daily chart. This would likely be exacerbated by increasing selling pressure, negative news flow, or a further strengthening of the US dollar. Invalidation for this bearish outlook would occur if ETHUSD manages to reclaim the $1,903.83 level and subsequently breaks above the $1,956.29 resistance. If the bearish scenario materializes, the first downside target would be the support at $1,792.15, followed by a more extended target towards $1,700-$1,750, although no specific levels for this are provided in the data. This scenario is supported by the bearish momentum on shorter timeframes, the strong DXY, and the overall cautious risk appetite in the broader market.
The Neutral Scenario: Continued Choppiness
Given the conflicting signals and the current flat price action, a neutral scenario where ETHUSD continues to trade within its established range is also highly plausible. This would involve price action oscillating between the immediate support around $1,868.34 and resistance near $1,903.83, with occasional tests of the more significant levels at $1,827.25 and $1,956.29. In this scenario, neither bulls nor bears gain a significant advantage, leading to choppy, range-bound trading. The trigger for this scenario would be the inability of price to decisively break either the key support or resistance levels within the next few trading sessions. Invalidation would occur on a clear break above $1,956.29 or below $1,827.25. Targets in this scenario would be the boundaries of the range itself, with traders looking for shorter-term opportunities within the defined parameters. This outcome would likely persist until a significant catalyst emerges, either from macro-economic data, regulatory news, or a shift in Bitcoin's price action.
Bearish Descent: Testing Lower Supports
60% ProbabilityBullish Surge: Breaking Resistance
30% ProbabilityConsolidation Continues: Range-Bound Play
10% ProbabilityFrequently Asked Questions: ETHUSD Analysis
What happens if ETHUSD breaks below the $1,827.25 support level?
A break below the critical $1,827.25 support on the daily chart would invalidate the current consolidation and likely trigger accelerated selling. The next significant downside target would be around $1,792.15, indicating a potential continuation of a bearish trend.
Should I buy ETHUSD at current levels of $1,877.38, given the mixed signals?
Buying at current levels carries significant risk due to conflicting signals and capped upside potential. A more prudent approach would be to wait for a confirmed break above $1,956.29 resistance for a bullish setup, or for a clear breakdown below $1,827.25 support to consider bearish positions.
Is the RSI at 39.48 a sell signal for ETHUSD on the 1-hour chart?
An RSI of 39.48 on the 1-hour chart indicates falling momentum, leaning towards bearish sentiment on that specific timeframe. However, it is not yet in oversold territory and should be considered alongside higher timeframe indicators and price action for confirmation.
How will the upcoming NFP report affect ETHUSD this week?
A stronger-than-expected NFP report could boost the DXY and pressure ETHUSD downwards, while a weaker report might weaken the dollar and provide a tailwind for ETHUSD. The market's reaction will depend on how the data influences Fed rate hike expectations.
Looking Ahead: The Catalyst for the Next Move
Ethereum (ETHUSD) finds itself at a critical juncture, trading flat around $1,877.38, caught between the conflicting signals of its shorter and longer-term technical indicators. The battle lines are clearly drawn: bulls are eyeing a decisive break above $1,956.29 resistance, while bears are poised to exploit any weakness below the $1,827.25 support. The prevailing macro-economic environment, particularly the strengthening US dollar and the uncertainty surrounding economic growth and Fed policy, adds another layer of complexity. Upcoming events, such as the NFP report, will be crucial in shaping market expectations and potentially providing the catalyst needed to break this consolidation. For now, patience and discipline are paramount. Traders should focus on observing price action at these key levels and waiting for clear confirmation before committing to a direction. The market always offers second chances; managing risk and waiting for the right setup is key.
Track markets in real-time
AI-powered analysis, technical indicators and real-time price data.
Join Our Telegram Channel
Breaking market news, AI analysis and trading signals instantly.
Join Channel