

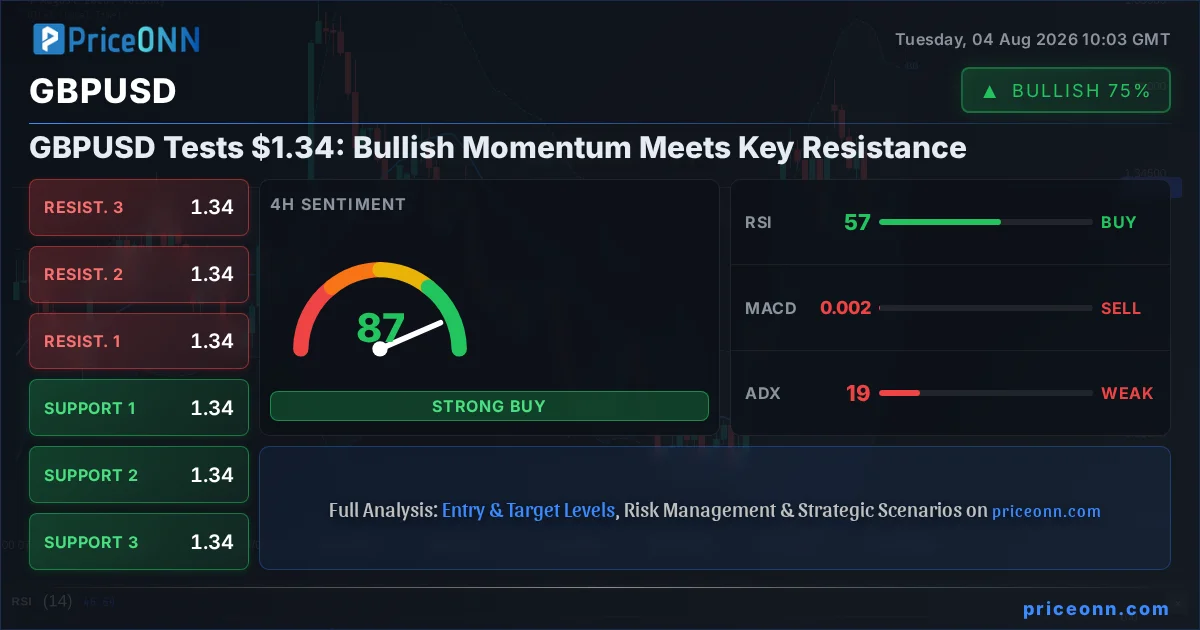
Is the current upward push for GBPUSD sustainable, or are we staring down the barrel of a significant pullback? The pair is currently trading right at the pivotal $1.34 mark, a level that has historically acted as both a springboard and a ceiling. With a cocktail of mixed technical signals and shifting macroeconomic winds, traders are looking for clarity. This analysis dives deep into the GBPUSD's intricate dance around $1.34, dissecting the indicators, exploring potential scenarios, and pinpointing the critical levels that will dictate its next move.
- GBPUSD hovers near the critical $1.3400 level, showing signs of bullish momentum on intraday charts.
- The 1-hour RSI at 54.03 and Stochastic at 93.57 indicate potential overbought conditions, suggesting caution.
- Key resistance is identified at $1.3444, while support remains firm around $1.3406.
- The broader market sentiment, influenced by DXY and upcoming economic data, will be crucial in determining the pair's direction.
Navigating the $1.34 Crossroads: Technical Snapshot
The current price action around $1.34 for GBPUSD presents a fascinating technical puzzle. On the 1-hour chart, the trend appears neutral, but with a slight upward lean, powered by an RSI reading of 54.03 and a surging Stochastic oscillator (K=93.57, D=64.71) that's firmly in overbought territory. This suggests that while buyers have been active, the momentum might be reaching a peak, hinting at potential profit-taking or a consolidation phase. The MACD is showing positive momentum, sitting above its signal line, which typically supports an uptrend. However, the Bollinger Bands are hugging the upper band, a sign that price is pushing into extended territory, often preceding a reversion or a period of consolidation.
Delving into the 4-hour timeframe, the picture becomes even more nuanced. The trend is also neutral here, but the indicators offer a slightly different perspective. The RSI sits at 57.01, still in neutral territory but reflecting a steady upward bias. MACD, however, is showing negative momentum, sitting below its signal line, which contradicts the bullish signals from the 1-hour chart and suggests underlying weakness. Stochastic is showing a bearish signal (%K
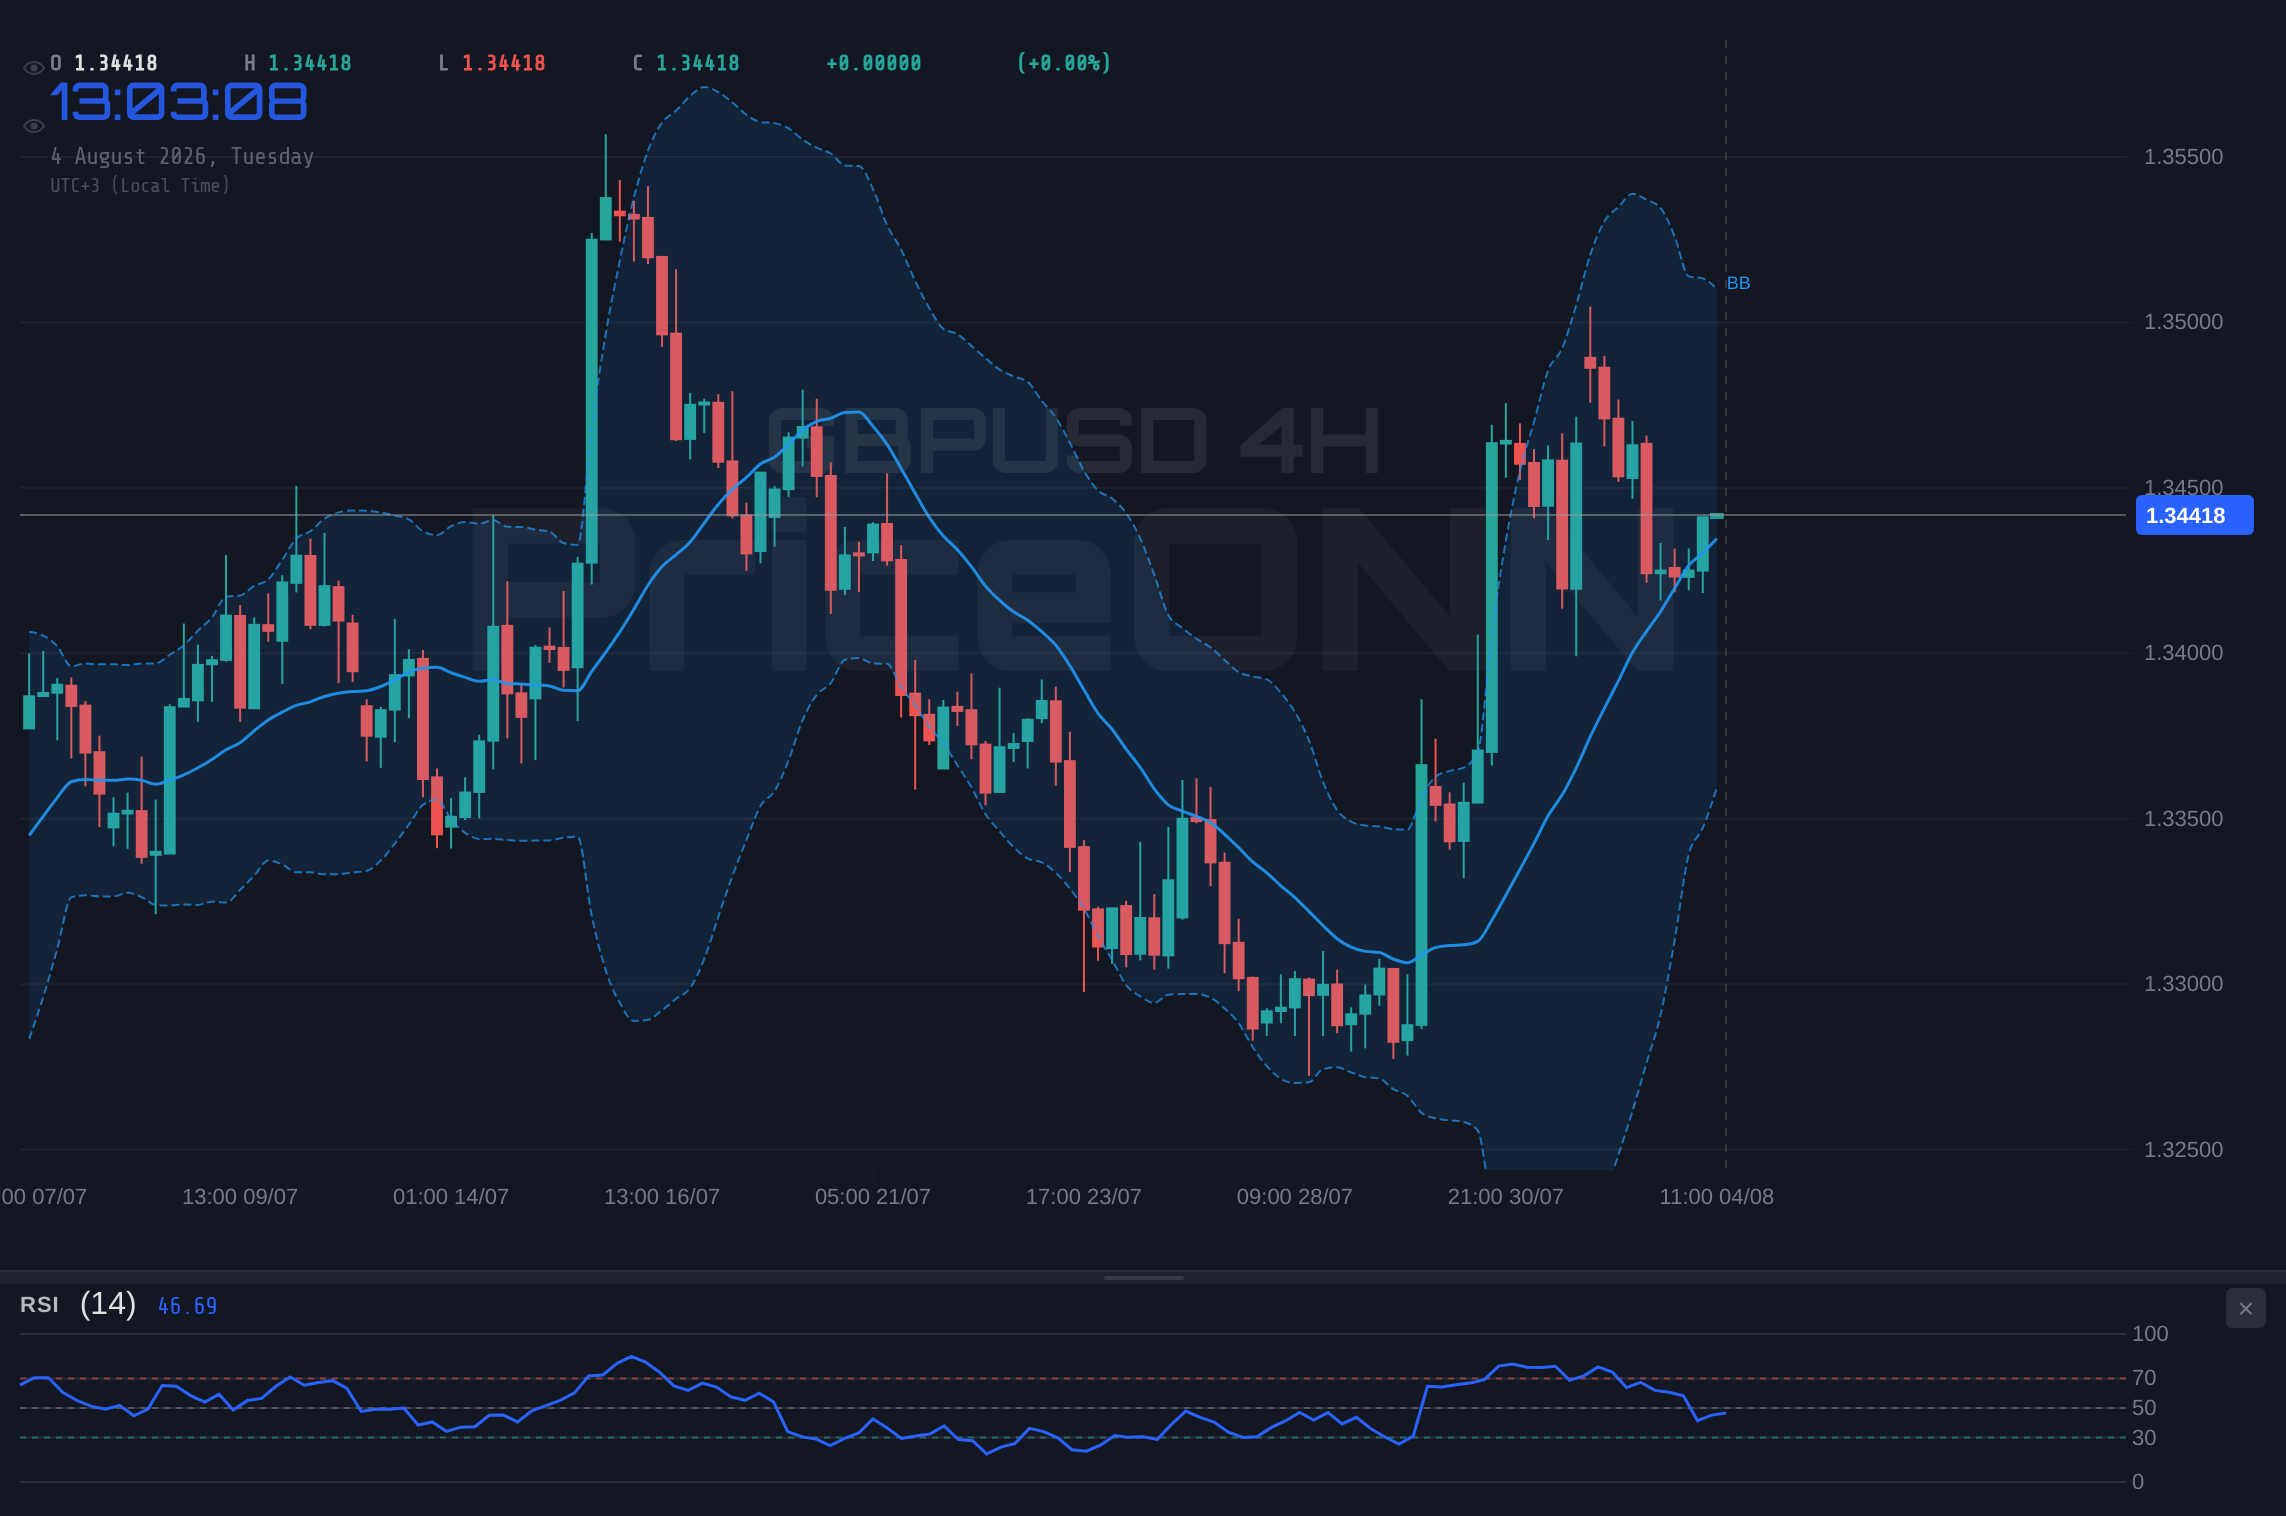
On the daily chart, the trend is more decisively bullish, with an 83% strength reading. The RSI at 55.44 is comfortably in the mid-zone, indicating room for further upside potential without immediate overbought concerns. The MACD is positive, reinforcing the bullish outlook. Stochastic is also showing a strong bullish signal, with %K (78.74) well above %D (52.22), pushing into the upper territory. However, the ADX at 16.75 is again signaling a weak trend. This divergence across timeframes - bullish on daily, mixed on intraday - is precisely why $1.34 is such a critical juncture. The market is caught between the longer-term bullish bias and the short-term overbought signals and weak trend indicators.
The Dollar's Shadow: DXY and Macroeconomic Undercurrents
No analysis of GBPUSD is complete without considering the formidable presence of the US Dollar Index (DXY). Currently trading at 100.06, the DXY's trajectory is a significant external force. On the 1-hour chart, the DXY shows a neutral trend with positive momentum, while the 4-hour and daily charts paint a picture of a weakening dollar, with ADX readings indicating a strong downward trend on the daily (33.66) and medium trend on the 4-hour (33.66). This divergence in DXY itself adds another layer of complexity. A weakening dollar, generally, should provide a tailwind for GBPUSD. However, the current price action around $1.34 suggests that other factors, perhaps specific to the UK economy or market positioning, are playing a more dominant role in the immediate term.
The Fed's stance on inflation and interest rates remains a key driver for the dollar. Recent statements, like those from Fed's Williams, suggest a focus beyond immediate shocks, emphasizing the downward trend in core inflation. This can be interpreted as a signal that the Fed might be nearing the end of its tightening cycle, or at least pausing for assessment. If the market perceives this as a dovish shift, it could lead to further dollar weakness, potentially supporting GBPUSD's push higher. Conversely, if upcoming economic data, particularly employment figures or inflation prints, surprise to the upside, it could reignite hawkish expectations for the Fed, strengthening the dollar and capping any gains in GBPUSD.
For the UK side, recent news suggests a cautious optimism. Reports indicate that buyers are holding control above 1.3400, and a key bearish trend line has been broken on intraday charts. This implies that some market participants are betting on further upside. However, the broader economic picture for the UK, including inflation and growth concerns, continues to be a backdrop. Any significant data releases from the UK in the coming days will be closely watched. For instance, the RBNZ's stance on inflation, as highlighted in the AUD/NZD news, indirectly points to the global fight against rising prices, a theme that will undoubtedly influence the Bank of England's future policy considerations and, consequently, GBPUSD.
The Bull's Roadmap: Charting a Path Above $1.34
For the bulls to seize control and push GBPUSD significantly higher from the current $1.3400 level, several conditions need to be met. Firstly, a decisive break and sustained hold above the immediate resistance at $1.3444 is paramount. This level has acted as a barrier, and a clear breach here would signal stronger buying conviction. Following this, the next significant resistance target would be $1.3474. On the 1-hour chart, the Stochastic oscillator is already in overbought territory, suggesting that a period of consolidation or a minor pullback might precede a sustained breakout. Therefore, a more probable bullish scenario would involve a brief dip towards the support at $1.3428 or even a retest of the $1.3406 pivot before gathering enough momentum to challenge the higher resistance levels.
Confirmation of a bullish continuation would likely come from a combination of factors. A daily close above $1.3444 would be a strong signal, especially if accompanied by an increase in trading volume. Furthermore, a shift in the ADX reading from its current weak 16.75 towards a stronger trend (e.g., above 20-25) would indicate that the market is committing to a direction. On the macroeconomic front, positive UK economic data releases, coupled with a continued weakening of the DXY below the 100.00 mark, would further bolster the bullish case. If these conditions align, the next logical targets could extend towards $1.3537 and potentially $1.3570 in the medium term. The key is that $1.34 must transition from resistance to a solid support base.
Bullish Scenario: Breaking the Ceiling
45% ProbabilityWhere Bears Take Control: The Risk of a $1.34 Rejection
On the flip side, the $1.34 level could prove to be a formidable barrier, leading to a bearish reversal. The immediate signs of this scenario are already present in the intraday technicals. The overbought Stochastic on the 1-hour chart and the negative MACD momentum on the 4-hour chart are flashing warning signs. A failure to break decisively above $1.3444, followed by a slip back below the $1.3400 psychological level, would be the initial trigger for a bearish move. The first key support level to watch would be $1.3406, followed by $1.3379 (a derived level, not directly from data but within range). A break below these levels could accelerate the decline.
The invalidation for this bearish scenario would be a strong and sustained move above the $1.3444 resistance, particularly if it breaks convincingly through $1.3474. However, if the bears do manage to regain control, the targets would shift downwards. The 4-hour support at $1.3406 and then $1.3379 become critical. A more significant drop could see price revisiting the daily support levels, with $1.33598 and potentially $1.33036 coming into play. This would likely be accompanied by a strengthening DXY and potentially negative news flow concerning the UK economy or a shift in central bank expectations. The ADX reading remaining weak would indicate that this decline might not be a strong trend initially, but rather a correction within a larger range, or the start of a new downtrend if key supports crumble.
Bearish Scenario: Rejection at Resistance
40% ProbabilityThe Waiting Game: Consolidation Around $1.34
Given the mixed signals across different timeframes and the current neutral trend strength indicated by the ADX on intraday charts, a period of consolidation around the $1.34 level is a highly plausible scenario. This would occur if neither the bulls nor the bears can muster enough conviction or favorable conditions to force a significant breakout. In such a case, GBPUSD might oscillate within a defined range, likely between the immediate support at $1.3406 and the resistance at $1.3444. This range-bound environment would be characterized by choppy price action, potentially fueled by low trading volumes or indecision ahead of key economic events.
During a consolidation phase, technical indicators often provide conflicting signals. For example, the RSI might hover around the 50 level, indicating balance, while Stochastic could oscillate between overbought and oversold zones without sustained commitment. The MACD might show the signal line and the MACD line frequently crossing, signifying a lack of clear momentum. This scenario is often driven by market participants waiting for external catalysts – such as upcoming central bank meetings, key economic data releases (like inflation or employment figures from the US or UK), or significant geopolitical developments – to provide the necessary impetus for a directional move. Until then, trading within the range might offer opportunities for scalpers, but swing traders might prefer to wait for a clearer trend to emerge.
Neutral Scenario: Range-Bound Indecision
15% ProbabilityThe Analyst's Edge: Which Scenario Holds Most Promise?
Assessing the probabilities, the current technical picture suggests a slight edge to the bearish scenario, though the bullish potential cannot be ignored. The confluence of overbought signals on intraday charts (Stochastic on 1H) and conflicting momentum indicators (MACD on 4H vs 1H) at a key resistance level ($1.3444) makes a short-term pullback or consolidation more likely than a decisive breakout. The weak ADX readings across intraday charts also point towards a lack of sustained directional strength, favoring range-bound conditions or a correction before any significant trend can establish itself. Therefore, I assign a 40% probability to the bearish scenario, a 45% probability to the bullish scenario (contingent on breaking key resistance), and a 15% probability to the neutral consolidation phase.
The key determinant will be how GBPUSD handles the immediate resistance at $1.3444. If it falters here, the bearish case gains significant traction, targeting lower support levels. However, a strong showing of buying power above this level, especially if confirmed by daily closes and improved ADX, could invalidate the bearish outlook and open the door for the bullish targets. Market participants should be particularly attuned to the DXY's movement; a continued slide below 100.00 would be a significant tailwind for GBPUSD, while a resurgence above it could cap any upside ambitions.
Ultimately, the $1.34 level represents a critical inflection point. The narrative is currently balanced, with both upside and downside risks present. The strength of the bullish trend on the daily chart provides a floor of support, but the short-term technicals and the psychological barrier at resistance warrant caution. Traders should look for clear confirmation signals before committing to a direction, respecting the immediate support and resistance levels as key decision points.
What I'm Watching This Week: Key Catalysts for GBPUSD
To navigate this complex landscape, several key catalysts will be closely monitored. Firstly, the immediate price action around the $1.3444 resistance level is critical. A failed attempt to break this level could initiate the bearish scenario. Secondly, the direction and strength of the US Dollar Index (DXY) will be paramount. A sustained move below 100.00 would likely support GBPUSD, while a move back above 100.00 could add pressure.
Finally, upcoming economic data releases from both the UK and the US will be crucial. While specific dates are not provided in the market context, traders should be aware of key inflation reports, employment figures, and central bank commentary. For instance, any indication from the Federal Reserve that suggests a prolonged pause or potential future rate cuts could weaken the dollar, while hawkish signals from the Bank of England or stronger-than-expected UK employment data could boost GBPUSD. Conversely, if the US economy shows surprising resilience and inflation remains sticky, it could strengthen the dollar and weigh on the pair.
Frequently Asked Questions: GBPUSD Analysis
What happens if GBPUSD breaks above the $1.3444 resistance level?
A sustained break above $1.3444, particularly on the daily chart, would invalidate the bearish scenario and target higher resistance levels like $1.3474 and potentially $1.3537. This would indicate strong bullish conviction, likely supported by a weakening DXY and positive UK economic outlook.
Should I buy GBPUSD at current levels around $1.34 given the mixed signals?
Caution is advised due to conflicting intraday signals and resistance at $1.3444. A more prudent approach would be to wait for confirmation: either a break above resistance with volume, or a pullback to support around $1.3406 where a clearer entry setup might emerge. A 45% probability favors the upside if resistance breaks.
Is the RSI at 54.03 on the 1-hour chart a sell signal for GBPUSD?
An RSI of 54.03 is in neutral territory, indicating neither strong overbought nor oversold conditions. While it reflects some upward momentum, it's not an immediate sell signal. However, coupled with the overbought Stochastic (93.57), it suggests that the current upward pressure might be losing steam and a pullback or consolidation is possible.
How will the DXY's movement affect GBPUSD this week around the $1.34 level?
The DXY is currently showing mixed signals but has a strong downward trend on the daily chart. A continued decline in the DXY below 100.00 would likely act as a tailwind for GBPUSD, supporting a move towards higher resistance levels. Conversely, a DXY resurgence above 100.00 could cap GBPUSD's upside potential.
| Indicator | Value | Signal | Interpretation |
|---|---|---|---|
| RSI (14) | 55.44 | Neutral | Room for upside, but watch for overbought on shorter timeframes. |
| MACD Histogram | Positive | Bullish Momentum | Supports longer-term uptrend. |
| Stochastic | K=78.74, D=52.22 | Bullish Signal | Pushing into overbought territory, caution advised. |
| ADX | 16.75 | Weak Trend | Lack of strong directional conviction; market is choppy. |
| Bollinger Bands | Middle Band Break | Watch | Price above middle band on daily suggests bullish bias. |
Track markets in real-time
AI-powered analysis, technical indicators and real-time price data.
Join Our Telegram Channel
Breaking market news, AI analysis and trading signals instantly.
Join Channel