

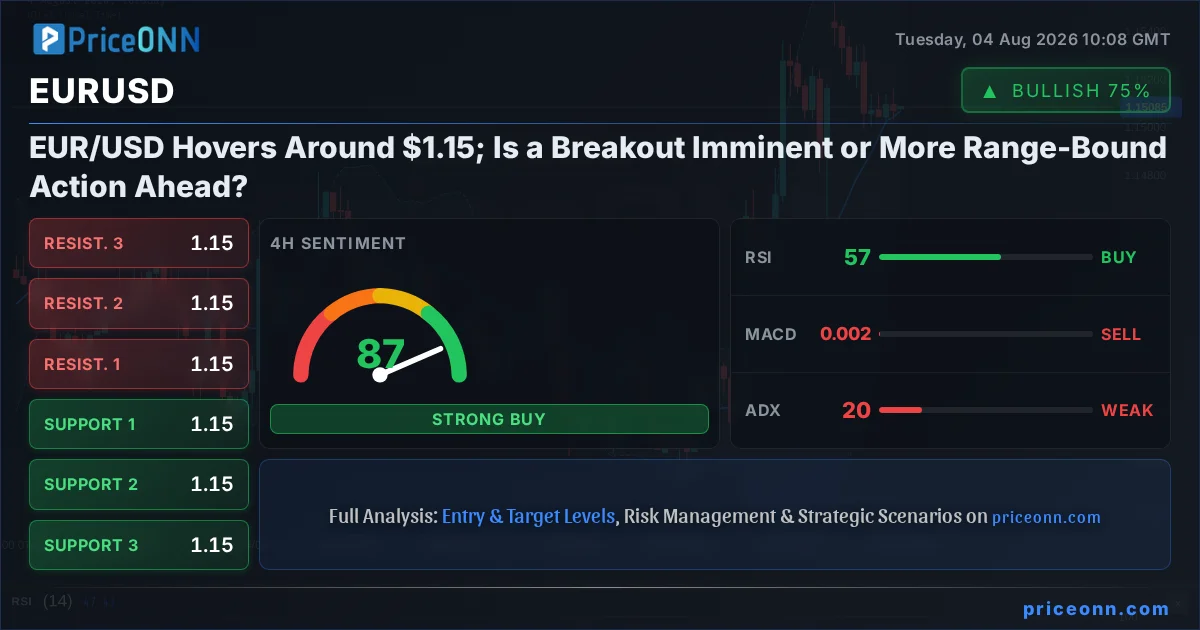
The EUR/USD pair finds itself at a critical juncture, hovering precariously around the $1.15 mark. This level, long eyed by traders and analysts, represents a significant psychological and technical barrier. As the market digests a week of mixed signals and navigates a landscape of shifting economic expectations, the question on everyone's mind is whether this current price action is the prelude to a decisive breakout or merely another chapter in a prolonged period of range-bound trading. With the Dollar Index (DXY) showing signs of life and global risk sentiment in flux, understanding the forces shaping EUR/USD's immediate future is paramount for anyone involved in the currency markets.
- EUR/USD is trading around $1.15, testing resistance and showing a neutral trend across multiple timeframes.
- ADX readings across 1H, 4H, and 1D charts indicate weak to moderate trend strength, suggesting choppiness rather than a clear directional move.
- Stochastic oscillators present conflicting signals, with some showing overbought conditions and others suggesting potential upward movement, highlighting the indecisive market sentiment.
- The DXY is showing a slight upward bias, potentially capping upside for EUR/USD, while global risk appetite remains a key factor to monitor.
The current technical picture for EUR/USD is anything but clear-cut. Across the shorter timeframes, the 1-hour chart paints a picture of caution, with a generally bearish trend signal despite a neutral RSI reading of 46.17. The MACD is showing momentum that is balancing out, suggesting a lack of conviction from either bulls or bears. Bollinger Bands are hugging the upper band, hinting at potential overextension or an imminent reversal. However, the Stochastic Oscillator, with %K at 45.64 and %D at 47.96, leans towards a bearish signal, indicating that the pair might be poised for a downward move. The ADX at 10.84 reinforces this indecision, signaling a weak trend, which often precedes a period of consolidation or a sharp, unexpected move. This 1H setup screams caution; it's a market where scalpers might find opportunities, but longer-term traders should exercise significant restraint.
Shifting to the 4-hour timeframe, the narrative begins to diverge slightly. Here, the trend is officially classified as neutral, with a 50% strength reading, reflecting the market's ambiguity. The RSI at 57.36 is firmly in neutral territory, leaning towards bullish, suggesting some underlying buying interest. The MACD, however, is showing negative momentum, sitting below its signal line, which contradicts the RSI's lean. Bollinger Bands are positioned above the middle band, indicating a mild upward bias in this timeframe. The Stochastic Oscillator provides a clearer bullish signal here, with %K at 38.29 and %D at 54.7, indicating room for upward movement before hitting overbought territory. Yet, the ADX remains subdued at 19.55, still pointing to a lack of a strong directional trend. This 4H view suggests a potential for slightly higher prices, but the conflicting indicators, particularly the MACD, temper any strong bullish conviction.
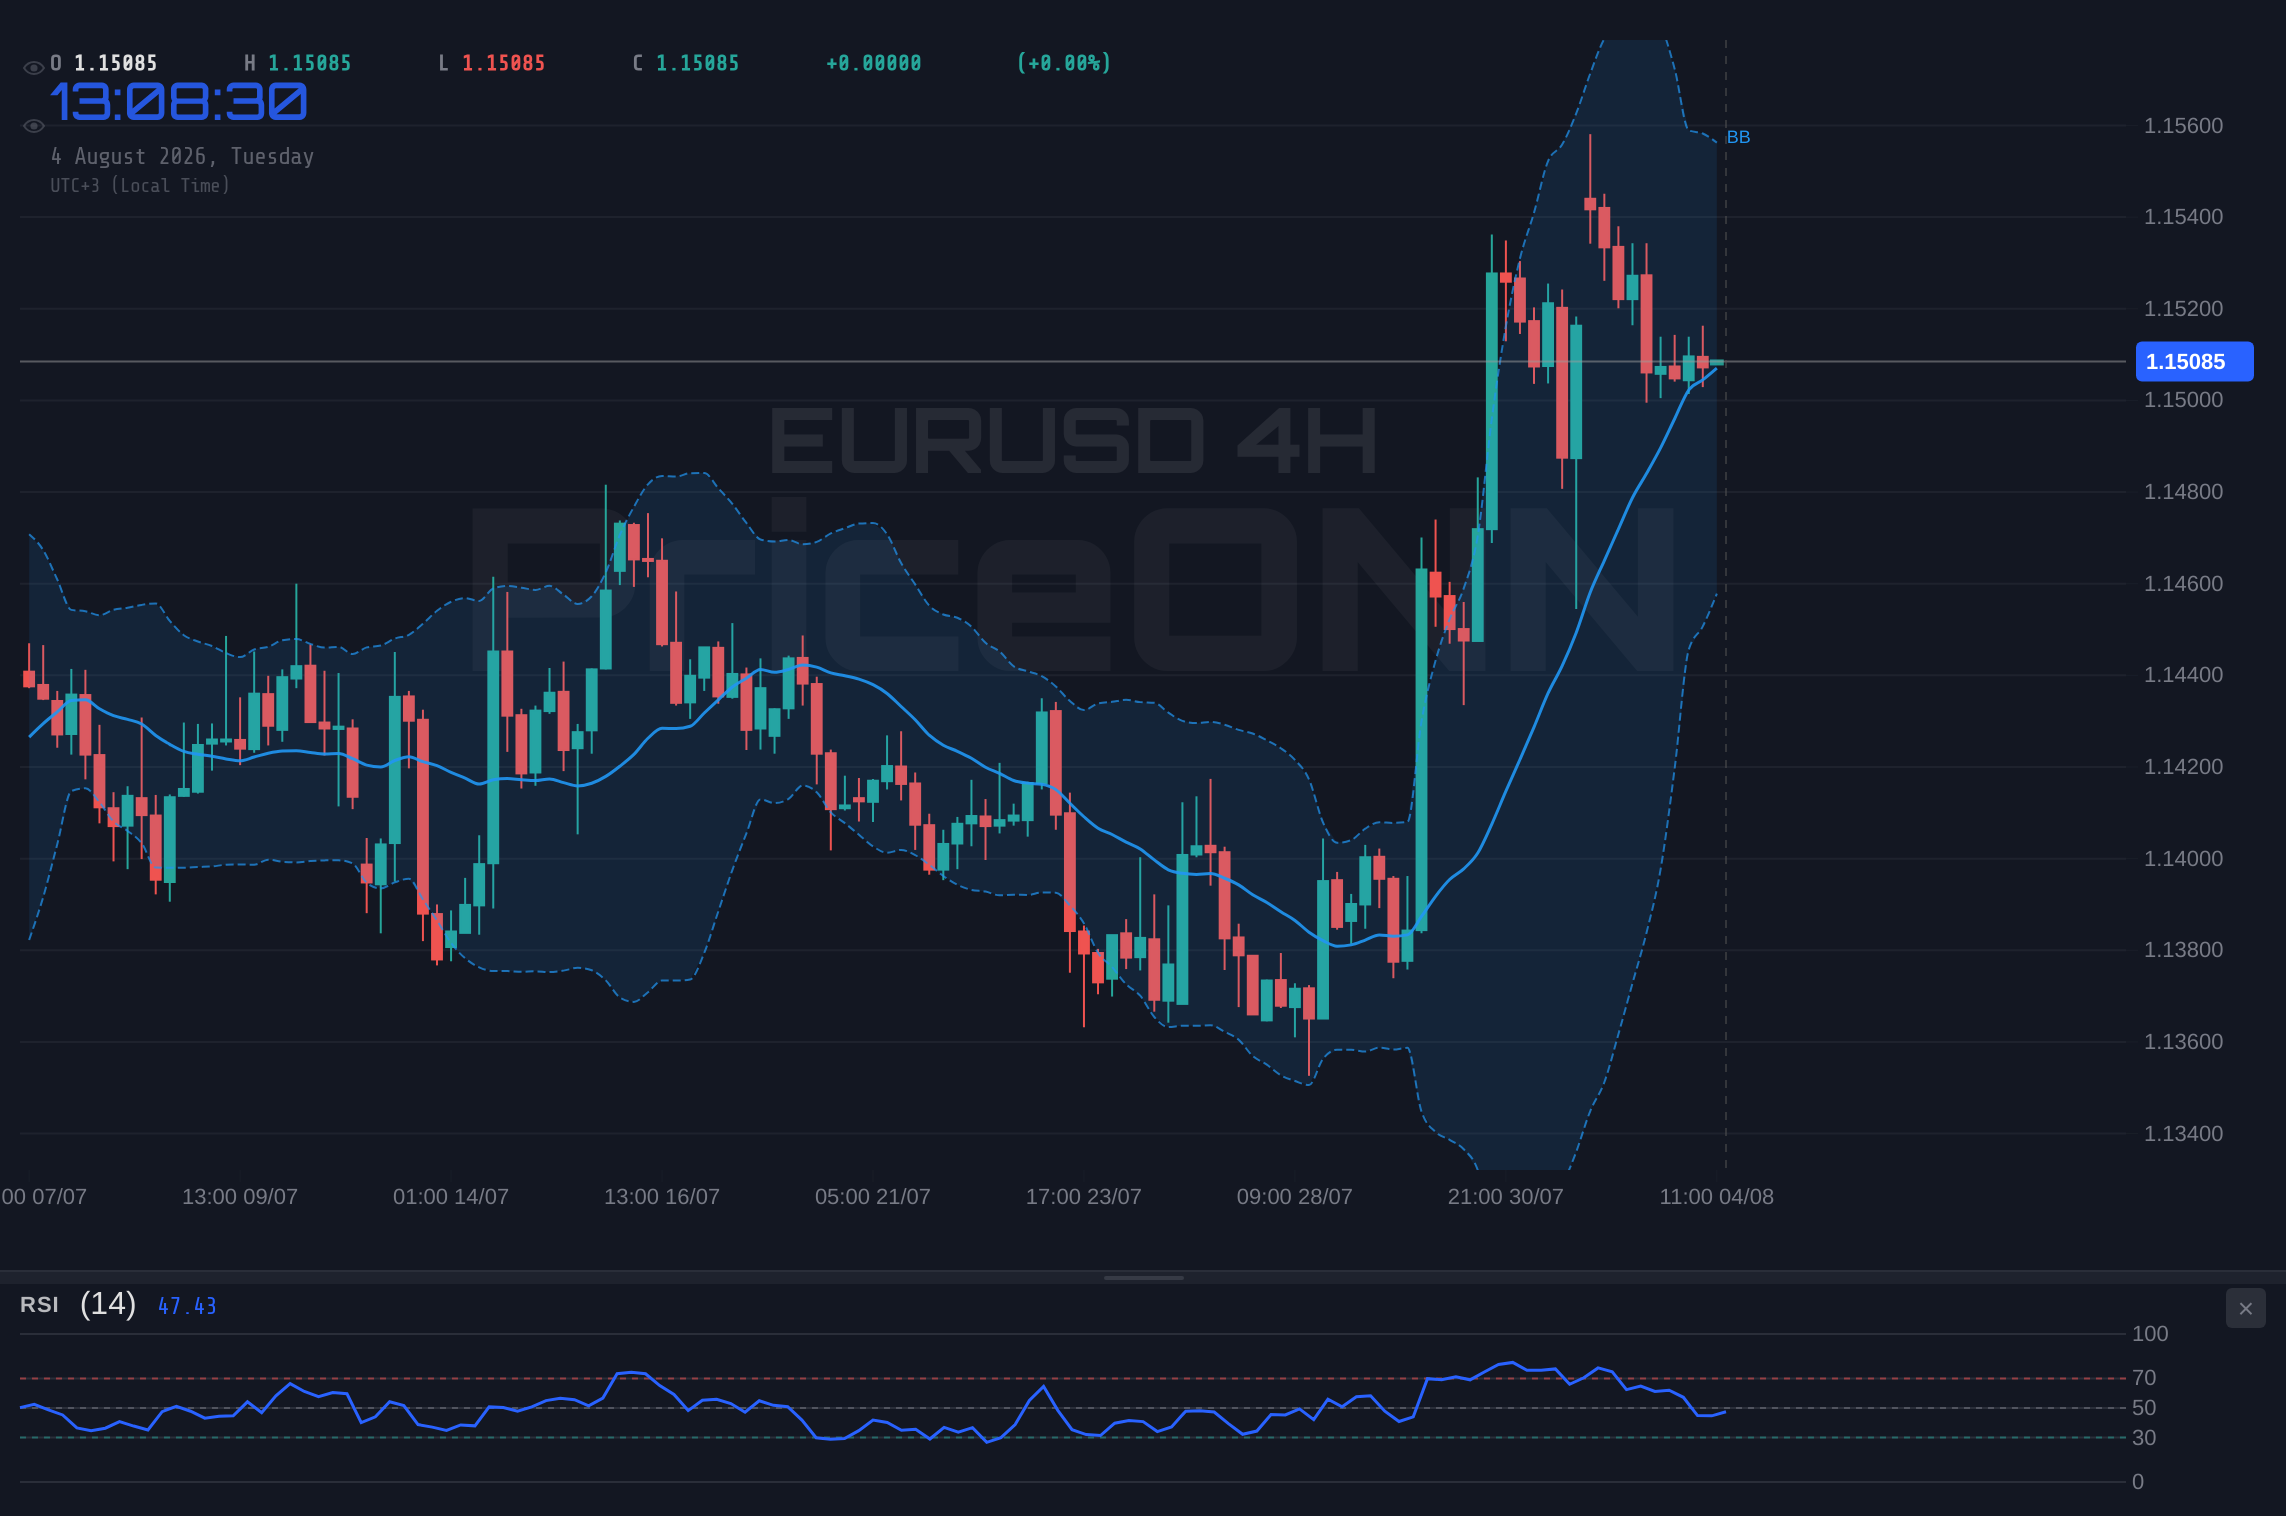
On the daily chart, the EUR/USD pair continues to exhibit a neutral trend, reflecting the broader indecision that has gripped currency markets. The RSI stands at 58.17, comfortably within the neutral zone and showing a slight upward inclination, which has historically preceded periods of strength for the pair. The MACD indicator offers a bullish signal, with positive momentum and the MACD line above its signal line, suggesting that underlying buying pressure might be building. Bollinger Bands are trading above the middle band, reinforcing this potentially bullish outlook. Furthermore, the Stochastic Oscillator is showing a strong bullish signal, with %K at 82.12 and %D at 64.92, indicating that the pair is entering overbought territory but still has room to climb. The ADX, however, moderates this optimism slightly, reading 24.67, which suggests a moderate, rather than strong, upward trend. This daily perspective offers the most constructive view for the bulls, but it hinges on the pair holding its ground above key support levels.
The divergence in signals across different timeframes is precisely what creates this current market tension. While the daily chart hints at potential upside, the shorter-term charts, particularly the 1-hour, suggest immediate headwinds. This conflicting technical landscape means that EUR/USD is currently trapped in a battleground where neither buyers nor sellers have a clear upper hand. The prevailing sentiment appears to be one of cautious optimism on the daily, overshadowed by immediate selling pressure on the hourly. This is the classic setup for a market that is waiting for a catalyst – be it economic data, central bank commentary, or a geopolitical event – to force a directional decision.
The Bullish Case: Navigating Above $1.15
For the bulls to take firm control, EUR/USD needs to decisively break through the resistance cluster around the $1.15166 to $1.15198 range. This isn't just a psychological barrier; it represents a confluence of technical resistance levels identified across multiple timeframes. A sustained close above $1.1520 on the hourly chart would be the initial signal, suggesting that short-term selling pressure is being overcome. Confirmation would come from a follow-through on the 4-hour and daily charts, ideally with increasing volume and positive momentum indicators. If this bullish scenario materializes, the next significant resistance target would be the $1.15438 level on the daily chart. Beyond that, the psychological level of $1.16000 becomes the next major hurdle, a price point that has not been sustained for a considerable period, making it a significant psychological and technical magnet.
The underlying drivers for such a bullish move would likely stem from a weakening US Dollar, perhaps triggered by softer-than-expected US economic data or a more dovish tone from Federal Reserve officials. While recent Fed commentary, such as John Williams' focus beyond oil shocks and on core inflation trends, suggests a continued commitment to bringing inflation down, any hint of a pause or a pivot could significantly impact the DXY and, by extension, EUR/USD. For instance, if upcoming US employment figures were to significantly miss expectations, it could fuel speculation about earlier Fed rate cuts, weakening the dollar and providing the necessary impetus for EUR/USD to push higher. On the flip side, strong Eurozone economic data, perhaps showing resilience in manufacturing or a pickup in consumer confidence, could also bolster the single currency, adding to the upward pressure.
From a technical perspective, a bullish breakout would ideally see the RSI on the 4-hour and daily charts move decisively above 60, indicating strong buying momentum. The Stochastic Oscillator, which is already showing bullish signals on the 4-hour and daily charts (though entering overbought territory on the 1-hour), would need to sustain its upward trajectory. The ADX, currently showing weak to moderate trend strength, would need to climb above 25, confirming that a genuine trend is establishing itself. Any move above $1.15438 would invalidate the immediate bearish pressures seen on the shorter timeframes and open the door for a rally towards the $1.15802 and potentially the $1.16024 resistance levels.
The Bearish Case: Sellers Take Control Below $1.15
Conversely, the bearish scenario hinges on the failure of EUR/USD to hold the current price territory and a decisive break below the support levels identified. The immediate support lies at $1.15008 on the 1-hour chart and $1.15027 on the 4-hour chart. A breach of this zone, particularly a close below $1.1500, would likely trigger stop-loss orders and attract further selling. The 1-hour chart's bearish signals, including the RSI's downward trajectory and the Stochastic's bearish cross, would gain more traction. If the bears manage to push the price below $1.14961 (1H support), the next significant target would be the $1.14902 level on the 4-hour chart. This would indicate a potential shift in momentum back towards the daily bearish trend signals, which see support at $1.14630 and further down at $1.14266.
The fundamental catalysts for such a bearish move would likely involve a strengthening US Dollar, driven by either hawkish rhetoric from the Federal Reserve or robust US economic data. For instance, if the upcoming US Non-Farm Payrolls (NFP) report, due in the coming days, were to significantly exceed market expectations, it would almost certainly bolster the dollar. This would put immense pressure on EUR/USD, potentially triggering the sell-off. Similarly, any signs of escalating geopolitical tensions that typically drive safe-haven demand towards the dollar could also weigh heavily on the pair. The recent news about inflation, with analysts like those at Citi suggesting gold's consolidation will end with a rise, highlights the broader inflationary concerns that central banks are battling. If these concerns lead to a perception that the Fed must remain tighter for longer compared to the ECB, the dollar would strengthen, pushing EUR/USD lower.
Technically, a bearish breakdown would be confirmed by the RSI on the daily chart falling back below 50, and the MACD histogram turning negative again. The Stochastic Oscillator would need to maintain its bearish bias, ideally with a significant cross below 50 on the daily chart. The ADX, currently at 24.67, would need to start trending higher, indicating that a strong bearish trend is developing. A break and hold below the $1.14902 level would invalidate the daily bullish signals and open up the path towards the lower support levels, with $1.14630 and $1.14266 being the primary targets. This scenario would suggest that the pair is heading towards a more significant correction, potentially retesting lower price territories seen earlier in the year.
The Waiting Game: Consolidation Around $1.15
Given the conflicting signals across timeframes and the current weak trend strength indicated by the ADX across all charts (10.84 on 1H, 19.55 on 4H, and 24.67 on 1D), a period of consolidation around the $1.15000 to $1.15200 level seems highly probable in the short to medium term. This scenario plays out when neither the bulls nor the bears can gain decisive traction, leading to a period of sideways trading as the market waits for a clearer directional cue. The RSI levels hovering in the neutral zone (46.17, 57.36, 58.17) support this view, indicating a lack of extreme overbought or oversold conditions that typically precede strong moves.
In this neutral scenario, price action would likely be characterized by fluctuations within defined support and resistance bands. The immediate support at $1.15008 (1H) and $1.15027 (4H) would act as a floor, while the resistance near $1.15166 (1H) and $1.15152 (4H) would cap upside potential. This range, though narrow, could offer opportunities for range traders who aim to buy near support and sell near resistance. However, the risk of a breakout or breakdown remains ever-present. The low ADX values suggest that volatility might be suppressed for now, but this often precedes a period of increased volatility once the consolidation breaks. Traders would need to watch for increased volume on moves towards either the support or resistance extremes as potential signs of an impending breakout.
The fundamental backdrop also supports a consolidation phase. The lack of clear directional guidance from upcoming economic data releases or definitive statements from central banks means that market participants are likely to remain on the sidelines, waiting for more concrete information. While news reports mention a busy week ahead for EUR/USD, the specific catalysts that would break the current stalemate are not yet clearly defined. Until then, the pair may continue to trade within a tight range, punctuated by minor fluctuations driven by intraday news flow or short-term technical positioning. This 'waiting game' can be frustrating for traders seeking clear trends, but it demands patience and a focus on risk management, waiting for the market to provide a more definitive signal.
Probability Assessment: Which Scenario Dominates?
Assessing the probabilities of these scenarios requires a careful look at the confluence of technical indicators and the prevailing market sentiment. The daily chart offers the most constructive outlook for the bulls, with RSI and MACD leaning positive and Stochastic signaling a potential rally. However, this is significantly undermined by the weaker signals on the 1-hour and 4-hour charts, particularly the bearish Stochastic on the 1H and the negative MACD momentum on the 4H. The consistently weak ADX readings across all timeframes (below 25) are the strongest technical indicators suggesting that a sustained trend is unlikely in the immediate future, favoring consolidation or range-bound trading.
The current price action around $1.15, coupled with the conflicting signals, points towards a higher probability for the neutral or consolidation scenario in the short to medium term. The market appears to be in a holding pattern, waiting for a catalyst. The bullish scenario has potential, especially if US data falters or the Fed adopts a more dovish stance, but it requires overcoming significant immediate resistance. The bearish scenario is also plausible, particularly if US economic strength continues to surprise or geopolitical risks escalate, but it needs to break through immediate support levels. Therefore, the most likely outcome in the coming days is continued choppiness within a defined range.
Given this analysis, I assign the following probabilities: The Neutral/Consolidation scenario holds the highest probability at 60%. The Bullish scenario, contingent on breaking key resistance and favorable macro data, has a 25% probability. The Bearish scenario, requiring a decisive break of support and potentially negative external catalysts, is assigned a 15% probability. This assessment is dynamic and could shift rapidly based on incoming data and market events.
What I'm Watching This Week
The key to navigating the EUR/USD market in the coming days lies in monitoring specific price action and economic releases. My focus will be on how the pair behaves around the $1.1500 to $1.1520 zone. A failure to decisively break above the upper end of this range, especially on increasing volume, would reinforce the neutral scenario. Conversely, a strong, sustained close above $1.1520, particularly on the 4-hour chart, could signal the start of the bullish scenario, targeting $1.15438.
On the downside, a clear break and hold below $1.14900 would be a strong bearish signal, increasing the odds of a move towards $1.14630. Beyond price action, I'll be closely watching US economic data, particularly any employment or inflation figures that could influence Federal Reserve policy expectations. Any significant deviation from forecasts could be the catalyst needed to break the current stalemate. Additionally, movements in the Dollar Index (DXY) will be crucial; a sustained push above 100.00 could cap any upside for EUR/USD, while a retreat below this level might offer some breathing room for the pair.
Bearish Scenario: The Dollar Strikes Back
15% ProbabilityNeutral Scenario: The Waiting Game Continues
60% ProbabilityBullish Scenario: Breaking the Resistance Barrier
25% ProbabilityFrequently Asked Questions: EURUSD Analysis
What happens if EUR/USD breaks above the $1.15166 resistance level?
A sustained move above $1.15166, particularly on the 4-hour chart, could trigger the bullish scenario. This would likely target the daily resistance at $1.15438, with a secondary objective around $1.15802, assuming favorable US economic data and a less hawkish Fed stance.
Is the current RSI at 58.17 a bullish signal for EUR/USD on the daily chart?
An RSI of 58.17 on the daily chart is considered neutral but leans towards bullish, indicating upward momentum is present but not yet extreme. It suggests potential for further gains, but confirmation from other indicators like MACD and Stochastic, and a break of immediate resistance, is needed for a strong bullish signal.
How will upcoming US employment data affect EUR/USD around the $1.15 mark?
Stronger-than-expected US employment data could strengthen the dollar, pushing EUR/USD below $1.15 towards targets like $1.14630. Conversely, weaker data might weaken the dollar, supporting a move above $1.15 towards $1.15438, especially if it influences Fed rate cut expectations.
Should traders consider buying EUR/USD if it holds above $1.15000 given the current market uncertainty?
Buying EUR/USD solely based on holding $1.15000 is risky due to the neutral trend and conflicting signals. A more prudent approach would be to wait for confirmation, such as a sustained break above $1.15200 with increasing volume, or a clear bearish breakdown below $1.14900, to define a higher-probability trade setup.
| Indicator | Value | Signal | Interpretation |
|---|---|---|---|
| RSI (14) | 46.17 (1H) / 57.36 (4H) / 58.17 (1D) | Mixed | Neutral, leaning bullish on higher timeframes but showing weakness on 1H. |
| MACD | Balancing (1H) / Negative Momentum (4H) / Positive Momentum (1D) | Mixed | Conflicting signals suggest indecision and lack of clear trend direction. |
| Stochastic | %K:45.64,%D:47.96 (1H) / %K:38.29,%D:54.7 (4H) / %K:82.12,%D:64.92 (1D) | Mixed | Bearish on 1H, bullish on 4H, overbought on 1D, indicating potential volatility. |
| ADX | 10.84 (1H) / 19.55 (4H) / 24.67 (1D) | Weak Trend | Overall trend strength is low, suggesting range-bound conditions or a lack of conviction. |
The EUR/USD pair is currently navigating a complex technical landscape, characterized by mixed signals across various timeframes and a prevailing weak trend. While the daily chart offers a glimmer of bullish potential, the immediate hourly and 4-hour charts present significant headwinds and conflicting indicators, suggesting that consolidation around the $1.1500-$1.1520 range is the most probable near-term outcome. Traders should remain vigilant, focusing on key support and resistance levels, and be prepared to react to upcoming economic data releases that could provide the much-needed catalyst for a decisive move. The market is in a state of equilibrium, and it is only a matter of time before this balance is disrupted.
Track markets in real-time
AI-powered analysis, technical indicators and real-time price data.
Join Our Telegram Channel
Breaking market news, AI analysis and trading signals instantly.
Join Channel