

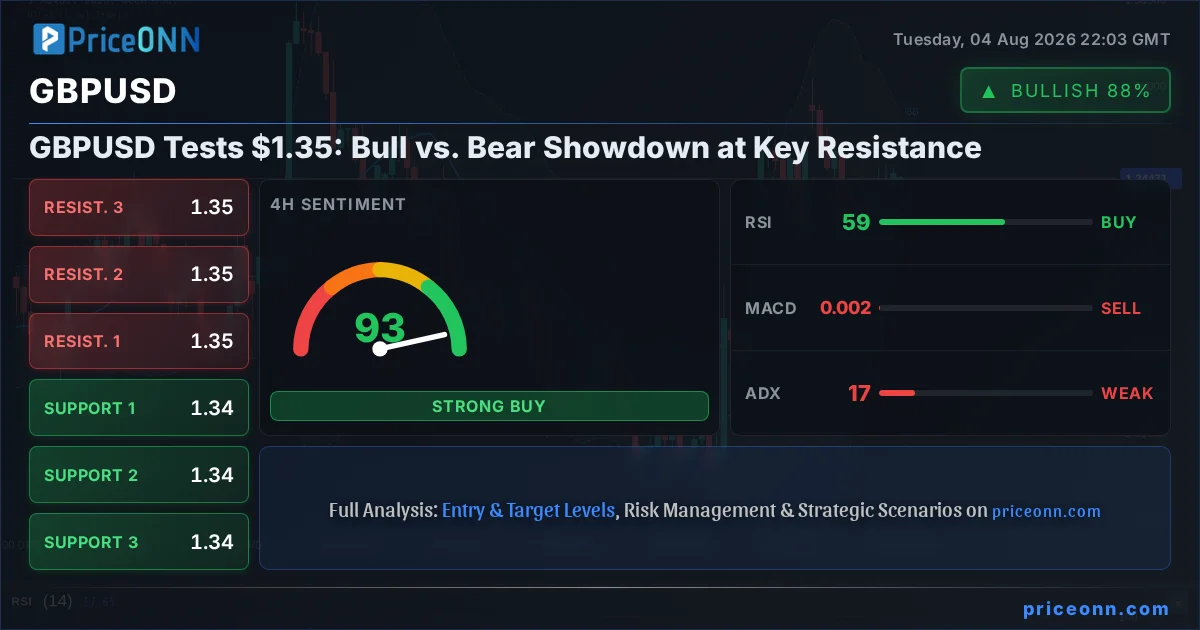
The currency pair GBPUSD finds itself at a critical juncture, currently trading at the $1.35 mark. This level represents a significant battleground where bulls and bears are locked in a fierce tug-of-war. While recent price action has shown a bullish inclination, the underlying technical indicators and broader market correlations present a complex picture, demanding a deeper dive into the fundamental drivers and potential scenarios.
- GBPUSD is currently trading at $1.35, a key resistance level.
- RSI at 67.36 on the 1H chart signals overbought pressure, while the 1D RSI at 48.54 indicates a neutral stance with a slight bearish lean.
- The ADX on the 1H and 4H charts is low (14.52 and 17.35 respectively), suggesting a lack of strong trend conviction despite the bullish price action.
- DXY is at 99.89, showing a slight bearish trend on the 1H and 4H, which typically offers some support to GBPUSD.
The Bull Case: Sustaining the Climb Above $1.35
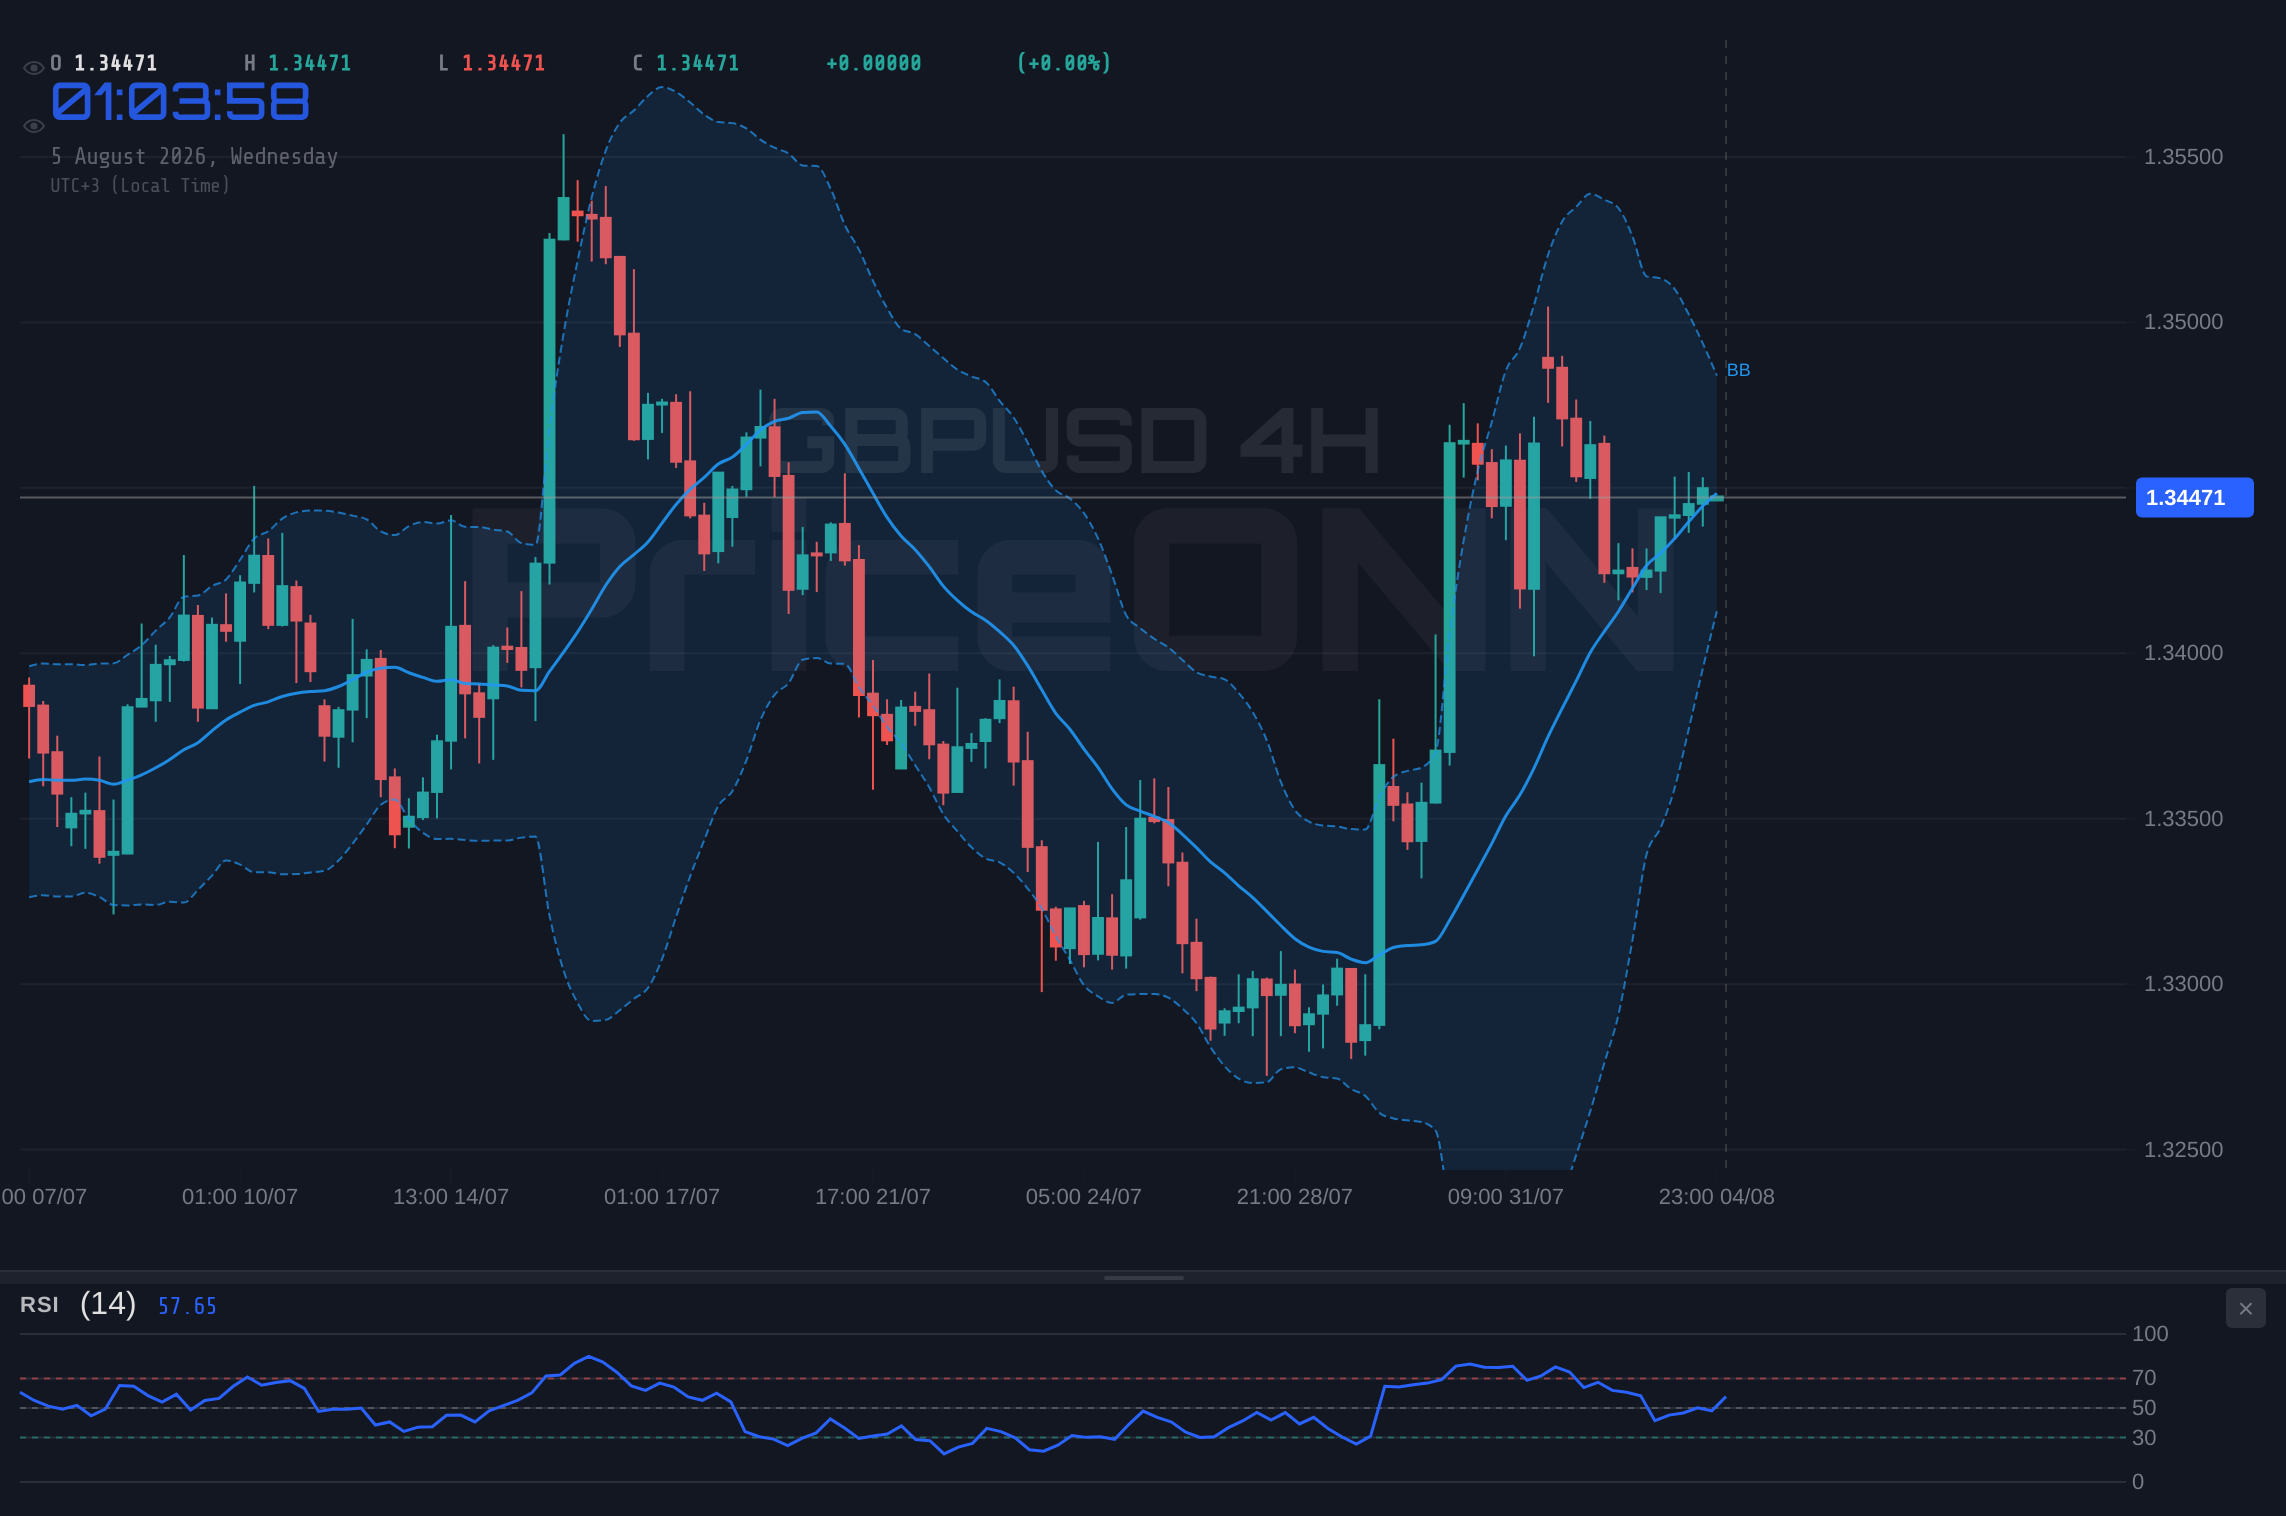
The bulls have certainly made their presence felt in the recent trading sessions for GBPUSD, pushing the price towards the significant $1.35 resistance. On the 1-hour chart, the trend is showing considerable strength (95%), supported by a positive MACD momentum and price action above the middle Bollinger Band. The Stochastic Oscillator, with K at 61.96 and D at 65.12 on the 1H, shows a slight bearish divergence, but the overall 4H Stochastic (K=48.42, D=31.23) and Daily Stochastic (K=80.19, D=52.46) are firmly in bullish territory, suggesting that the upward momentum could have further legs. This upward push is not occurring in a vacuum; it's happening amidst a slightly weakening US Dollar Index (DXY), which is trading at 99.89 and showing bearish signals on shorter timeframes. Historically, a softer dollar tends to provide a tailwind for pairs like GBPUSD, as it makes the British Pound relatively more attractive. Furthermore, the positive sentiment observed in major equity indices like the S&P 500 (6572.87, up 0.74%) and Nasdaq (29687.26, up 3.04%) suggests a general increase in risk appetite, which can also benefit risk-sensitive currencies like the pound.
Digging deeper into the technicals, the 1-day RSI for GBPUSD stands at 56.21, firmly in the neutral zone but leaning towards bullish, indicating room for further upside before reaching overbought conditions. The ADX, however, paints a slightly different picture across timeframes. While the 1H and 4H ADX values of 14.52 and 17.35 respectively suggest a weak trend and potential for choppiness, the 1-day ADX at 16.75 also points to a lack of strong directional conviction. This implies that the current bullish move might be more of a grind than a powerful surge, making the $1.35 level a crucial test. For the bulls to maintain control, they need to not only break and hold above $1.35 but also see confirmation from increasing volume and a strengthening trend on the ADX. The recent news flow, such as the GBP/USD pushing higher above a bearish trend line with resistance around 1.3400, as noted by some analysts, provides further fuel for the bullish argument. This suggests that the market has already digested some of the previous bearish sentiment and is looking for reasons to extend the gains.
The fundamental backdrop also offers some support for the bullish case. While specific UK economic data releases like GDP or CPI are not provided in the real-time data feed, the general trend of improving risk sentiment globally, coupled with a slightly softer dollar, creates a conducive environment for GBPUSD to appreciate. Traders will be closely watching upcoming economic events, particularly any speeches from Bank of England officials that might hint at future monetary policy. If the BoE maintains a relatively hawkish stance compared to market expectations, or if upcoming UK data surprises to the upside, it could provide the necessary fundamental catalyst to push GBPUSD decisively above the $1.35 resistance. The strength seen in other risk assets, like Bitcoin (64178) and Ethereum (1871.08), also contributes to a broader market sentiment that is generally risk-on, which bodes well for currency pairs that tend to benefit from such conditions. The question remains whether the technical setup, particularly the weak ADX, can align with positive fundamental developments to sustain a breakout.
The Bear Case: Resistance at $1.35 Holds Firm
Conversely, the bears have a compelling argument rooted in the psychological significance of the $1.35 level and the conflicting signals within the technical indicators. The 1-hour chart shows the Stochastic Oscillator's K line (61.96) crossing below the D line (65.12), a bearish signal, even though the overall trend strength is high. More critically, the daily chart presents a more cautious outlook. The daily RSI at 56.21, while not yet overbought, is approaching levels that have historically seen pullbacks. The daily MACD is positive, but its histogram needs to be monitored for any signs of weakening momentum. The daily ADX reading of 16.75, although indicating a trend, is not overwhelmingly strong, leaving room for reversals. Furthermore, the GBPUSD is currently testing resistance levels that are very close to the current price: R1 is at 1.34545 and R2 at 1.34638, with the price currently at $1.35. This suggests that breaking above $1.35 might be a significant hurdle. The daily chart also shows support levels significantly below the current price, such as S1 at 1.33924, S2 at 1.33598, and S3 at 1.33036. A failure to decisively break above $1.35 could see a swift reversal, targeting these lower support levels.
The broader market correlation also presents headwinds for the bulls. While the DXY is showing some weakness on shorter timeframes, its overall trend on the daily chart is still considered neutral to bearish, but it has found some footing. If the dollar index were to find renewed strength, perhaps due to unexpected hawkish commentary from the Federal Reserve or a sudden shift to risk aversion, it would likely put significant downward pressure on GBPUSD. The S&P 500 and Nasdaq, despite their recent gains, are still trading near all-time highs, and any sign of a market correction could trigger a flight to safety, benefiting the dollar over the pound. The fact that the 1-day chart shows a trend strength of 83% pointing downwards, despite the current price action, cannot be ignored. This suggests that the longer-term technical picture may still be favoring a bearish outlook, and the current rally could be a retracement within a larger downtrend, a common occurrence before a significant move lower. The news about possible currency intervention rumors causing USD/JPY to fall could also signal a broader risk-off sentiment emerging, which would be detrimental for GBPUSD.
From a fundamental perspective, any signs of cooling inflation in the UK, or a less hawkish stance from the Bank of England compared to other major central banks, could weigh on the pound. While specific upcoming economic events for the UK are not detailed, market participants will be keenly awaiting any new data releases. If inflation proves stickier than expected, it might force the BoE into a more aggressive tightening cycle, which could be a double-edged sword: supportive for the pound in the short term, but potentially detrimental to growth and thus the pound in the longer term. The current price action around $1.35 feels like a critical test, and a rejection here could lead to a sharp unwinding of long positions, targeting the lower support zones mentioned earlier. The weak trend indicated by the ADX across multiple timeframes also supports the idea that this move may not have strong conviction behind it, making it vulnerable to a sharp reversal.
The Technical Crossroads: Interpreting Conflicting Signals
The technical landscape for GBPUSD at $1.35 is a fascinating study in conflicting signals. On the hourly chart, the trend is decidedly bullish, with RSI at 67.36 showing upward momentum, MACD indicating positive momentum, and price comfortably above the Bollinger middle band. Stochastic K=61.96, D=65.12 on 1H shows a slight bearish cross, but the 4H Stochastic with K=48.42 and D=31.23 is strongly bullish. However, as we zoom out to the daily timeframe, the picture becomes more nuanced. The daily RSI at 56.21 is neutral, the MACD remains positive but needs monitoring, and the daily ADX at 16.75 is quite low, signaling a weak trend – a sign that the current move might lack conviction. This divergence between short-term bullishness and longer-term ambiguity is precisely why $1.35 is such a critical level. A breakout above $1.35 needs to be confirmed by increasing volume and a strengthening ADX on the daily chart to be considered sustainable. Without this confirmation, the pair remains susceptible to a reversal, especially if the DXY finds its footing or if broader market sentiment shifts towards risk aversion.
The interplay between different timeframes is crucial here. The 1-hour and 4-hour charts are painting a picture of bullish momentum, with general signals leaning towards 'BUY'. However, the daily chart's 'SELL' signals (3 Sat, 5 Al, 0 Nötr) suggest that the longer-term trend might still be under pressure, despite the current intraday strength. This is where the ADX becomes particularly important. Its low readings on the 1H and 4H charts (14.52 and 17.35) indicate that the market is not yet committed to a strong directional move, making the current price action potentially a 'bull trap' if resistance holds. The daily ADX at 26.32 on XAUUSD signals a strong downtrend, which is a contrasting indicator to the current GBPUSD action, highlighting the complexity of market dynamics. For GBPUSD, the ADX's moderate strength on the daily (24.67 for EURUSD, 26.32 for XAUUSD) suggests that while trends exist, they might not be overwhelmingly dominant. Therefore, a break above $1.35 needs to be accompanied by a surge in the ADX to signal genuine trend confirmation.
The influence of other markets cannot be overstated. The DXY's current price of 99.89, with a neutral to bearish short-term outlook, provides some relief for GBPUSD. However, the strong downward trend indicated by the 4H ADX (33.67) for DXY on its daily chart warrants caution. A significant shift in the dollar's trajectory could quickly alter the GBPUSD's fate. Similarly, the performance of equity markets, such as the S&P 500 at 6572.87 and Nasdaq at 29687.26, reflects global risk appetite. A sustained rally in equities could bolster GBPUSD, while a sharp sell-off might trigger a 'risk-off' move, favoring the dollar and potentially pushing GBPUSD lower. The current technical setup is therefore a delicate balance, with short-term bullish signals battling against longer-term ambiguities and the ever-present influence of macroeconomic factors and correlated asset movements.
The Verdict: A Cautious Optimism Hinges on $1.35
The battle at $1.35 for GBPUSD is more than just a price level; it's a critical inflection point shaped by a confluence of technical signals and fundamental undercurrents. The bulls have managed to push the price towards this significant resistance, bolstered by short-term bullish indicators and a slightly weaker US Dollar. The RSI and Stochastic oscillators on the hourly and 4-hour charts generally support further upside potential, painting a picture of momentum. However, the bears have valid counterarguments, primarily stemming from the daily chart's more cautious signals and the historically significant nature of the $1.35 level itself. The weak trend indicated by the ADX across multiple timeframes is a key concern, suggesting that the recent rally might lack the conviction needed for a sustained breakout. A failure to decisively clear $1.35 could lead to a sharp reversal, targeting lower support levels like $1.33924 and potentially $1.33598.
For the bullish case to truly take hold, we need to see a clear and sustained break above $1.35, ideally accompanied by an increase in trading volume and a strengthening ADX on the daily chart. This would confirm that the current move is not just a retracement but the beginning of a new upward trend. Confirmation would also come from continued weakness in the DXY and a stable to positive risk sentiment in global equity markets. On the flip side, a rejection at $1.35, especially if coupled with a dovish shift in central bank rhetoric or concerning economic data from the UK, would embolden the bears. Such a scenario could see GBPUSD quickly retrace its gains, testing the support levels mentioned earlier. The near-term outlook therefore hinges critically on how the market digests this key resistance level. The price action in the coming hours and days will be crucial in determining whether $1.35 acts as a springboard for further gains or a ceiling leading to a significant pullback.
Ultimately, while the short-term technicals offer some encouragement for the bulls, the overall picture suggests a high degree of uncertainty. The market is at a critical crossroads, and the $1.35 level will serve as the ultimate arbiter. Traders should exercise caution, looking for clear confirmation before committing to a directional bias. Patience appears to be the most prudent strategy here, waiting for a decisive break above resistance or a clear rejection and reversal pattern to form. The market always offers a second chance, and the key is to wait for a high-probability setup that aligns with both technical and fundamental catalysts. Managing risk diligently will be paramount in navigating this pivotal juncture for GBPUSD.
Bullish Scenario: Breaking the Chains
60% ProbabilityNeutral Scenario: Choppy Waters Around $1.35
25% ProbabilityBearish Scenario: Resistance Holds Strong
15% Probability| Indicator | Value | Signal | Interpretation |
|---|---|---|---|
| RSI (14) | 56.21 | Neutral | Slightly bullish momentum, room to run before overbought. |
| MACD | Positive | Bullish | Momentum favors upside on daily chart. |
| Stochastic | K=80.19, D=52.46 | Bullish | Strong bullish signal on daily, suggesting potential for further gains. |
| ADX | 16.75 | Weak Trend | Lack of strong directional conviction across timeframes. |
| Bollinger | Above Mid Band | Bullish | Price action suggests upward pressure. |
Frequently Asked Questions: GBPUSD Analysis
What happens if GBPUSD breaks decisively above the $1.35 resistance level?
A sustained break above $1.35, confirmed by higher volume and a stronger ADX on the daily chart, would likely trigger further upside, targeting resistance levels around $1.3473 and potentially $1.3537 as bulls gain control.
Should I buy GBPUSD at current levels of $1.35 given the RSI at 56.21?
Buying at $1.35 requires caution. While the daily RSI at 56.21 offers room for upside, the weak ADX suggests a lack of trend conviction. A more prudent approach would be to wait for confirmation of a breakout above $1.35 or a clear rejection to form a more reliable trading setup.
Is the Stochastic K=80.19, D=52.46 signal on the daily chart a strong buy for GBPUSD?
This bullish Stochastic crossover on the daily chart is a positive sign, suggesting potential for further gains. However, it should be viewed in conjunction with other indicators; the weak ADX indicates that this signal might not lead to a sustained trend without additional confirmation.
How will the upcoming Bank of England commentary affect GBPUSD this week if it signals a less hawkish stance?
A less hawkish BoE stance could weigh on GBPUSD, especially if the Federal Reserve maintains a hawkish tone. This could lead to a rejection at the $1.35 resistance and a potential move towards support levels like $1.33924.
Track markets in real-time
AI-powered analysis, technical indicators and real-time price data.
Join Our Telegram Channel
Breaking market news, AI analysis and trading signals instantly.
Join Channel