

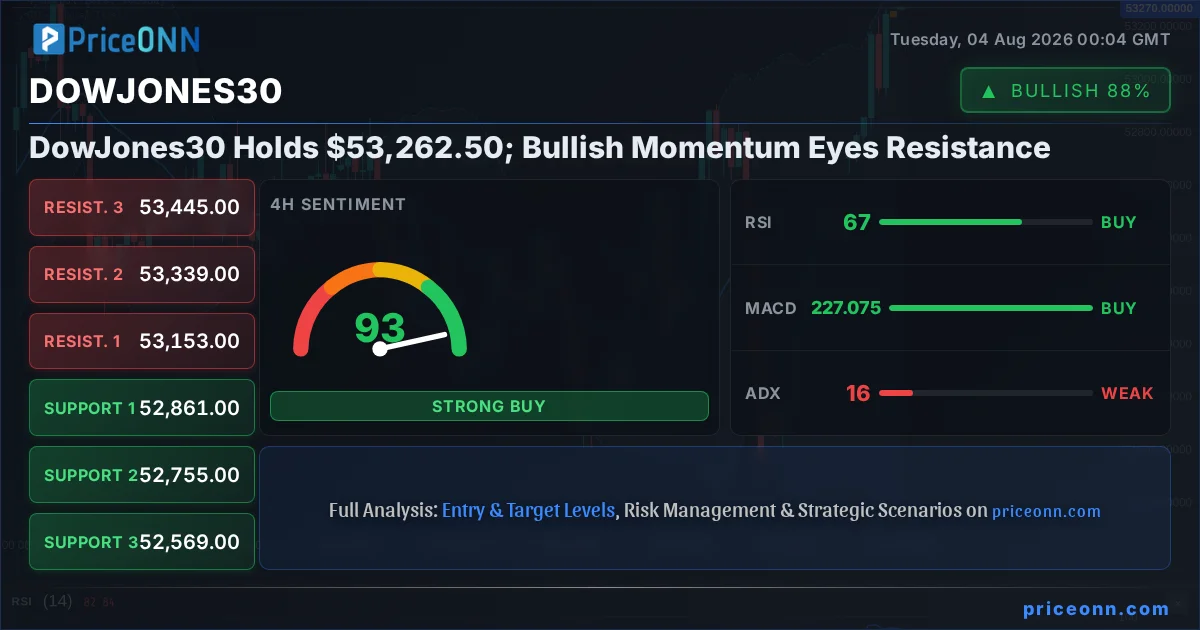
The DowJones30 is currently dancing around the $53,262.50 mark, and the bulls are definitely showing their hand. After a period of consolidation, the index has staged a notable rally, pushing higher and capturing the attention of traders and investors alike. This upward momentum, however, is now approaching significant resistance levels, setting the stage for a critical juncture. Understanding the interplay between the current price action, the underlying technical indicators, and the broader market context is paramount for navigating this phase. The question on everyone's mind isn't just if the rally can continue, but what confirmation signals are needed to suggest a sustained move beyond the current ceiling, or if a pullback is more probable given the proximity to overhead supply. This analysis dives deep into the DowJones30's current technical posture, exploring the indicators that are painting a mixed but leaning bullish picture, and assessing the levels that will dictate its next significant move.
- The DowJones30 is currently trading at $53,262.50, showing strong bullish momentum on the 1-hour chart.
- Key resistance is identified at $53,361.33, a level that needs to be decisively broken for further upside.
- The ADX at 15.94 indicates a weak trend, suggesting the current upward move might lack sustained conviction.
- Correlation analysis with DXY (at 100.05) suggests potential headwinds if the dollar continues its ascent.
Navigating the Bullish Surge: What the Charts Are Saying
The 1-Hour Picture: Momentum Building
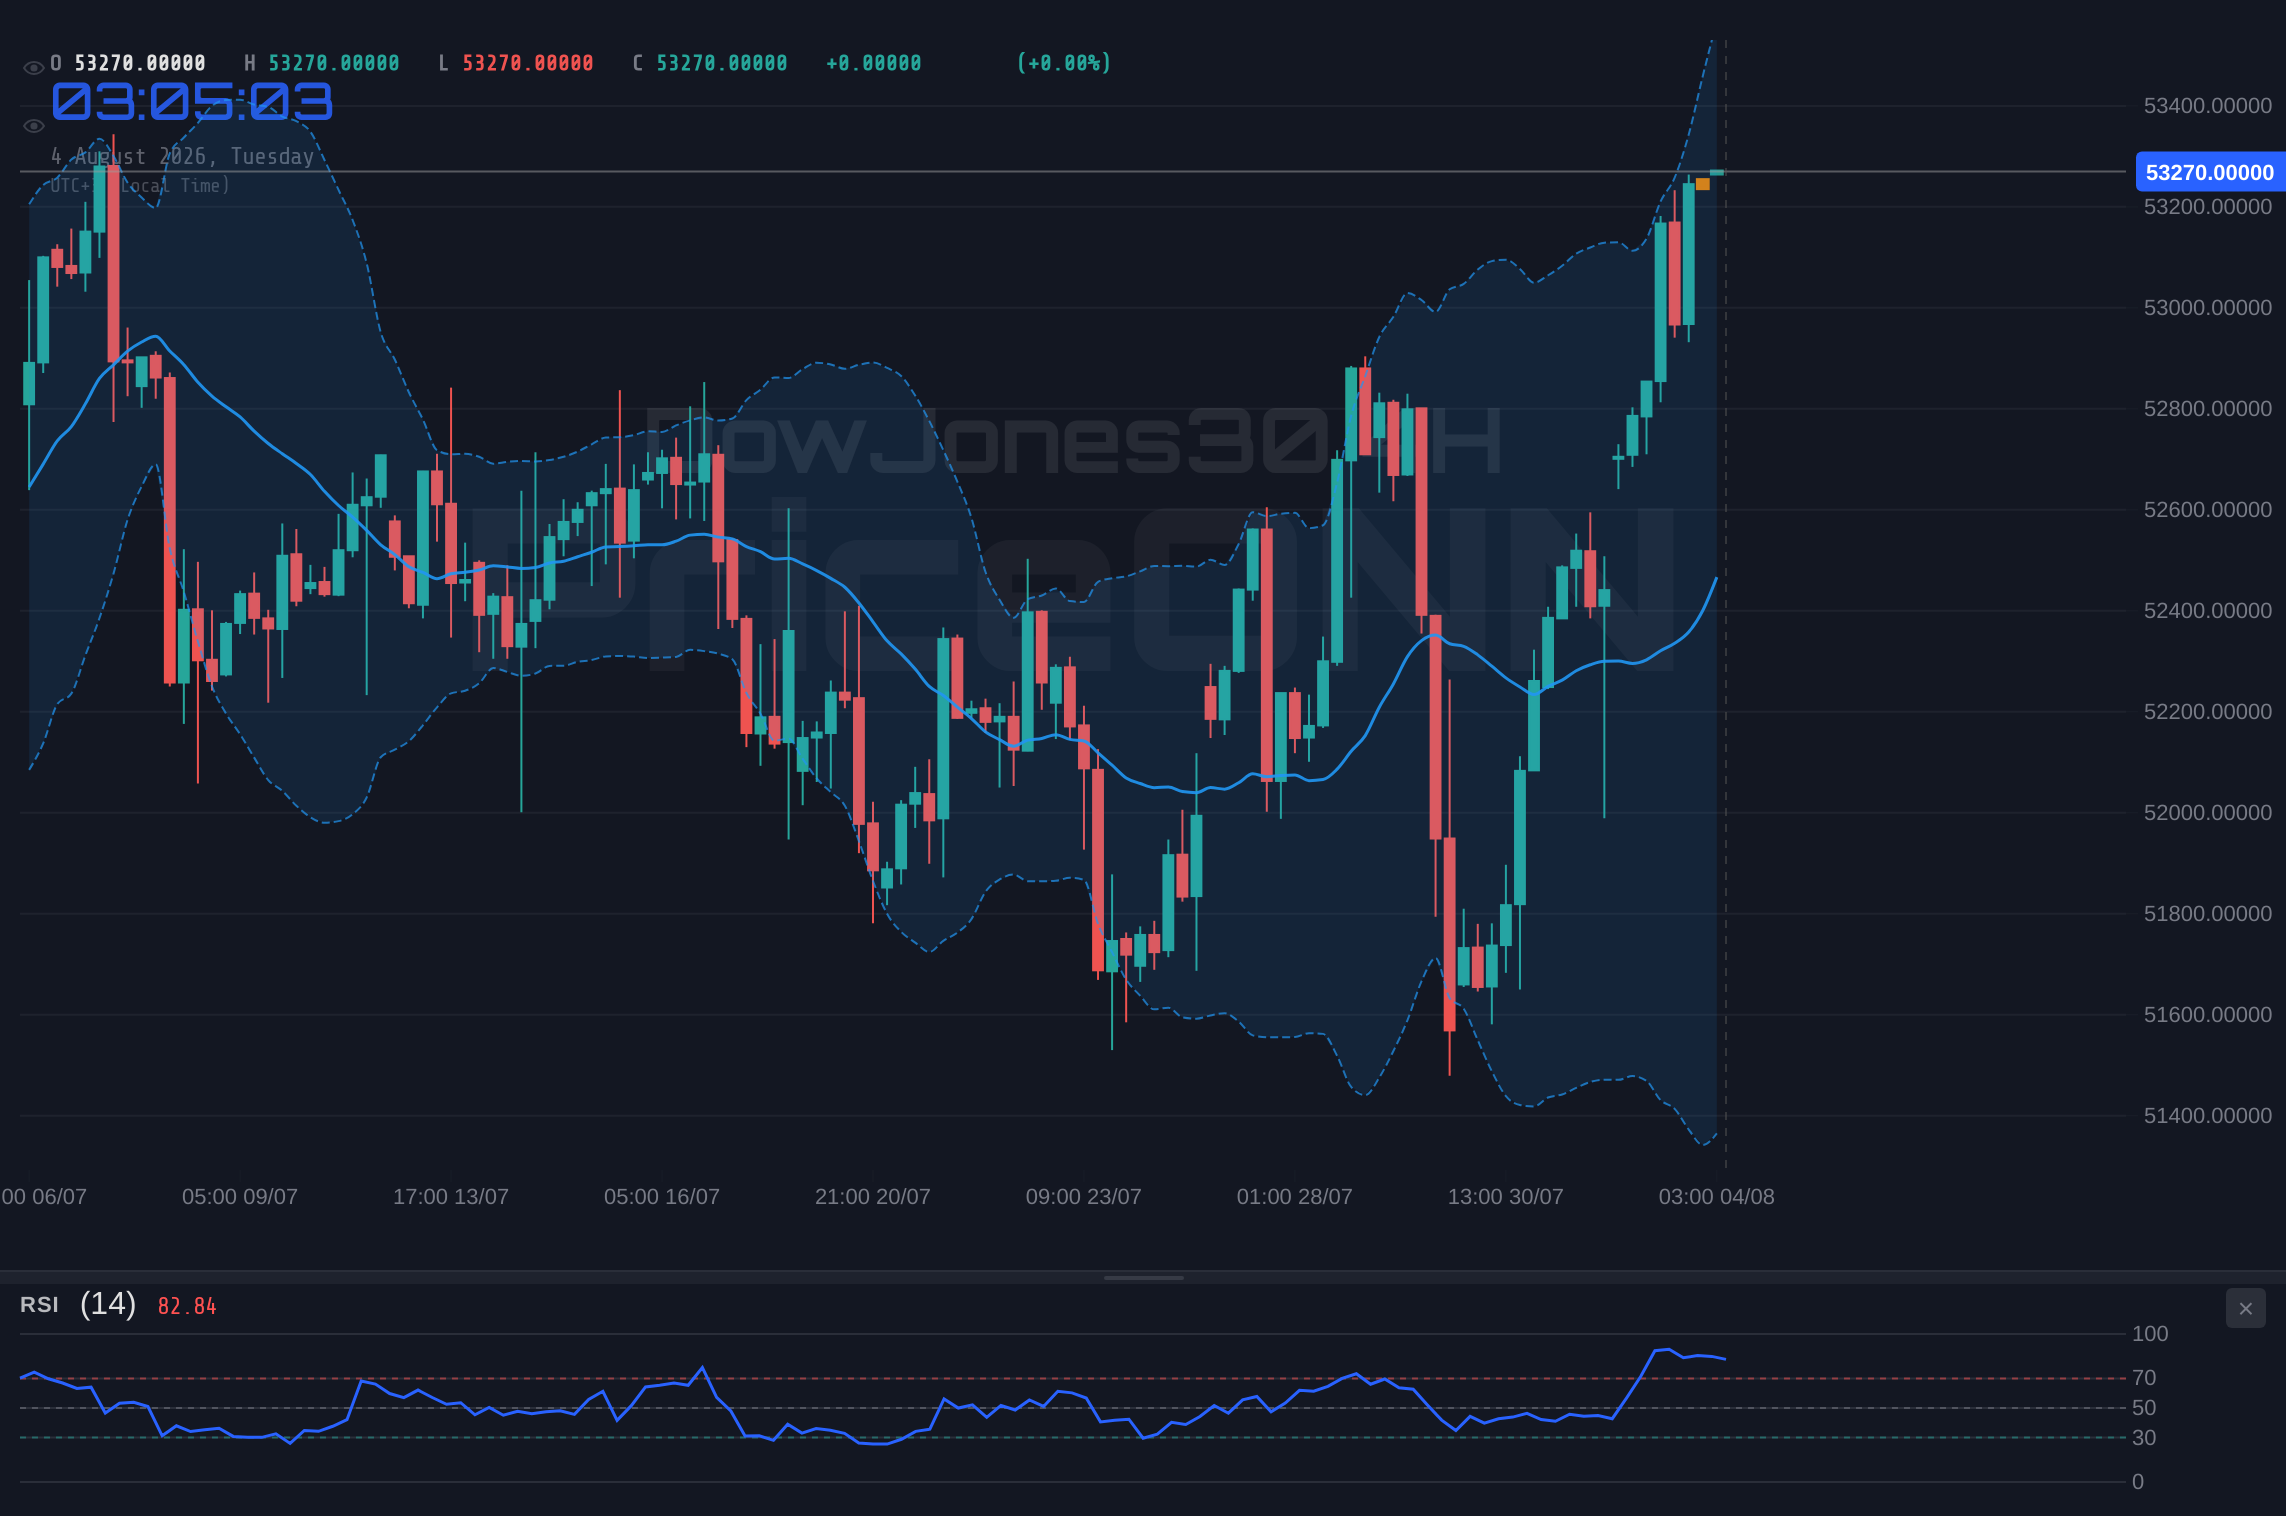
Looking at the 1-hour timeframe, the DowJones30 is painting a decidedly bullish picture. The index is trading at $53,262.50, a level that has seen strong buying interest emerge. The trend strength on this short-term chart is at 100%, indicating a clear upward direction. Supporting this are several technical indicators. The RSI(14) is sitting at 72.62, firmly in overbought territory. While this can sometimes signal an impending pullback, in a strong uptrend, it can also indicate significant bullish momentum. This is further supported by the MACD, which is showing positive momentum with the MACD line above its signal line. The Stochastic Oscillator, with K at 94.18 and D at 76.88, is also deep in overbought territory, suggesting a potential for a short-term pause or consolidation. However, the ADX at 35.87 points to a strong trend, which is somewhat at odds with the weaker trend readings on longer timeframes. This short-term bullishness is palpable, with a general 'BUY' signal across most indicators in this timeframe. The immediate support is seen at $53,193.33, while resistance looms around $53,361.33. A decisive break above this resistance could signal further upside, but the overbought conditions warrant caution.
The 4-Hour Perspective: A Moment of Truth
Shifting to the 4-hour chart, the picture becomes more nuanced, revealing a trend that is technically classified as neutral, albeit with a high strength of 98% leaning towards bullishness. Here, the DowJones30 is hovering near the $53,262.50 mark. The RSI(14) at 67.07 is still in the upper reaches of the neutral zone, indicating room for further upside before becoming truly overbought on this timeframe. The MACD is also displaying positive momentum, with the MACD line above its signal line, reinforcing the bullish undertone. The Stochastic Oscillator, however, is showing K at 92.41 and D at 94.05, indicating an extremely overbought condition, and importantly, the %K line is now below the %D line, which can be an early warning signal for a potential reversal or at least a period of consolidation. The ADX stands at 15.94, which is a crucial reading. This low ADX value signifies a weak trend, suggesting that the current upward move might be more of a choppy rally within a broader range rather than a strong, committed trend. This aligns with the neutral trend classification on this timeframe. Support levels are identified at $52,569, $52,755, and $52,861, while resistance is eyed at $53,153, $53,339, and $53,445. This timeframe suggests that while the immediate pressure is upwards, the underlying trend strength is lacking, making the approach to resistance levels a critical test.
Daily Timeframe: The Bigger Picture and Underlying Strength
On the daily chart, the DowJones30 presents a trend classified as bullish, with a strength of 83%. The current price of $53,262.50 is situated within a trading range defined by support at $52,065, $51,707, and $51,425, and resistance at $52,705, $52,987, and $53,345. The RSI(14) at 60.7 is comfortably in the neutral zone, suggesting ample room for further appreciation before hitting overbought territory. This contrasts with the shorter timeframes and offers a more balanced perspective. The MACD is positive, with the MACD line above its signal line, indicating sustained bullish momentum on a daily basis. The Stochastic Oscillator, with K at 73.68 and D at 50.25, is showing a clear bullish signal, with the %K line well above the %D line and not yet in extreme overbought territory. However, the ADX value of 15.89 on the daily chart is a significant factor. This low reading indicates a weak trend, reinforcing the observation from the 4-hour chart that the overall market direction, while currently positive, lacks the robust trending power typically seen in sustained bull markets. This suggests that the index might be consolidating or trading within a wider range, with the current rally being a move towards the upper boundary of that range. The resilience of support levels, particularly $52,065, will be crucial for maintaining this bullish posture.
Correlation and Context: The Dollar and Risk Appetite
The Dollar's Influence: DXY at a Critical Juncture
The US Dollar Index (DXY) is currently trading at 100.05, showing a slight increase on the day. This level is significant, as it sits at a confluence of technical factors. On the 1-hour chart, the DXY shows a neutral trend with a 50% strength, RSI at 54.78, and MACD positive. However, the Stochastic Oscillator (K=78.69, D=81.85) is showing a bearish signal with K below D, and the ADX at 31.82 indicates a strong trend, albeit in this case, a downward one on the 1H chart. The 4-hour chart paints a different picture: a neutral trend with 50% strength, RSI at 41.31, MACD negative, and ADX at 34.33 suggesting a strong downward trend. The daily chart also shows a neutral trend with 50% strength, RSI at 38.76, MACD negative, and ADX at 24.19 indicating a moderate downtrend. Despite these mixed signals across timeframes, the dollar's current position around the 100.05 mark is historically a point of contention. A strengthening dollar typically puts pressure on risk assets like stocks and commodities, and vice-versa. With the DowJones30 showing bullish momentum, a continued rise in the DXY could present a headwind. Conversely, a weakening dollar could provide additional fuel for the ongoing rally in the DowJones30, especially if it signals a broader shift in risk appetite away from safe-haven assets.
Risk Appetite: SP500 and Nasdaq's Tale
The broader equity markets, represented by the SP500 and Nasdaq100, are also showing strength, which is a key factor for the DowJones30. The SP500 is trading at 6572.87, up 0.74% on the day, with a strong bullish trend on the 1-hour and 4-hour charts, but a bearish trend on the daily chart. Its RSI is 70.95 on the 1-hour, indicating overbought conditions, while the ADX at 49.72 shows a strong trend. The Nasdaq100 is similarly strong, trading at 28846.8, up 2.23%. It exhibits a bullish trend on the 1-hour and 4-hour charts, with RSI readings above 70 on both, signaling overbought conditions. The daily chart for the Nasdaq100 shows a bearish trend, albeit with a bullish signal from the Stochastic. The ADX on the 1-hour and 4-hour charts indicates strong upward trends. The fact that both major indices are showing upward momentum, particularly on shorter timeframes, supports the bullish narrative for the DowJones30. However, the conflicting bearish signals on the daily charts for both SP500 and Nasdaq100, coupled with their respective overbought RSI readings on the 1-hour charts, suggest that the sustainability of this broad market rally might be tested soon. Any significant downturn in these indices could easily spill over to the DowJones30, especially as it approaches its own resistance levels.
Commodities and Inflation: The Brent and WTI Connection
Oil prices, represented by Brent and WTI, are currently experiencing a notable downturn. Brent crude is trading at $82.77, down 6.36%, while WTI is at $80.81, down 6.32%. Both are showing a bearish trend on their daily timeframes, with weak ADX readings on longer timeframes but stronger trends on shorter timeframes. The significant drop in oil prices is a key piece of the economic puzzle. Lower energy costs can sometimes translate to lower inflation expectations, which might influence central bank policy. However, the magnitude of the drop also raises questions about global demand. If the decline in oil prices is a precursor to a broader economic slowdown, this could eventually weigh on equity markets, including the DowJones30. For now, the falling oil prices are somewhat counterintuitive to a strong bullish equity market, unless they are seen purely as a deflationary force that might encourage easier monetary policy down the line. The current price action in oil suggests that market participants are factoring in potential demand weakness, which adds another layer of complexity to the outlook for risk assets like the DowJones30.
Scenarios: Where Does the DowJones30 Go Next?
Bearish Scenario: Resistance Holds Firm
55% ProbabilityNeutral Scenario: Consolidation Around Current Levels
25% ProbabilityBullish Scenario: Breaking Through Resistance
20% ProbabilityThe Path Forward: Key Levels and What to Watch
The DowJones30 is at a critical crossroads. The immediate bullish momentum is undeniable, driven by strong short-term technical signals and positive sentiment in broader equity markets. However, the confluence of approaching resistance levels, weaker trend strength indicated by the ADX on longer timeframes, and the potential for dollar strength creates a complex picture. Traders must pay close attention to the $53,361.33 resistance level. A failure to break decisively above this point, especially if accompanied by a drop below the $53,193.33 support on the 1-hour chart, could signal a reversal. Conversely, a strong breakout above $53,361.33, supported by increasing volume and positive divergence on longer-term indicators, could open the door for further gains towards $53,445 and potentially higher psychological levels. The neutral trend strength across multiple timeframes means that volatility could increase around these key levels, making risk management paramount.
The interplay between the dollar index and the equity markets will be a significant driver. If the DXY continues to climb from its current 100.05 level, it could exert downward pressure on the DowJones30, especially as it nears resistance. Conversely, a weakening dollar might provide the tailwind needed for a successful breakout. Market participants are also watching the SP500 and Nasdaq100 closely; their ability to sustain their current rallies, despite daily chart bearish signals and overbought conditions on shorter timeframes, will be indicative of broader market sentiment. The significant drop in oil prices adds another layer of uncertainty, potentially signaling concerns about global demand, which could eventually impact corporate earnings and, by extension, stock prices. For now, the focus remains on the immediate price action around $53,262.50 and the key resistance at $53,361.33. Patience and a data-driven approach will be crucial in determining the next significant directional move.
Frequently Asked Questions: DowJones30 Analysis
What happens if DowJones30 breaks above the $53,361.33 resistance level?
A decisive break above $53,361.33, especially with strong volume, would invalidate the immediate bearish outlook. This could trigger further buying pressure, potentially targeting the $53,445 resistance on the 4-hour chart, and possibly even higher psychological levels around $53,500. Confirmation from daily indicators would be crucial for sustained upside.
Should I consider buying DowJones30 at current levels around $53,262.50 given the mixed signals?
Buying at current levels carries risk due to the proximity to resistance and the weak trend strength (ADX 15.94). A more prudent approach might be to wait for a clear breakout above $53,361.33 or a dip to a more attractive support level like $53,153, coupled with bullish confirmation signals, to improve the risk-reward ratio.
Is the RSI at 72.62 on the 1-hour chart a sell signal for DowJones30?
An RSI of 72.62 on the 1-hour chart indicates overbought conditions, which can signal a potential short-term pullback. However, in a strong uptrend, high RSI readings can persist. It's not a definitive sell signal on its own; traders should look for confirmation from other indicators or price action, such as a break below immediate support or bearish divergence on longer timeframes.
How might the DXY at 100.05 affect DowJones30's move towards resistance?
The DXY trading at 100.05 presents a potential headwind for the DowJones30's advance. A strengthening dollar typically correlates with a decrease in risk appetite, which could dampen bullish sentiment in equities. If the DXY pushes higher from here, it might add selling pressure to the DowJones30 as it approaches its resistance levels, making a breakout more challenging.
Track markets in real-time
AI-powered analysis, technical indicators and real-time price data.
Join Our Telegram Channel
Breaking market news, AI analysis and trading signals instantly.
Join Channel