

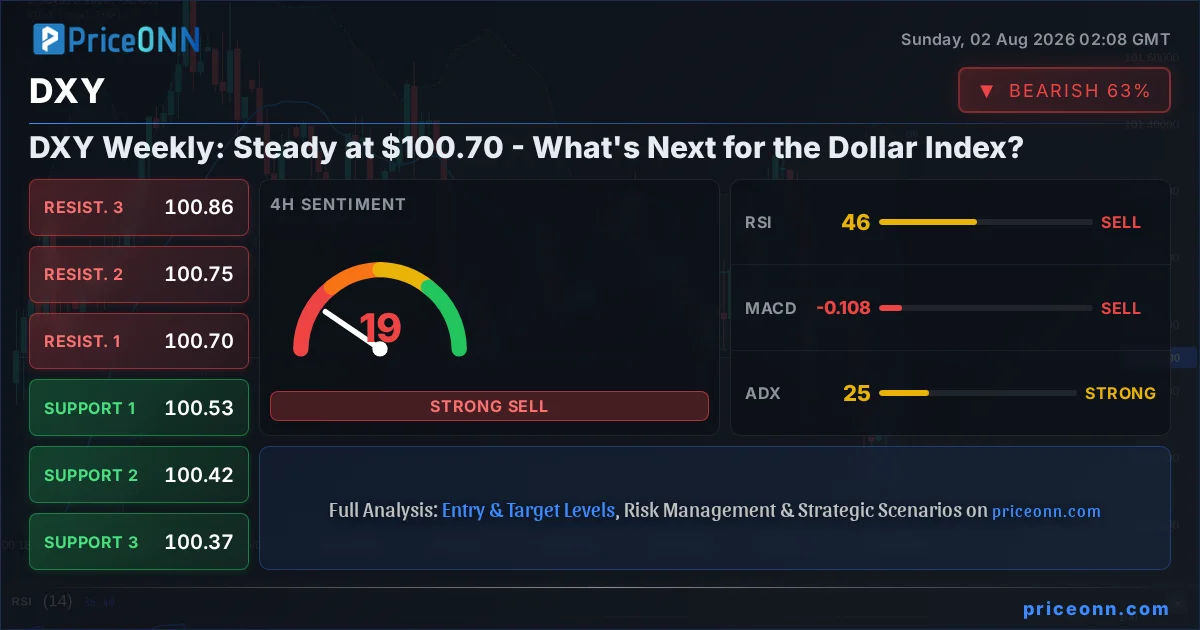
The Dollar Index (DXY) has found a temporary footing around the $100.70 mark as last Friday’s trading week concluded. This period of consolidation follows a tumultuous few weeks where market participants grappled with shifting central bank expectations, persistent inflation data, and evolving geopolitical tensions. As we step into a new trading week, the question on many traders' minds is whether this stability is a prelude to further gains, a pause before a significant pullback, or simply a continuation of the current range-bound environment. Understanding the intricate dance between economic data, Federal Reserve policy signals, and broader market sentiment is crucial for navigating the DXY's next move. This analysis delves into the key drivers from the past week, examines the technical landscape, and forecasts the potential scenarios for the dollar index in the coming days, offering insights for scalpers, swing traders, and long-term investors alike.
- The DXY is consolidating around $100.70, with RSI at 51.34 indicating neutral pressure on the daily chart.
- Critical support for the DXY sits at $100.21, a level tested multiple times this past week.
- MACD on the daily chart shows negative momentum, suggesting potential downside pressure despite a neutral RSI.
- Federal Reserve rate cut expectations, heavily influenced by upcoming employment and inflation data, are a key driver for DXY's correlation with other markets.
Navigating the Economic Crosscurrents: Last Week's Key Developments
Last week was a fascinating, albeit somewhat muted, period for the US Dollar Index (DXY). While the price action hovered around the $100.70 level, the underlying currents were anything but still. The Federal Reserve, after its recent policy meeting, maintained a stance that was perceived as cautiously optimistic, signaling a potential pause in rate hikes but leaving the door open for future adjustments based on incoming economic data. This has led to a complex pricing of future Fed actions, with market participants closely scrutinizing every piece of economic information for clues about the trajectory of interest rates. Inflationary pressures, while showing some signs of easing, remain a primary concern. The latest Eurozone core inflation data, for instance, unexpectedly accelerated to 2.5%, reinforcing a hawkish stance from the European Central Bank (ECB). This divergence in central bank policy outlooks between the US and Europe is a critical factor influencing EUR/USD, and by extension, the DXY.
Geopolitical developments also continued to cast a shadow, though perhaps less acutely than in previous weeks. The ongoing conflict in the Middle East, while not causing immediate spikes in oil prices, remains a background risk that could quickly reignite safe-haven demand for the dollar. Saudi Arabia's recent oil output figures, showing a decrease in production but an increase in revenue due to higher prices, highlight the delicate balance in energy markets. Furthermore, trade tensions, particularly the lingering threat of tariffs, continue to be a background hum, impacting global risk appetite and indirectly influencing dollar flows. The Yen's recent sharp fall against the dollar, reportedly due to intervention, also signals a broader trend of currency market volatility, where the DXY often acts as the benchmark.
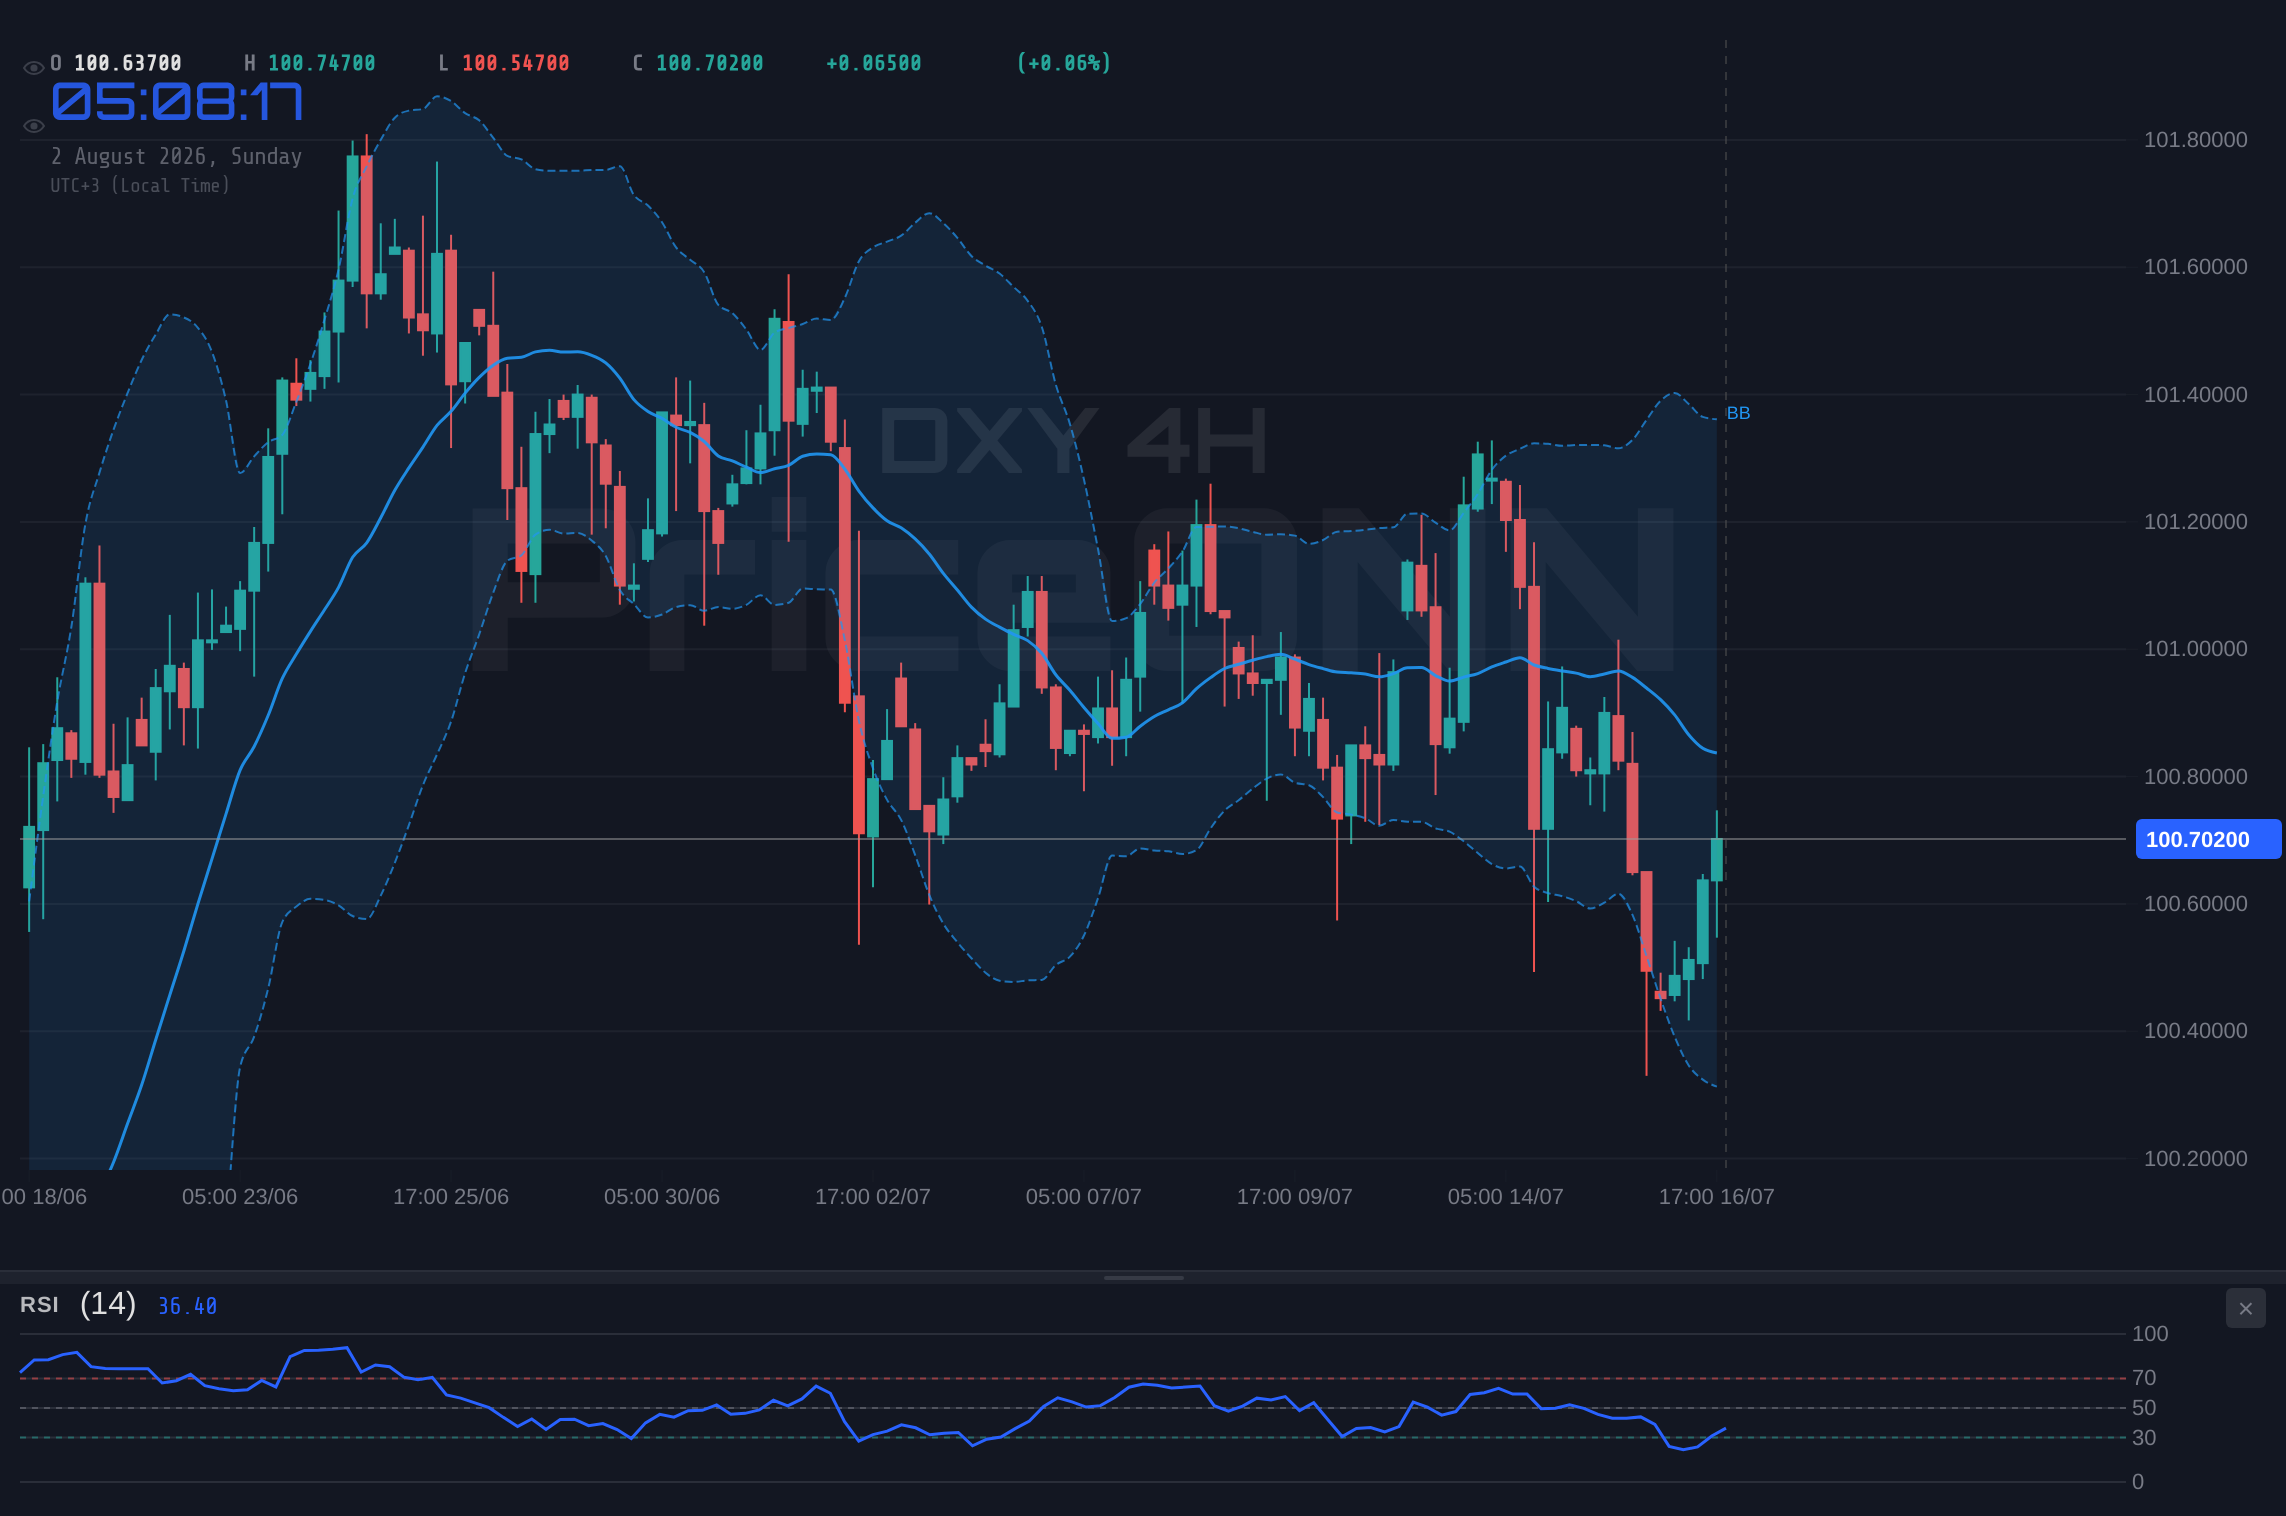
From a US domestic perspective, the economic calendar provided a mixed bag of signals. While some indicators suggested resilience, others hinted at a potential slowdown. This ambiguity is precisely what makes the upcoming Non-Farm Payrolls (NFP) report and subsequent inflation figures so crucial. Traders are essentially waiting for a clearer directive from the data – is the US economy strong enough to withstand higher-for-longer interest rates, or are signs of a slowdown becoming too pronounced to ignore? This uncertainty is reflected in the DXY's current neutral trend on the 1-hour and 4-hour charts, although the daily chart still shows a slight downward trend. The interplay of these global and domestic factors is creating a complex environment, making precise forecasting challenging but undeniably engaging for market analysts.
Technical Breakdown: DXY at the Crossroads
The technical picture for the Dollar Index (DXY) at $100.70 presents a nuanced scenario, characterized by conflicting signals across different timeframes. On the 1-hour chart, the trend is neutral with a power of 50%, supported by an RSI of 56.6, which indicates a slight bullish inclination but remains well within neutral territory. The MACD is showing positive momentum, with the MACD line above its signal line, suggesting a short-term upward bias. However, Bollinger Bands are trading above the middle band, indicating an upward trend, but Stochastic K and D lines are in overbought territory (K=86.15, D=82.01), flashing a warning sign for immediate further gains and hinting at potential profit-taking or a stall. The ADX at 27.71 suggests a strong upward trend on this short timeframe, creating a conflict with the overbought stochastic.
Shifting to the 4-hour timeframe, the trend remains neutral with a power of 50%, but the signals diverge. Here, the RSI at 46.15 leans towards a bearish sentiment, suggesting waning buying pressure. The MACD is negative, with the MACD line below its signal line, reinforcing this bearish outlook. Bollinger Bands are trading below the middle band, aligning with a bearish bias. The Stochastic is showing a bullish signal with K > D (41.9 vs 27.16), yet the ADX at 25.26 indicates a strong downward trend. This creates a significant divergence: bearish MACD and RSI, but a bullish stochastic and a strong downward trend signal from ADX. This conflict suggests indecision and a lack of clear direction on this timeframe.
The daily chart offers a broader perspective. The trend is also neutral with a power of 50%, and the RSI at 51.34 is right in the middle, offering no clear direction. The MACD, however, is showing negative momentum, with the MACD line below its signal line, which is a bearish indicator. Bollinger Bands are trading below the middle band, consistent with a downward bias. The Stochastic is signaling a potential downturn, with K
Correlation Analysis: The Dollar's Interconnected World
The Dollar Index (DXY) does not operate in a vacuum; its movements are intricately linked to a host of other global markets. Understanding these correlations is paramount for a comprehensive analysis. Currently, with the DXY hovering around $100.70, we observe distinct relationships playing out. For instance, the inverse correlation with gold remains a key theme. Gold prices are currently trading at $4001.21, down 1.46% on the day. A stronger dollar typically puts downward pressure on gold, as dollar-denominated commodities become more expensive for holders of other currencies. However, the narrative is complex; while the DXY is showing some resilience, gold's recent slide is also attributed to fading Fed hike bets and potential profit-taking after earlier gains, as noted by RTTNews. This means the typical inverse relationship might be temporarily overshadowed by other factors driving gold prices.
Equities, particularly US indices like the S&P 500 and Nasdaq, often exhibit an inverse relationship with the DXY, acting as a barometer for risk appetite. The S&P 500 is trading at 6572.87, up 0.74%, while the Nasdaq 100 is down 1.16% at 29164.86. This divergence within the equity markets itself is notable. A rising DXY can dampen enthusiasm for riskier assets by increasing borrowing costs and making US exports more expensive. Conversely, a falling DXY can fuel risk-on sentiment, pushing equities higher. The current mixed signals from US equities, with the S&P 500 showing strength while the tech-heavy Nasdaq struggles, add another layer of complexity. This suggests that while some risk appetite exists, it's not uniform across all sectors, potentially limiting the DXY's upside if broader risk sentiment were to turn negative.
Oil prices, represented by Brent crude at $83.79 (down 0.83%), serve as a crucial indicator for inflation expectations and geopolitical risk. Higher oil prices can fuel inflation, potentially leading to tighter monetary policy from the Fed, which would typically support the DXY. Conversely, falling oil prices might signal weakening global demand or de-escalating geopolitical tensions, which could reduce the safe-haven appeal of the dollar. The current slight dip in oil prices, while the DXY holds steady, suggests that neither inflation fears nor geopolitical risks are currently dominating the narrative to the extent of causing significant dollar appreciation based on this factor alone. The relationship between bond yields and the DXY is also vital; rising yields generally attract capital to the US, strengthening the dollar, while falling yields can have the opposite effect. The interplay of these correlated assets provides a broader context for understanding the DXY's present valuation and potential future direction.
The Bull Case: Reclaiming Higher Ground
For the bulls to regain control of the Dollar Index (DXY) and push it decisively above the current $100.70 level, several key conditions need to be met. Primarily, a sustained period of positive economic data from the United States would be crucial. This includes stronger-than-expected employment figures, such as a robust Non-Farm Payrolls (NFP) report, and inflation data that, while perhaps not accelerating, remains sticky enough to keep the Federal Reserve from signaling imminent rate cuts. The market's current pricing of Fed policy is a delicate balance; any data that pushes the probability of further rate hikes or a higher-for-longer interest rate scenario higher would likely be a catalyst for dollar strength. For instance, if upcoming jobs data shows significant upside surprise, it could reinforce the narrative that the US economy is resilient, thereby supporting the DXY.
Technically, the DXY needs to decisively break through the immediate resistance level at $100.73 on the daily chart. A close above this level, ideally with increased volume, would be the first signal of bullish conviction. Following this, the next significant resistance to watch would be $100.79, and then the more substantial hurdle at $100.86. Holding above these levels would confirm a shift in momentum. On the 1-hour chart, the Stochastic is already in overbought territory, suggesting a potential pullback before a sustained rally. Therefore, the ideal bullish scenario would involve a brief consolidation or minor pullback after breaching $100.73, allowing the Stochastic to reset before a renewed push towards $100.79 and beyond. The ADX at 27.71 on the 1-hour chart indicates a strong trend is possible if the price can break out of the current consolidation.
Furthermore, a shift in global risk sentiment towards a more cautious or risk-off environment could also bolster the DXY. If equity markets, particularly the Nasdaq 100 which is currently trading down 1.16%, were to experience a sharper decline, investors might seek the perceived safety of the US dollar. Geopolitical tensions, if they escalate, could also trigger safe-haven flows into the DXY. From a correlation standpoint, a weakening Euro, perhaps due to persistent inflation or a more dovish ECB stance than anticipated, would directly support the DXY as EUR/USD is inversely correlated. The current Eurozone core inflation at 2.5% might suggest otherwise, but market expectations can shift rapidly. For the bull case to materialize, we need a combination of strong US data, a clear signal from the Fed that rates will stay higher for longer, and potentially a turn in global risk sentiment, all while the DXY breaks key resistance levels.
The Bear Case: Dollar's Downward Spiral
Conversely, the bearish scenario for the Dollar Index (DXY) hinges on a combination of factors that would signal a weakening US economy, a dovish pivot from the Federal Reserve, or a significant shift in global risk appetite towards riskier assets. The most immediate technical level to watch for a bearish confirmation is the support at $100.64 on the 1-hour chart and more critically, $100.21 on the daily chart. A decisive break below $100.21, especially with increased trading volume, would invalidate the current neutral-to-slightly-bullish short-term outlook and open the door for further declines. The MACD on the daily chart is already exhibiting negative momentum, and if the RSI were to dip below 50, it would further strengthen the bearish case.
Fundamentally, the bearish thesis would be significantly bolstered by economic data that points towards a noticeable slowdown in the US economy. For example, a significantly weaker-than-expected NFP report or a drop in consumer spending could lead markets to price in earlier and more aggressive Fed rate cuts. This would reduce the yield advantage of US dollar-denominated assets, making the dollar less attractive. The current neutral RSI on the daily chart (51.34) suggests there's room for it to fall into bearish territory without being oversold. If the DXY were to break below $100.21, the next significant support levels to target would be $99.93, followed by $99.53. The ADX on the daily chart, at 27.03, indicates a strong trend is present; if this trend were to shift downwards, the selling pressure could intensify rapidly.
From a correlation perspective, a strengthening Euro, possibly driven by the ECB adopting a more hawkish tone or Eurozone inflation remaining stubbornly high, would put direct downward pressure on the DXY. If EUR/USD were to break above its resistance at 1.14515 and push towards 1.14647, it would likely coincide with DXY weakness. Similarly, a resurgence in risk appetite, leading to a strong rally in both the S&P 500 (currently at 6572.87) and Nasdaq 100 (currently at 29164.86), could divert capital away from the perceived safe-haven dollar. Moreover, any signs of de-escalation in geopolitical tensions or a resolution to trade disputes could reduce the demand for the dollar as a safe haven. The combination of weakening US economic signals, a dovish shift in Fed expectations, and a strengthening of competing currencies or risk assets would paint a clear bearish picture for the DXY.
The Waiting Game: Consolidation and Range-Bound Play
In the absence of a clear directional catalyst, the DXY could remain locked in a consolidation phase around the $100.70 level. This scenario, often characterized by choppy price action and indecisive market sentiment, is plausible given the conflicting signals across timeframes and the mixed economic data landscape. On the 1-hour chart, the ADX at 27.71 suggests a strong trend is possible, but the overbought Stochastic (K=86.15, D=82.01) warns of potential reversal or pause. This creates a classic range-bound setup where price struggles to break key levels. The immediate resistance at $100.73 and support at $100.64 become the boundaries of this trading range.
For this consolidation scenario to persist, we would likely see the DXY oscillating between these levels. Scalpers might find opportunities in short-term trades within this range, targeting the boundaries. Swing traders, however, would likely remain on the sidelines, waiting for a decisive breakout. The lack of a strong trend on the 4-hour chart (ADX at 25.26) and the neutral RSI (46.15) on the daily chart further support the idea of a period of indecision. This phase could be driven by market participants waiting for the upcoming economic calendar events, particularly the NFP report and inflation data, to provide a clearer direction.
During such a consolidation, correlations might also become less predictable. For example, gold might fluctuate based on its own internal drivers rather than strictly following the DXY. Equities could exhibit sector-specific strength and weakness without a uniform risk-on or risk-off move. The key for traders in this scenario is patience and discipline. Instead of forcing trades, the focus should be on identifying the eventual breakout points. A confirmed break above $100.73 could signal a move higher, targeting $100.79 and $100.86. Conversely, a break below $100.64, and more importantly $100.21, would indicate a potential downside acceleration. Until then, the DXY appears to be in a holding pattern, reflecting the broader uncertainty in the global economic outlook.
The Most Likely Scenario and Key Triggers to Watch
Considering the current technical and fundamental landscape, the most probable scenario for the DXY in the immediate short term (next 1-2 weeks) appears to be a continuation of consolidation, with a slight lean towards bearish pressure due to the conflicting signals and the bearish momentum on the daily MACD. The probability of this scenario playing out is estimated at around 60%. The DXY is currently trading at $100.70, caught between the resistance at $100.73 and the support at $100.64 on the 1-hour chart. The daily chart shows a neutral RSI (51.34) but a bearish MACD, creating a tug-of-war. The strong ADX readings across timeframes (27.71 on 1H, 25.26 on 4H, 27.03 on 1D) suggest that when a trend does emerge, it could be significant, but currently, the market seems hesitant to commit.
The primary trigger for a shift out of this consolidation will undoubtedly be the upcoming economic data releases. The Non-Farm Payrolls (NFP) report, scheduled for release next Friday, is the most critical event. A significantly weaker-than-expected NFP print could trigger a sharp move lower in the DXY, potentially pushing it towards the $100.21 support level. Conversely, a much stronger report could see the DXY rally towards the $100.79 and $100.86 resistance levels. Inflation data, such as CPI or PCE, will also play a crucial role, influencing the Fed's future policy decisions and, consequently, the dollar's strength. Any indication that inflation remains stubbornly high could support the DXY, while signs of rapid cooling could pressure it downwards.
Geopolitical developments and shifts in risk sentiment are secondary, but potent, triggers. An escalation of tensions in the Middle East or a significant downturn in global equity markets could provide a sudden boost to the DXY's safe-haven appeal, potentially breaking it out of its current range to the upside. Conversely, signs of de-escalation or a strong risk-on rally could accelerate any potential downside move. For traders, watching the price action around the $100.73 resistance and $100.21 support levels will be key. A confirmed breakout above resistance, especially on positive economic news, could signal a bullish continuation. However, a break below support, particularly on weak data, might initiate a more significant bearish trend. The current technical setup suggests that while a bearish bias might be slightly more probable due to the daily MACD, the market is awaiting confirmation from fundamental data.
What Scalpers, Swing Traders, and Long-Term Investors Should Watch
For scalpers operating on the shortest timeframes, the current DXY range around $100.70 presents opportunities within the confines of the $100.64 to $100.73 levels. They will be looking for quick entries and exits, targeting small profits on bounces off support or rejections from resistance. The overbought Stochastic on the 1-hour chart might offer a short-term bearish signal to fade against the immediate resistance, aiming for a quick move down to $100.64. Conversely, a bounce from $100.64 could be an opportunity to target $100.73. Scalpers must be extremely risk-aware, as any sudden news event can quickly invalidate these short-term trades. The high ADX on the 1-hour chart (27.71) suggests that if a breakout occurs, scalpers need to be ready to adapt quickly.
Swing traders, who typically hold positions for days to weeks, will be looking for a clearer directional signal. They are likely waiting for a decisive break of either the $100.21 support or the $100.73 resistance on the daily chart. A confirmed daily close above $100.73, supported by positive US economic data and a favorable Fed outlook, could be a signal to enter a long position targeting $100.79 and potentially $100.86. Conversely, a daily close below $100.21, especially on weak NFP or inflation data, could prompt a short entry targeting $99.93 and $99.53. The conflicting signals on the 4-hour chart (bearish MACD, bullish Stochastic) mean that swing traders should exercise caution and wait for stronger confirmation before committing significant capital. The key for them is patience, allowing the market to reveal its next direction.
Long-term investors (holding positions for months to years) will view the current price action around $100.70 as part of a larger trend. Their focus will be on the broader macroeconomic picture: the long-term trajectory of US interest rates, the health of the US economy relative to other major economies, and the global geopolitical stability. They might see current levels as an opportunity to accumulate dollar exposure if they believe the Fed will maintain a hawkish stance for an extended period, or if they anticipate a significant global economic downturn that would favor the US dollar as a safe haven. They will be less concerned with daily fluctuations and more interested in the fundamental underpinnings that support or detract from the dollar's long-term value. For them, the key is understanding the overarching narrative, such as the Fed's balance sheet reduction, inflation targets, and the US dollar's role in international trade and finance, rather than focusing on short-term technical indicators.
Historical Context: DXY's Past Performance in Similar Conditions
Looking back at historical data provides valuable context for understanding the DXY's current behavior around the $100.70 mark. Periods of consolidation and conflicting technical signals are not uncommon, especially when central bank policy is at a turning point and economic data is mixed. For instance, during late 2023, the DXY experienced a similar phase of range-bound trading between roughly $103 and $105. During that time, the market was also grappling with the Fed's policy path, with inflation showing signs of cooling but remaining elevated. Technical indicators often flashed divergent signals, much like they are now, with RSI hovering around neutral levels while MACD and Stochastic oscillated between bullish and bearish readings. This historical precedent suggests that periods of indecision can be prolonged, lasting several weeks or even months, before a decisive catalyst emerges.
In past instances where the DXY consolidated around key psychological levels like 100 or 101, the subsequent moves were often triggered by significant shifts in economic data or central bank rhetoric. For example, a strong jobs report or a surprisingly hawkish statement from a Fed official could lead to a breakout, while a weak inflation print or hints of a Fed pivot could trigger a sharp decline. Historically, the DXY has shown a tendency to trend strongly once a clear direction is established, often driven by significant divergences in monetary policy between the US Federal Reserve and other major central banks like the ECB or the Bank of Japan. The current neutral trend strength on the 4-hour chart (ADX 25.26) and the strong trend potential indicated by the daily ADX (27.03) suggest that when the DXY does break out of its current range, the ensuing move could be substantial, echoing past trend formations.
Furthermore, the correlation between the DXY and other assets like gold and equities has varied historically. While a strong inverse correlation with gold is often observed, there have been periods where both assets moved in tandem due to broader risk-off sentiment. Similarly, the relationship with equities is generally inverse, but sector-specific performance or unique market events can sometimes disrupt this pattern. Understanding these historical correlations, and acknowledging that they can shift, is vital. For example, the recent divergence in US equity performance (S&P 500 up, Nasdaq down) is a relatively new development that adds complexity to predicting the DXY's reaction to equity market moves. By examining these past patterns, traders can better anticipate potential market behaviors and prepare for various outcomes, recognizing that the current consolidation phase is a natural part of the market cycle.
The Path Forward: Scenarios and Key Triggers
Bearish Scenario: Dollar Under Pressure
60% ProbabilityNeutral Scenario: Range-Bound Trading
25% ProbabilityBullish Scenario: Dollar Strength Returns
15% ProbabilityThe path forward for the Dollar Index (DXY) appears to be at a critical juncture, with the most probable scenario leaning towards continued consolidation with a slight bearish bias, estimated at 60% probability. This outlook is shaped by the current technical indecision, particularly the conflicting signals across different timeframes, and the anticipation of key economic data. The DXY currently sits at $100.70, with immediate resistance at $100.73 and support at $100.64 on the hourly chart, and more significant levels at $100.21 (support) and $100.73 (resistance) on the daily chart. The bearish MACD momentum on the daily chart adds weight to the downside, while the neutral RSI (51.34) provides room for further movement in either direction.
The primary triggers that will likely dictate the DXY's direction in the coming week are the upcoming economic data releases. The Non-Farm Payrolls (NFP) report, due next Friday, is the most anticipated event. A significantly weaker-than-expected result could accelerate a move towards the $100.21 support, potentially targeting $99.93 and $99.53. Conversely, a surprisingly strong NFP print, coupled with sticky inflation figures, could fuel a rally towards the $100.79 and $100.86 resistance levels. The market's interpretation of these figures regarding the Federal Reserve's future policy – specifically, the likelihood of rate hikes versus cuts – will be paramount. Any signal that the Fed might keep rates higher for longer would bolster the dollar.
Geopolitical developments and shifts in global risk sentiment serve as secondary but potentially impactful triggers. An increase in geopolitical tensions, particularly in the Middle East, could spur safe-haven demand for the dollar, potentially pushing the DXY above $100.73. Conversely, a significant rally in risk assets like the S&P 500 (currently at 6572.87) or a de-escalation of trade disputes could weigh on the dollar. For traders, the key is to monitor the price action around the $100.21 support and $100.73 resistance levels. A confirmed daily close outside of this range, validated by economic data or geopolitical news, will likely signal the start of a more sustained trend. Until then, caution and patience are advised, as the market awaits clarity.
Frequently Asked Questions: DXY Analysis
What happens if DXY breaks below the $100.21 support level this week?
A break below the critical $100.21 support level on a daily closing basis would invalidate the current consolidation and likely trigger a bearish move. This could see the DXY targeting the $99.93 level, with further downside potential towards $99.53 if the selling pressure intensifies due to weak economic data or a dovish Fed signal.
Should I trade the DXY at current levels of $100.70 given the conflicting RSI and MACD signals?
Trading at current levels of $100.70 is risky due to conflicting signals; RSI is neutral at 51.34 while the daily MACD shows negative momentum. A high-probability trade would require waiting for confirmation: a daily close above $100.73 for a bullish setup targeting $100.79, or a close below $100.21 for a bearish setup targeting $99.93.
Is the RSI at 51.34 a reliable indicator for DXY's direction right now?
An RSI reading of 51.34 on the daily chart is firmly in neutral territory, offering little directional conviction on its own. While it suggests neither overbought nor oversold conditions, it needs to be interpreted alongside other indicators like the MACD, which shows negative momentum, and the ADX, indicating a strong trend is possible once a direction is established.
How will the upcoming NFP report impact the DXY's price around $100.70?
The upcoming Non-Farm Payrolls (NFP) report is the most significant catalyst. A much weaker-than-expected NFP could pressure the DXY below $100.21, while a surprisingly strong report might push it towards the $100.79 resistance, contingent on the market's interpretation regarding Fed policy and future interest rates.
As we conclude this analysis of the Dollar Index (DXY) around the $100.70 level, the overarching theme is one of anticipation. The technical indicators present a mixed picture, with conflicting signals across different timeframes, suggesting a market poised for a significant move but awaiting a clear directive. The most probable scenario points towards continued consolidation with a slight bearish bias, but the upcoming economic data, particularly the NFP report, holds the key to unlocking the next directional trend. For scalpers, the range between $100.64 and $100.73 offers short-term trading opportunities, while swing traders and long-term investors are advised to wait for a decisive breakout above $100.73 or a breakdown below $100.21, backed by fundamental catalysts.
The historical context reminds us that these periods of consolidation can be brief or extended, often preceding significant trend changes. The correlations with gold, equities, and oil add further layers of complexity, requiring a holistic market view. Ultimately, disciplined risk management and patience will be the most valuable tools for navigating the DXY's path forward. Watching the key support at $100.21 and resistance at $100.73, alongside the fundamental triggers, will be crucial for making informed trading decisions in the coming week.
Technical Outlook Summary
| Indicator | Value | Signal | Interpretation |
|---|---|---|---|
| RSI (14) | 51.34 | Neutral | No clear trend on daily, slight bearish lean on 1H (56.6). |
| MACD | -0.05 | Bearish | Negative momentum on daily, below signal line. |
| Stochastic | 32.61 / 44.07 | Bearish | K |
| ADX | 27.03 | Bullish Trend | Strong trend indicated on daily, awaiting direction. |
| Bollinger Bands | Middle Band | Watch | Price below middle band on daily, indicating downward pressure. |
Key Levels
Support Levels
Resistance Levels
Track markets in real-time
AI-powered analysis, technical indicators and real-time price data.
Join Our Telegram Channel
Breaking market news, AI analysis and trading signals instantly.
Join Channel