

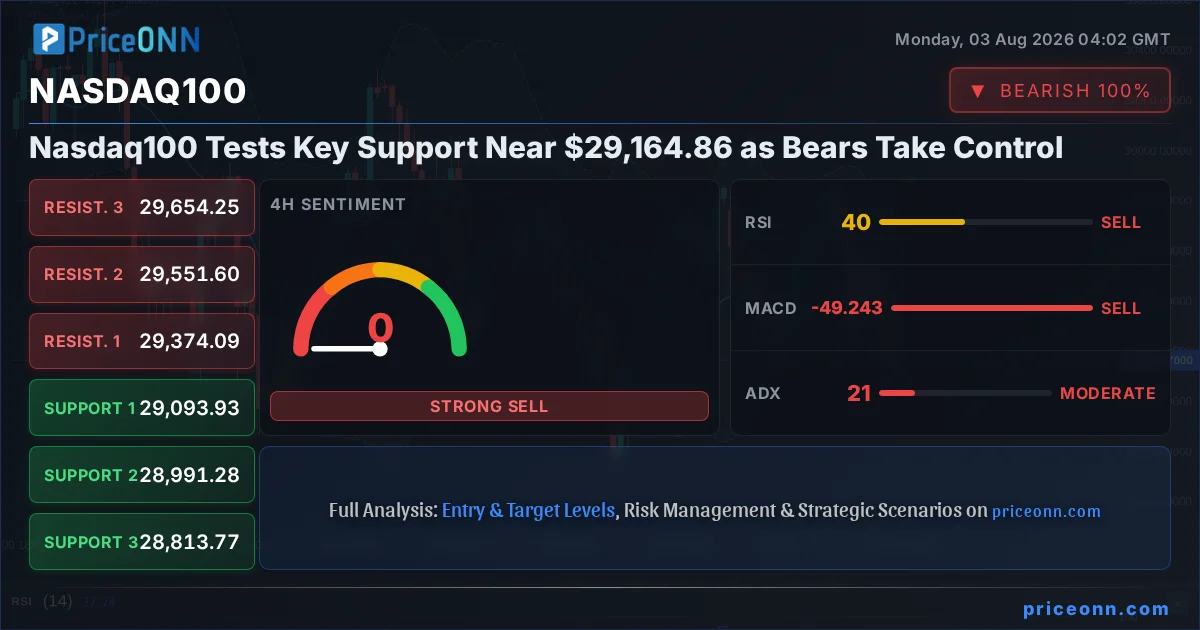
The Nasdaq100 is currently navigating a challenging landscape, trading at $29,164.86 as of August 3, 2026. This pivotal moment sees bears asserting dominance, particularly on the 1-hour and 4-hour charts, signaling a potential shift in market sentiment. While the daily trend remains technically in a downtrend, the intraday action reveals a battleground where key support levels are being tested. Understanding the nuances of these technical readings is crucial for traders looking to navigate this volatility. With the MACD histogram showing negative momentum and RSI hovering in neutral but trending downwards, the immediate pressure appears to be to the downside. This analysis delves into the technical underpinnings driving the Nasdaq100's current price action and explores the potential scenarios that lie ahead.
- RSI at 32.77 on the 1H chart indicates significant downward momentum, suggesting potential for further declines.
- The critical support level for the Nasdaq100 sits at $29,010.24, a level that has been tested in the 1-hour timeframe.
- MACD histogram shows negative momentum across 1H and 4H charts, reinforcing the bearish bias.
- Correlation with a strengthening DXY at 100.7 suggests headwinds for risk assets like the Nasdaq100.
The technical picture for the Nasdaq100 is currently dominated by bearish signals, especially when examining the shorter timeframes. On the 1-hour chart, the index is trading at $29,164.86, with the ADX at 33.23 indicating a strong downtrend is in play. This is corroborated by the MACD, which is firmly in negative territory, with its signal line below the MACD line, suggesting that selling pressure is dominant. The Relative Strength Index (RSI) at 32.77 further reinforces this sentiment; while not yet in oversold territory, it shows a clear downward trajectory, indicating that sellers are gaining the upper hand. The Stochastic oscillator, though showing a potential for a bounce with %K (30.97) above %D (20.52), is still in a bearish configuration and has not yet crossed into oversold territory, suggesting any immediate upward movement might be short-lived. This confluence of indicators on the 1-hour chart paints a picture of caution for bulls.
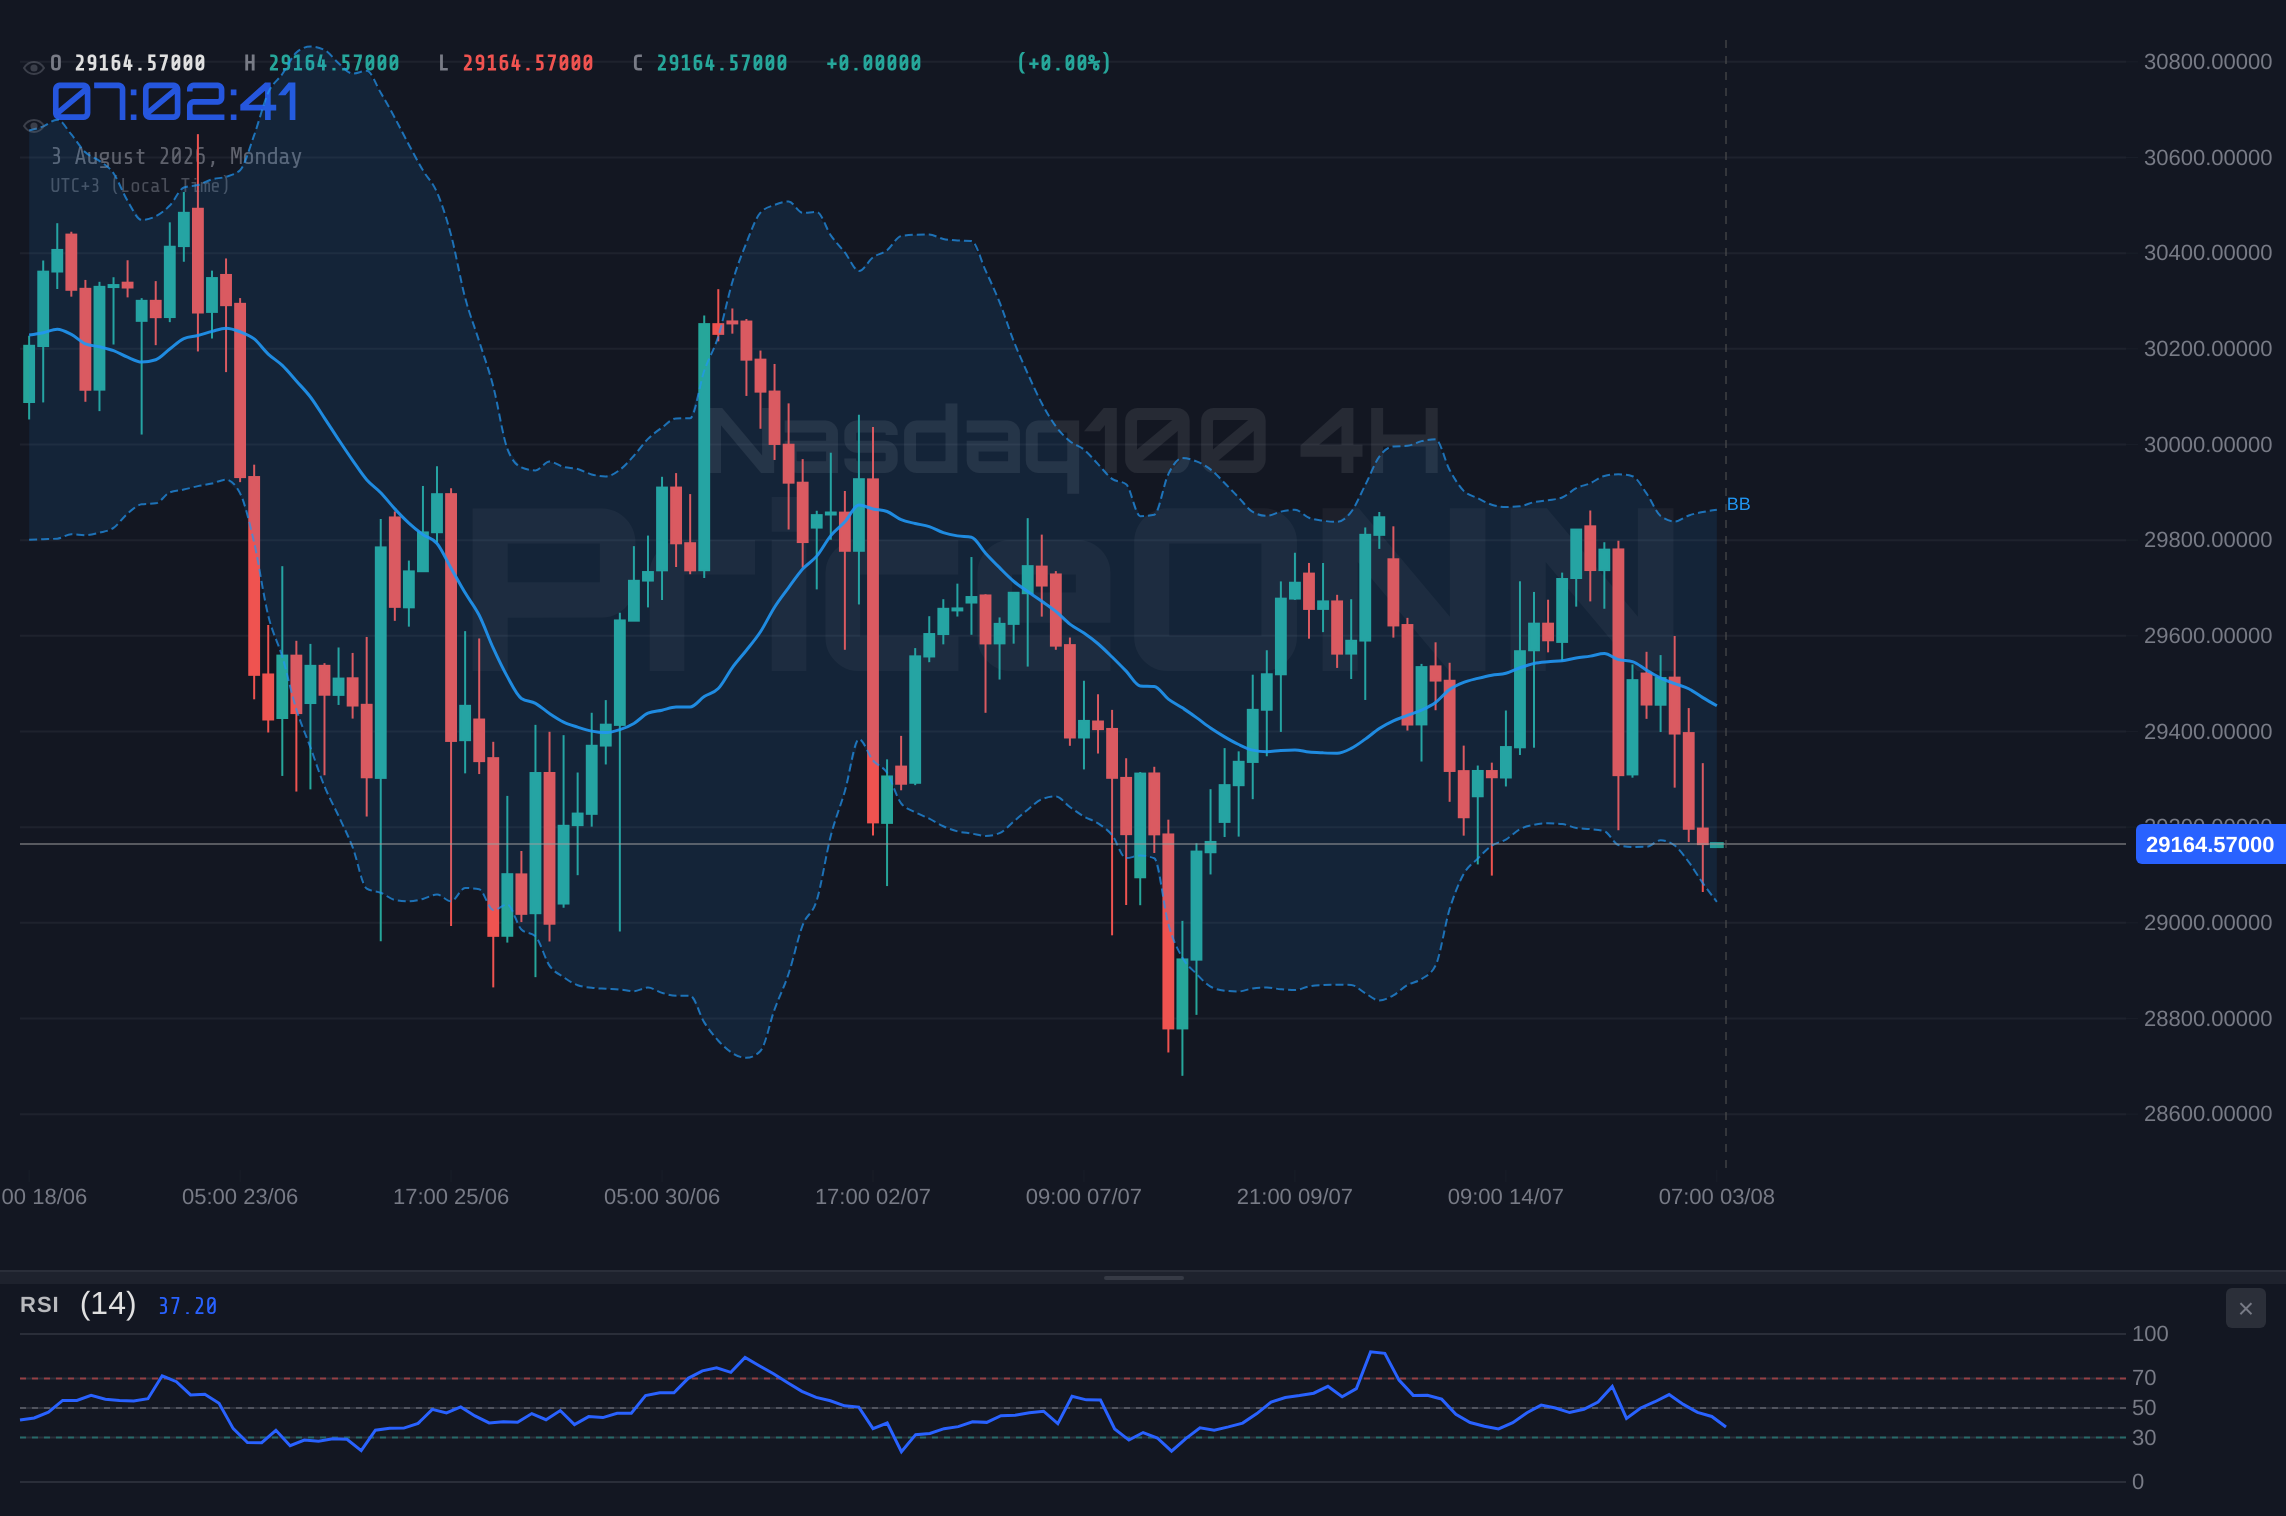
Delving into the 4-hour timeframe, the bearish sentiment for the Nasdaq100 persists, albeit with slightly less conviction in the trend strength compared to the 1-hour chart. The ADX reading of 21.06 suggests a moderately strong downtrend, which aligns with the negative MACD momentum. The RSI at 39.92 continues to hover in neutral territory but leans towards the bearish side, indicating room for further downside before becoming oversold. The Stochastic oscillator here is more definitively bearish, with %K (15.62) well below %D (35.37) and heading lower, pointing towards continued selling pressure. The Bollinger Bands are also showing the price trading below the middle band, which often acts as a short-term resistance level. This 4-hour perspective consolidates the bearish outlook seen on the hourly chart, suggesting that the broader intraday trend is indeed downward.
The daily chart, however, presents a more complex narrative for the Nasdaq100. While the overall trend strength, measured by ADX at 15.12, is weak and suggests a potentially consolidating market, the MACD is currently showing negative momentum with the MACD line below its signal line. This might seem contradictory to the weak trend strength, but it often indicates that a downtrend is losing steam or that the market is preparing for a significant move. The RSI at 46.36 is in neutral territory, but its slight downward tilt hints at potential weakness. Conversely, the Stochastic oscillator shows a bullish signal with %K (58.96) crossing above %D (53.46), suggesting that buyers might be looking to step in. The Bollinger Bands are positioned below the middle band, reinforcing the bearish lean of the daily timeframe. This divergence between the MACD and Stochastic on the daily chart highlights the current indecision and the importance of key support and resistance levels.
The Dollar Index (DXY), a key correlated asset, is currently trading at 100.7, showing a notable increase of 0.21% on the day. This strengthening dollar often acts as a headwind for risk assets like the Nasdaq100, as it increases the cost of holding non-dollar denominated assets and can signal a global flight to safety. The DXY's upward momentum on the 1-hour chart, with RSI at 56.6 and Stochastic in the overbought region, suggests that the dollar might continue to find strength, potentially adding further pressure on the Nasdaq100. On the 4-hour chart, however, the DXY shows a bearish divergence with RSI at 46.15 and Stochastic showing a rising signal, indicating potential for dollar weakness ahead. This mixed picture from the DXY adds another layer of complexity to the Nasdaq100's outlook, as the correlation could shift.
Looking at the broader equity markets provides further context. The S&P 500 is showing a mixed picture, trading up 0.74% on the day at 6572.87, indicating some resilience in the broader market. However, its 1-hour chart shows RSI at 70.95, nearing overbought territory, and a bearish Stochastic signal. The ADX at 49.72 shows a strong uptrend on the 1-hour, but this is contrasted by the daily chart's bearish trend signal with ADX at 47.51. The Nasdaq 100's sibling, the Dow Jones 30, is currently trading higher by 0.21% at 52748.53, with a generally bullish technical setup across timeframes, particularly on the 1-hour and 4-hour charts. This divergence between the major indices - with the Nasdaq showing more pronounced weakness - suggests that specific sector rotations or tech-heavy valuations might be at play, impacting the Nasdaq100 more severely.
The crucial support levels for the Nasdaq100 are currently being tested. On the 1-hour timeframe, the immediate support lies at $29,392.67, followed by $29,327.24 and $29,260.86. A break below these levels would confirm the bearish bias indicated by intraday indicators. On the 4-hour chart, the support cluster is found at $29,093.93, $28,991.28, and $28,813.77. These levels represent more significant psychological and technical barriers. A decisive close below $29,010.24, a key support level identified on the 1-hour chart, would likely trigger further selling pressure. Conversely, resistance is faced at $29,386.17, $29,551.60, and $29,848.39, which would need to be overcome for any significant bullish reversal to take hold.
Given the current technical indicators and price action, the primary trade recommendation leans towards a bearish outlook, at least in the short to medium term. The confluence of negative MACD momentum, RSI trending lower, and the prevailing downtrend on the 1-hour and 4-hour charts presents a compelling case for downside potential. The ADX readings confirm that a strong trend is in motion, making it difficult for bulls to establish a solid foothold without significant catalyst. The strengthening dollar and the mixed signals from other equity indices further support a cautious approach. However, the divergence on the daily chart, particularly the bullish Stochastic signal, warrants attention. Any break of key resistance levels, especially above $29,386.17, could invalidate the bearish thesis and signal a shift in momentum.
Bearish Scenario: Sellers Consolidate Control
70% ProbabilityNeutral Scenario: Consolidation Around Key Levels
20% ProbabilityBullish Scenario: Unexpected Reversal
10% ProbabilityThe weak trend strength on the daily chart (ADX 15.12) and the bullish Stochastic signal cannot be entirely ignored. These elements suggest that while the immediate pressure is downward, the market might be setting up for a reversal or a period of consolidation. Traders should remain vigilant for any signs of a trend change or confirmation of continued downside. The interplay between the strengthening dollar and the performance of other equity indices will be critical to monitor. Any significant shift in Fed policy expectations, or unexpected economic data, could quickly alter the current bearish narrative. For now, the path of least resistance appears to be lower, but the market has a habit of surprising those who become too complacent.
Historically, periods of high volatility like we are currently experiencing often follow significant price movements. The Nasdaq100 has seen substantial gains in recent history, and a healthy correction or consolidation is a natural part of market cycles. The RSI at 32.77 on the 1H chart suggests that the index is approaching oversold conditions, which could precede a bounce. However, with the MACD histogram firmly negative and the ADX indicating a strong trend, this bounce might be short-lived or merely a retracement within a larger downtrend. The key will be whether the index can reclaim the middle Bollinger Band on the 4-hour chart, which currently sits around $29,260, and hold above the critical $29,010 support level. A failure to do so would likely confirm the bears' advantage.
The correlation with oil prices, currently seeing Brent at $83.79 and WTI at $79.59, also adds an inflationary undertone to market sentiment. While the Nasdaq100 is not directly tied to oil prices, sustained high energy costs can impact corporate margins and consumer spending, potentially weighing on tech stocks. The news of potential intervention rumors affecting the Japanese Yen and the ongoing trade tensions highlighted by Trump's actions on Spain's energy security, though seemingly distant, contribute to a broader global risk-off sentiment. This sentiment often favors safe-haven assets and can put pressure on growth-oriented indices like the Nasdaq100, especially when the dollar is also showing strength.
The current market structure suggests that liquidity might be a key factor. With several indicators showing conflicting signals across different timeframes - bullish Stochastic on the daily versus bearish MACD, for instance - it implies that the market is in a state of flux. This can lead to increased volatility and potential 'stop hunts' as larger players test key levels. Traders should be employing strict risk management strategies, perhaps utilizing tighter stop-losses on any bearish positions taken, and waiting for clear confirmation before entering new trades. The risk/reward ratio for entering long positions currently appears unfavorable given the prevailing bearish signals on shorter timeframes.
For those looking to trade the Nasdaq100, patience will be key. The conflicting signals across timeframes suggest that the market is searching for direction. A break below the $29,010.24 support level could initiate a more aggressive sell-off, targeting the $28,991.28 and $28,813.77 levels on the 4-hour chart. Conversely, a sustained move above the $29,386.17 resistance, ideally accompanied by increasing volume and a shift in RSI above 50, would signal a potential short-covering rally, possibly targeting the $29,551.60 and $29,848.39 resistance levels. The neutral scenario, where the index consolidates between $29,010 and $29,386, also remains a distinct possibility given the divergence in daily indicators.
The overall outlook for the Nasdaq100 remains cautious, with immediate downside pressure evident. The technical indicators, particularly on the 1-hour and 4-hour charts, strongly favor bearish sentiment. The strengthening dollar and the broader market context of potential inflation add to these concerns. However, the presence of bullish signals on the daily Stochastic and the weak trend strength on the daily ADX suggest that a reversal or consolidation cannot be ruled out. Traders should pay close attention to the key support at $29,010.24 and resistance at $29,386.17 as the immediate battlegrounds. Any decisive move through these levels, confirmed by volume and other indicators, will likely dictate the next significant price action. The market is currently at a crossroads, and the coming sessions will be critical in determining the short-term direction.
Frequently Asked Questions: Nasdaq100 Analysis
What happens if the Nasdaq100 breaks below the 1H support at $29,010.24?
A close below $29,010.24 on the 1-hour chart would validate the current bearish sentiment, potentially triggering further declines. This could lead to price action testing the next significant support level at $28,991.28 on the 4-hour chart.
Should I consider shorting the Nasdaq100 at current levels of $29,164.86 given the bearish signals?
Given the strong bearish signals on the 1H and 4H charts, shorting could be considered if risk is managed carefully. However, the bullish Stochastic on the daily chart and weak ADX suggest caution is warranted. A confirmed break below $29,010.24 would offer a clearer short entry with defined risk.
Is the RSI at 32.77 on the 1H chart a sell signal for the Nasdaq100 right now?
An RSI of 32.77 on the 1-hour chart indicates significant downward momentum but is not yet in oversold territory. While it suggests bearish pressure, it's more of a confirmation of existing weakness rather than an immediate sell signal on its own. Further confirmation from price action and other indicators like MACD is advisable.
How will the strengthening DXY at 100.7 affect the Nasdaq100 this week?
A strengthening DXY typically exerts downward pressure on risk assets like the Nasdaq100. With the DXY at 100.7 and showing upward momentum, it suggests potential headwinds for the index. This correlation could exacerbate any existing sell-off in the Nasdaq100, especially if the dollar continues its ascent.
| Indicator | Value | Signal | Interpretation |
|---|---|---|---|
| RSI (14) | 32.77 | Bearish | Downtrend confirmed, approaching oversold |
| MACD Histogram | -15.20 | Bearish | Negative momentum increasing |
| Stochastic | K=30.97, D=20.52 | Neutral | Potential for bounce, but trend remains weak |
| ADX | 33.23 | Bearish | Strong downtrend in progress |
| Bollinger Bands | Middle Band Test | Bearish | Price below middle band, resistance |
Track markets in real-time
AI-powered analysis, technical indicators and real-time price data.
Join Our Telegram Channel
Breaking market news, AI analysis and trading signals instantly.
Join Channel