

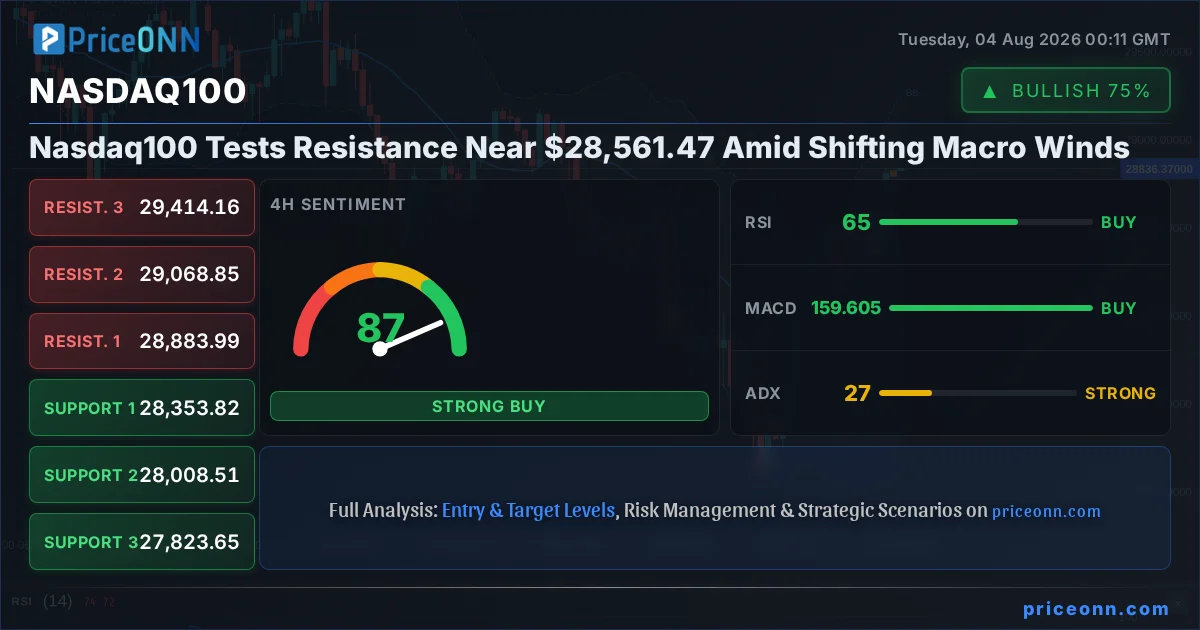
The Nasdaq100 is currently navigating a critical juncture, hovering near the resistance level of $28,561.47. This pivotal area comes into focus as market participants digest a complex interplay of shifting macroeconomic expectations, central bank policy signals, and ongoing inflation concerns. While the index has shown resilience, the path forward hinges on its ability to decisively break through current headwinds or face a potential pullback. Understanding the underlying drivers behind this price action is paramount for traders and investors seeking to position themselves effectively in the current market environment.
- The Nasdaq100 is currently trading near the $28,561.47 resistance level, with the immediate price action suggesting caution.
- With RSI at 72.31 on the 1H chart, the index is showing signs of overbought pressure, hinting at potential consolidation or a short-term pullback.
- Critical support for the Nasdaq100 is identified at $27,917.19, a level that, if broken, could signal a deeper correction.
- Fed rate expectations, influenced by upcoming inflation data, are a key driver, creating a correlation with the Dollar Index (DXY), currently around 100.01.
Macroeconomic Crosscurrents Shaping the Nasdaq100
The Federal Reserve's Tightrope Walk
The Federal Reserve's monetary policy remains a dominant theme influencing equity markets, and the Nasdaq100 is no exception. Recent signals from Fed officials suggest a cautious approach, balancing the need to curb inflation with the desire to avoid triggering a significant economic downturn. While the market has priced in a certain path for interest rates, any deviation from these expectations - whether through hawkish rhetoric or a shift in inflation outlook - can cause substantial price swings. For instance, if upcoming inflation data proves stickier than anticipated, the Fed might be compelled to maintain a tighter monetary stance for longer, which typically weighs on growth-oriented indices like the Nasdaq100. Conversely, signs of cooling inflation could pave the way for a more dovish outlook, potentially reigniting bullish sentiment and supporting further upside for the index. The current DXY level around 100.01 is a testament to the dollar's strength, often inversely correlated with major equity indices, suggesting that a strong dollar environment could continue to be a headwind.
The market's interpretation of the Fed's next move is finely tuned to incoming economic data. Inflation figures, employment reports, and manufacturing surveys all serve as crucial inputs for policy decisions. The CME FedWatch tool, while not explicitly provided here, is a key barometer for market expectations. Any indication that inflation is not on a clear path back to the 2% target could lead to a repricing of rate cut expectations, potentially creating volatility. This uncertainty is a double-edged sword; it can lead to sharp sell-offs if the data disappoints but also provides opportunities for strategic entries if the market overreacts to short-term data points. The current market sentiment reflects this delicate balance, with investors closely monitoring every utterance from Fed officials and every piece of economic data released.
Inflationary Pressures and Growth Concerns
The persistent threat of inflation continues to cast a shadow over economic growth prospects. While headline inflation figures might show some moderation, the underlying core inflation trends remain a key focus for policymakers and market participants alike. High energy prices, as seen with Brent crude around $83.03 and WTI at $81.08, can directly impact consumer spending and corporate costs, potentially slowing economic activity. This is where the correlation between energy prices and broader market sentiment becomes critical. A sustained rise in oil prices, for example, could reignite inflation fears, prompting tighter monetary policy and dampening the outlook for growth stocks. The recent price action in oil, showing a notable daily drop, suggests some easing of immediate inflationary pressures, but the overall trend and geopolitical risks in energy-producing regions remain a factor to watch.
The interplay between inflation and growth is complex. A scenario where inflation remains elevated while economic growth falters - stagflation - is particularly concerning for equity markets. Growth stocks, which form the backbone of the Nasdaq100, are typically more sensitive to economic slowdowns as their valuations are often based on future earnings potential. Therefore, any data suggesting a significant deceleration in GDP growth or a weakening of key economic indicators like PMI surveys would likely trigger a reassessment of the Nasdaq100's current valuation. The current upward trend in SP500 and Nasdaq100 might be masking underlying vulnerabilities if these growth concerns escalate. The ADX at 29.59 for Brent suggests a weakening trend, which could ease some inflationary fears, but the overall economic picture is what truly matters.
Technical Landscape: Navigating Key Levels
Short-Term Momentum and Overbought Signals
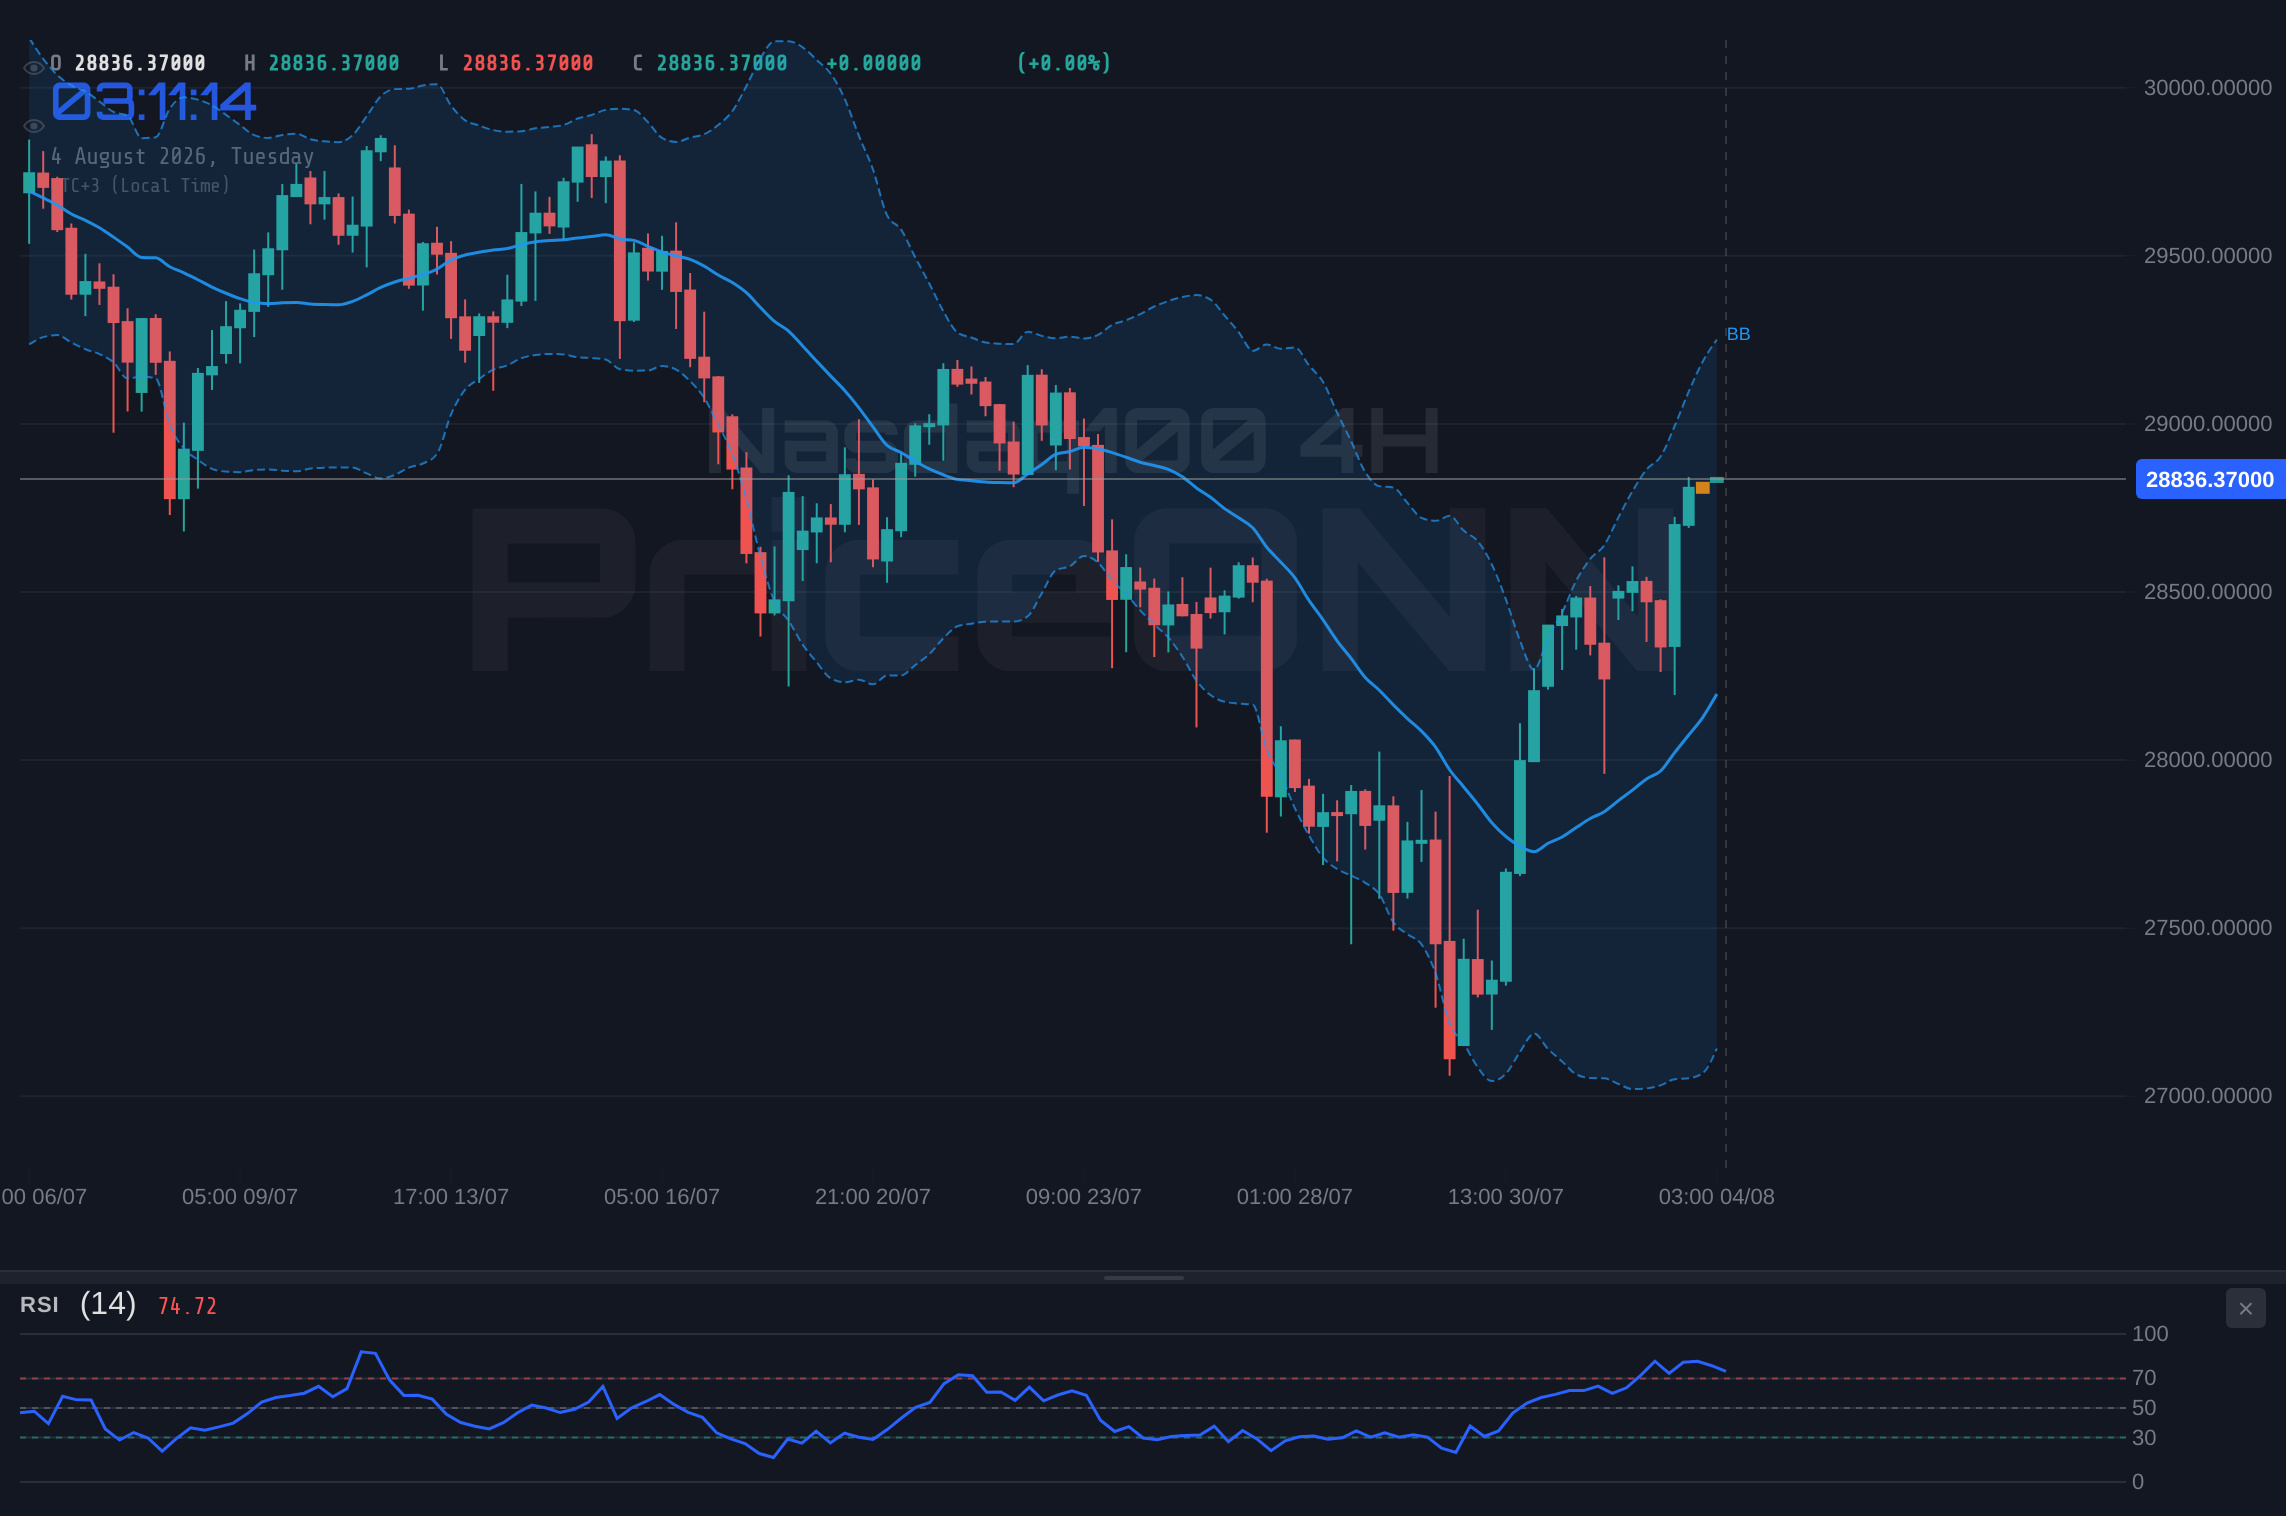
On the 1-hour timeframe, the Nasdaq100 is exhibiting signs of overbought conditions, a classic signal that requires careful interpretation. The Relative Strength Index (RSI) at 72.31 suggests that the recent upward momentum may be losing steam, potentially leading to a period of consolidation or a minor pullback. This is further supported by the Stochastic indicator, where the %K line at 97.04 and the %D line at 94.97 are both deep in overbought territory, signaling a potential reversal or at least a pause in the rally. The MACD, while showing positive momentum, is on the verge of crossing its signal line, which could indicate a short-term shift in trend. The ADX at 29.59 suggests a strong uptrend is in place, but the confluence of high RSI and Stochastic readings warrants caution for immediate aggressive long positions.
The immediate resistance level to watch on the 1-hour chart is around $28,847.64, with further significant resistance identified at $28,866.41 and $28,887.69. A sustained break above these levels would be necessary to confirm a continuation of the bullish trend. Conversely, the support levels at $28,807.59, $28,786.31, and $28,767.54 are crucial for holding any short-term gains. A failure to hold these support levels could lead to a test of lower prices, especially if broader market sentiment shifts due to macroeconomic news. The Bollinger Bands on the 1H chart are currently above the middle band, indicating an upward bias, but the proximity to the upper band combined with the overbought indicators suggests that the market might be stretched in the short term.
Mid-Term Outlook: A Battle for Control
Shifting to the 4-hour timeframe, the picture becomes more nuanced. The Nasdaq100's trend is neutral, with a moderate strength of 50%, suggesting a period of consolidation or indecision. Resistance levels are clearly defined at $28,883.99, $29,068.85, and $29,414.16. These are the zones where selling pressure is expected to intensify if the price reaches them. The RSI at 64.77 is in the higher neutral zone, indicating upward momentum but not yet in extreme overbought territory. The MACD is showing positive momentum, and the Stochastic lines (K=85.22, D=83.19) are in overbought territory, again hinting at potential consolidation. The ADX at 26.98 suggests a strong uptrend, which is somewhat contradictory to the neutral trend overall, indicating that while a trend exists, its commitment is not absolute.
Support levels on the 4-hour chart are noted at $28,353.82, $28,008.51, and $27,823.65. A break below the $28,353.82 level could signal a shift towards the bearish scenario, especially if it coincides with negative macroeconomic news. The Bollinger Bands are positioned above the middle band, reinforcing the existing upward bias on this timeframe. The divergence between the strong ADX and the neutral trend strength indicates that while there is directional movement, it might be facing significant challenges at higher price points. This suggests that the price could be range-bound between the key support and resistance levels mentioned, requiring a decisive catalyst to break out in either direction.
Daily Perspective: Downside Risks Loom
The daily chart presents a more bearish outlook, with a strong downtrend signal (Power: 100%) and an ADX of 47.51 indicating a powerful downward trend. The current price is trading below the middle Bollinger Band, reinforcing this bearish sentiment. Key resistance levels on the daily chart are at $28,561.47, $28,605.07, and $28,685.83. A break above $28,561.47 is crucial for any bullish argument to gain traction. The RSI at 45.35 is in neutral territory but trending downwards, aligning with the bearish bias. The MACD is showing negative momentum, with the histogram below zero and the MACD line below the signal line, further confirming the bearish pressure.
Support levels on the daily chart are significantly lower, starting at $27,917.19, followed by $27,615.99 and $27,272.91. The Stochastic indicator (K=42.97, D=29.88) is showing a bullish signal (%K > %D), which contradicts the overall bearish trend and RSI reading. This divergence suggests that while the larger trend is down, there might be short-term buying interest emerging from oversold conditions, or it could be a signal of weakening bearish momentum. However, the strong ADX and the price's position below the daily middle Bollinger Band indicate that the downside risks are more pronounced. Any failure to overcome the immediate resistance levels could see the Nasdaq100 testing these lower support zones, especially if broader market sentiment turns risk-off, potentially correlating with a strengthening DXY around 100.01.
Fundamental Drivers and Market Correlations
Central Bank Policy: The Fed's Next Move
The Federal Reserve's monetary policy decisions remain the most significant fundamental driver for the Nasdaq100. As the market digests the possibility of future rate hikes or prolonged periods of high rates, the correlation between the Nasdaq100 and the Dollar Index (DXY) becomes increasingly important. With the DXY currently trading around 100.01, a strengthening dollar often exerts downward pressure on global equities, particularly growth-sensitive sectors represented by the Nasdaq100. If the Fed signals a more hawkish stance, perhaps due to persistent inflation data, we could see the DXY climb further, creating a challenging environment for the Nasdaq100. Conversely, any hint of a dovish pivot or a pause in rate hikes could weaken the dollar and provide a tailwind for the index. Investors are keenly awaiting upcoming economic data releases, such as inflation reports (CPI, PCE) and employment figures (NFP), to gauge the Fed's likely trajectory.
The market's reaction to economic data is often amplified by the current liquidity conditions and the broader risk appetite. For example, a surprisingly strong Non-Farm Payrolls (NFP) report, if it suggests an overheating economy, could paradoxically lead to a sell-off in equities if it implies the Fed will maintain higher rates for longer. This intricate relationship highlights the need for a nuanced approach, moving beyond simple correlations. The current upward trend in indices like the SP500 (at 6572.87) and Nasdaq100 suggests that, for now, the market may be discounting the Fed's hawkish potential or perhaps anticipating a 'soft landing' scenario where inflation is controlled without a severe economic contraction. However, the ADX values across different timeframes for the Nasdaq100 indicate varying trend strengths, underscoring the ongoing battle between bullish and bearish forces.
Geopolitical Landscape and Risk Sentiment
Geopolitical tensions continue to be a significant, albeit often unpredictable, factor influencing market sentiment and, consequently, the Nasdaq100. Events such as trade disputes, regional conflicts, or significant political shifts can trigger 'risk-off' sentiment, leading investors to seek safe-haven assets. In such scenarios, assets like gold (XAUUSD at 4061.05) and the US Dollar (DXY at 100.01) tend to strengthen, while growth-oriented equities may face selling pressure. The recent news regarding oil prices, with Brent at $83.03 and WTI at $81.08, shows some recent decline but the underlying geopolitical risks in energy markets remain a constant concern, potentially impacting inflation expectations and central bank policy. Any escalation of these tensions could swiftly shift market dynamics, leading to increased volatility across all asset classes.
The correlation between major equity indices like the SP500 and Nasdaq100, and their relationship with broader market risk appetite, is a key aspect of fundamental analysis. Currently, both SP500 (at 6572.87) and Nasdaq100 (at 28,848.44) are showing upward trends on shorter timeframes, suggesting a degree of risk-on sentiment. However, the daily charts present a more cautious picture, with the Nasdaq100 exhibiting a strong downtrend signal. This divergence highlights the importance of multi-timeframe analysis. If geopolitical risks were to escalate significantly, we would expect to see a clear 'risk-off' move: a rise in the DXY, a fall in equity indices, and potentially a surge in safe-haven assets. The current situation, while showing upward momentum in equities, is underpinned by a cautious macro backdrop that could quickly turn negative.
Navigating the Current Market Tension
The Bullish Case: Breaking Through
For the Nasdaq100 to continue its upward trajectory, it must first overcome the immediate resistance cluster. The 1-hour chart shows resistance at $28,847.64, $28,866.41, and $28,887.69. A decisive close above this zone, particularly above $28,887.69, would be a strong bullish signal, potentially invalidating the short-term overbought conditions indicated by the RSI at 72.31. Confirmation would come from sustained buying volume and a subsequent hold of the $28,800-$28,700 area as support. If this breakout occurs, the next logical targets would be the 4-hour resistance levels, starting with $29,068.85 and potentially pushing towards $29,414.16. Such a move would likely be fueled by positive macroeconomic news, such as cooler-than-expected inflation data or a dovish signal from the Federal Reserve, which could also lead to a weakening of the DXY around 100.01.
The bullish scenario hinges on the market's ability to absorb selling pressure around the current resistance levels and the conviction that the Federal Reserve will eventually pivot towards a more accommodative stance. Historically, periods of consolidation after significant rallies can set the stage for the next leg up, provided the underlying economic fundamentals remain supportive. The strong ADX readings on the 1-hour and 4-hour charts, despite some conflicting signals, suggest that underlying bullish momentum could reassert itself if key resistance levels are decisively breached. The key takeaway here is that a sustained break above $28,887.69 is required to validate this bullish outlook and open the door for further gains.
The Bearish Case: Resistance Holds Firm
The more probable scenario, given the daily chart's strong downtrend signal and the immediate overbought conditions on the 1-hour chart, is that the Nasdaq100 will struggle to break through the current resistance. If the index fails to decisively move past $28,887.69, we could see a reversal, with sellers stepping in. The immediate support levels to watch would be $28,807.59 and $28,786.31 on the 1-hour chart. A break below $28,767.54 would signal further downside potential, targeting the 4-hour support at $28,353.82. The ultimate confirmation of this bearish outlook would be a close below the daily support level of $27,917.19. This scenario would likely be triggered by hawkish commentary from the Fed, higher-than-expected inflation data, or a significant geopolitical event that increases risk aversion, leading to a stronger DXY.
The divergence between the short-term overbought indicators (RSI 72.31, Stochastic K=97.04) and the longer-term bearish trend on the daily chart is a significant warning sign. This suggests that the recent rally might be a 'dead cat bounce' or a temporary correction within a larger downtrend. The strong ADX of 47.51 on the daily chart reinforces the idea that bearish momentum is dominant. If resistance holds, traders might look to short rallies, targeting the support levels mentioned. The current price action near $28,848.44, coupled with the conflicting signals across timeframes, indicates a market at a crossroads, but the weight of evidence from the daily chart leans towards potential downside.
Consolidation and Indecision
A neutral scenario suggests that the Nasdaq100 might enter a period of consolidation, trading within a defined range as market participants await clearer direction from macroeconomic data or central bank policy. On the 4-hour chart, the trend is neutral, and the price could oscillate between the support at $28,353.82 and the resistance at $28,883.99. This could be a result of conflicting signals: short-term overbought conditions battling against longer-term bearish trends, or positive equity sentiment being capped by hawkish Fed expectations. In this environment, volatility might decrease, and traders would look for clear breakouts from the established range.
During consolidation, the ADX values tend to be lower, reflecting a lack of strong directional trend. The current ADX readings vary across timeframes, but the overall picture suggests that while trends exist, they are not always decisive. This phase can be challenging for trend-following strategies but can offer opportunities for range-trading strategies. The key for this scenario is the price action remaining within the defined support and resistance boundaries. A break decisively above $28,883.99 would lean towards the bullish scenario, while a drop below $28,353.82 would favor the bearish outlook. Until then, expect choppy price action as the market digests incoming information.
Looking Ahead: What's Next for the Nasdaq100?
The immediate future for the Nasdaq100 will likely be dictated by its ability to contend with the resistance near $28,561.47 and the broader macroeconomic narrative. Key upcoming economic events, such as inflation reports and Federal Reserve statements, will be critical in shaping market expectations regarding monetary policy. Traders will be closely watching the DXY's reaction to these events, as its movement often provides a leading indicator for risk assets. The current divergence in technical signals across different timeframes - overbought conditions on the 1-hour chart contrasting with a bearish daily trend - suggests that caution is warranted. A decisive move above the $28,887.69 resistance is needed to signal a continuation of the bullish trend, while a break below the $27,917.19 support would confirm the downside risks.
The market is at a critical juncture, where fundamental drivers and technical levels are in a tug-of-war. The Nasdaq100's performance will depend on whether the bulls can overcome the immediate resistance and macroeconomic headwinds, or if the bears will capitalize on the bearish signals present on the longer timeframes. Investors and traders must remain vigilant, manage their risk exposure, and wait for clear confirmation before committing to significant positions. The ability to navigate these complex market conditions will be key to success in the coming sessions.
Frequently Asked Questions: Nasdaq100 Analysis
What happens if Nasdaq100 breaks above the $28,887.69 resistance level?
A decisive break above $28,887.69 would invalidate short-term overbought signals and could trigger a move towards the 4-hour resistance at $29,068.85. This would likely be supported by positive inflation data or dovish Fed signals, potentially weakening the DXY.
Should I consider buying Nasdaq100 at current levels near $28,848.44 given the RSI at 72.31?
Buying at current levels with RSI at 72.31 on the 1H chart carries risk due to overbought conditions. A more prudent approach would be to wait for a pullback to support levels like $28,353.82 or confirmation of a clear breakout above $28,887.69.
Is the MACD showing a bearish signal for Nasdaq100 on the daily chart?
Yes, on the daily chart, the MACD is showing negative momentum with the histogram below zero and the MACD line below its signal line. This aligns with the overall bearish trend indicated by the ADX at 47.51.
How will upcoming inflation data affect Nasdaq100 this week?
Higher-than-expected inflation could prompt a hawkish response from the Fed, potentially strengthening the DXY and pressuring the Nasdaq100 towards its daily support at $27,917.19. Conversely, cooler inflation might lead to a dovish reassessment, supporting a rally above $28,887.69.
Track markets in real-time
AI-powered analysis, technical indicators and real-time price data.
Join Our Telegram Channel
Breaking market news, AI analysis and trading signals instantly.
Join Channel