

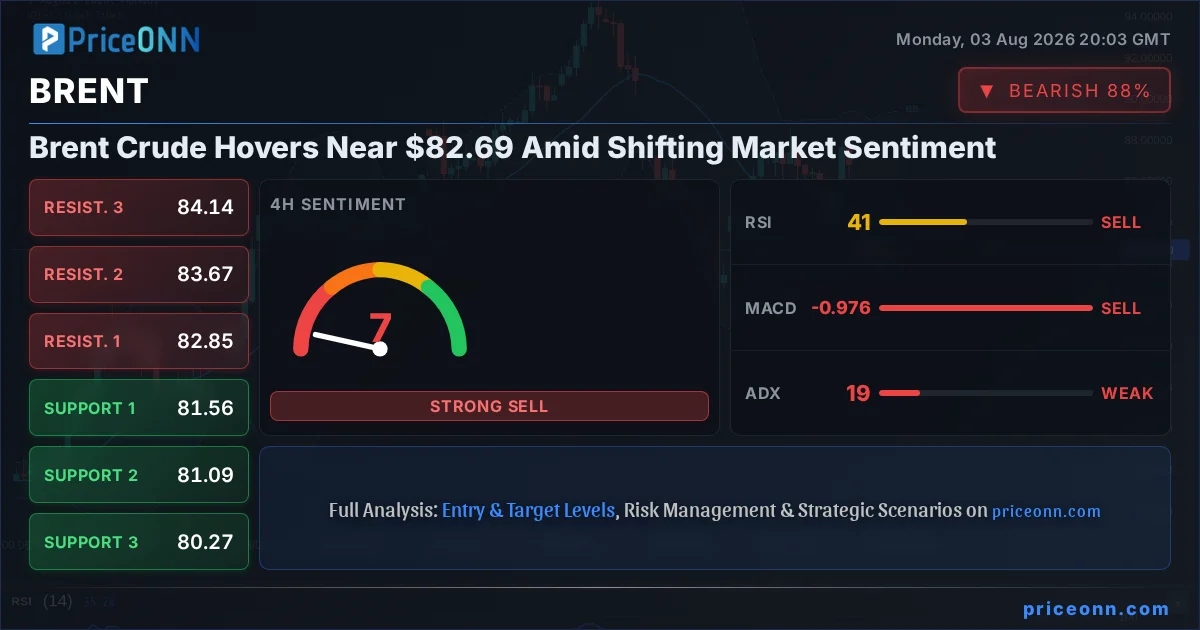
Brent crude is currently trading around $82.69, a price point that demands close attention after a significant intraday pullback. The energy market has been a focal point for macroeconomic analysis, with recent price action suggesting a complex interplay between supply dynamics, inflation expectations, and global demand signals. As traders digest the latest movements, understanding the underlying technical and fundamental forces is paramount for navigating the volatility ahead. This analysis delves into the current technical landscape of Brent crude, examining key indicators and price levels that are shaping market expectations.
- Brent crude is trading near $82.69, down significantly from recent highs as market sentiment shifts.
- The RSI at 42.27 indicates a neutral but leaning bearish momentum, suggesting room for further downside before oversold conditions appear.
- Key support is firmly established at $82.19, while resistance looms at $88.19, defining the immediate trading range.
- The ADX at 23.28 points to a moderate downtrend, implying that the current price action is not merely a blip but part of a developing trend.
Navigating the Brent Crude Landscape: A Technical Perspective
The 1-Hour Chart: Immediate Price Action Under Scrutiny
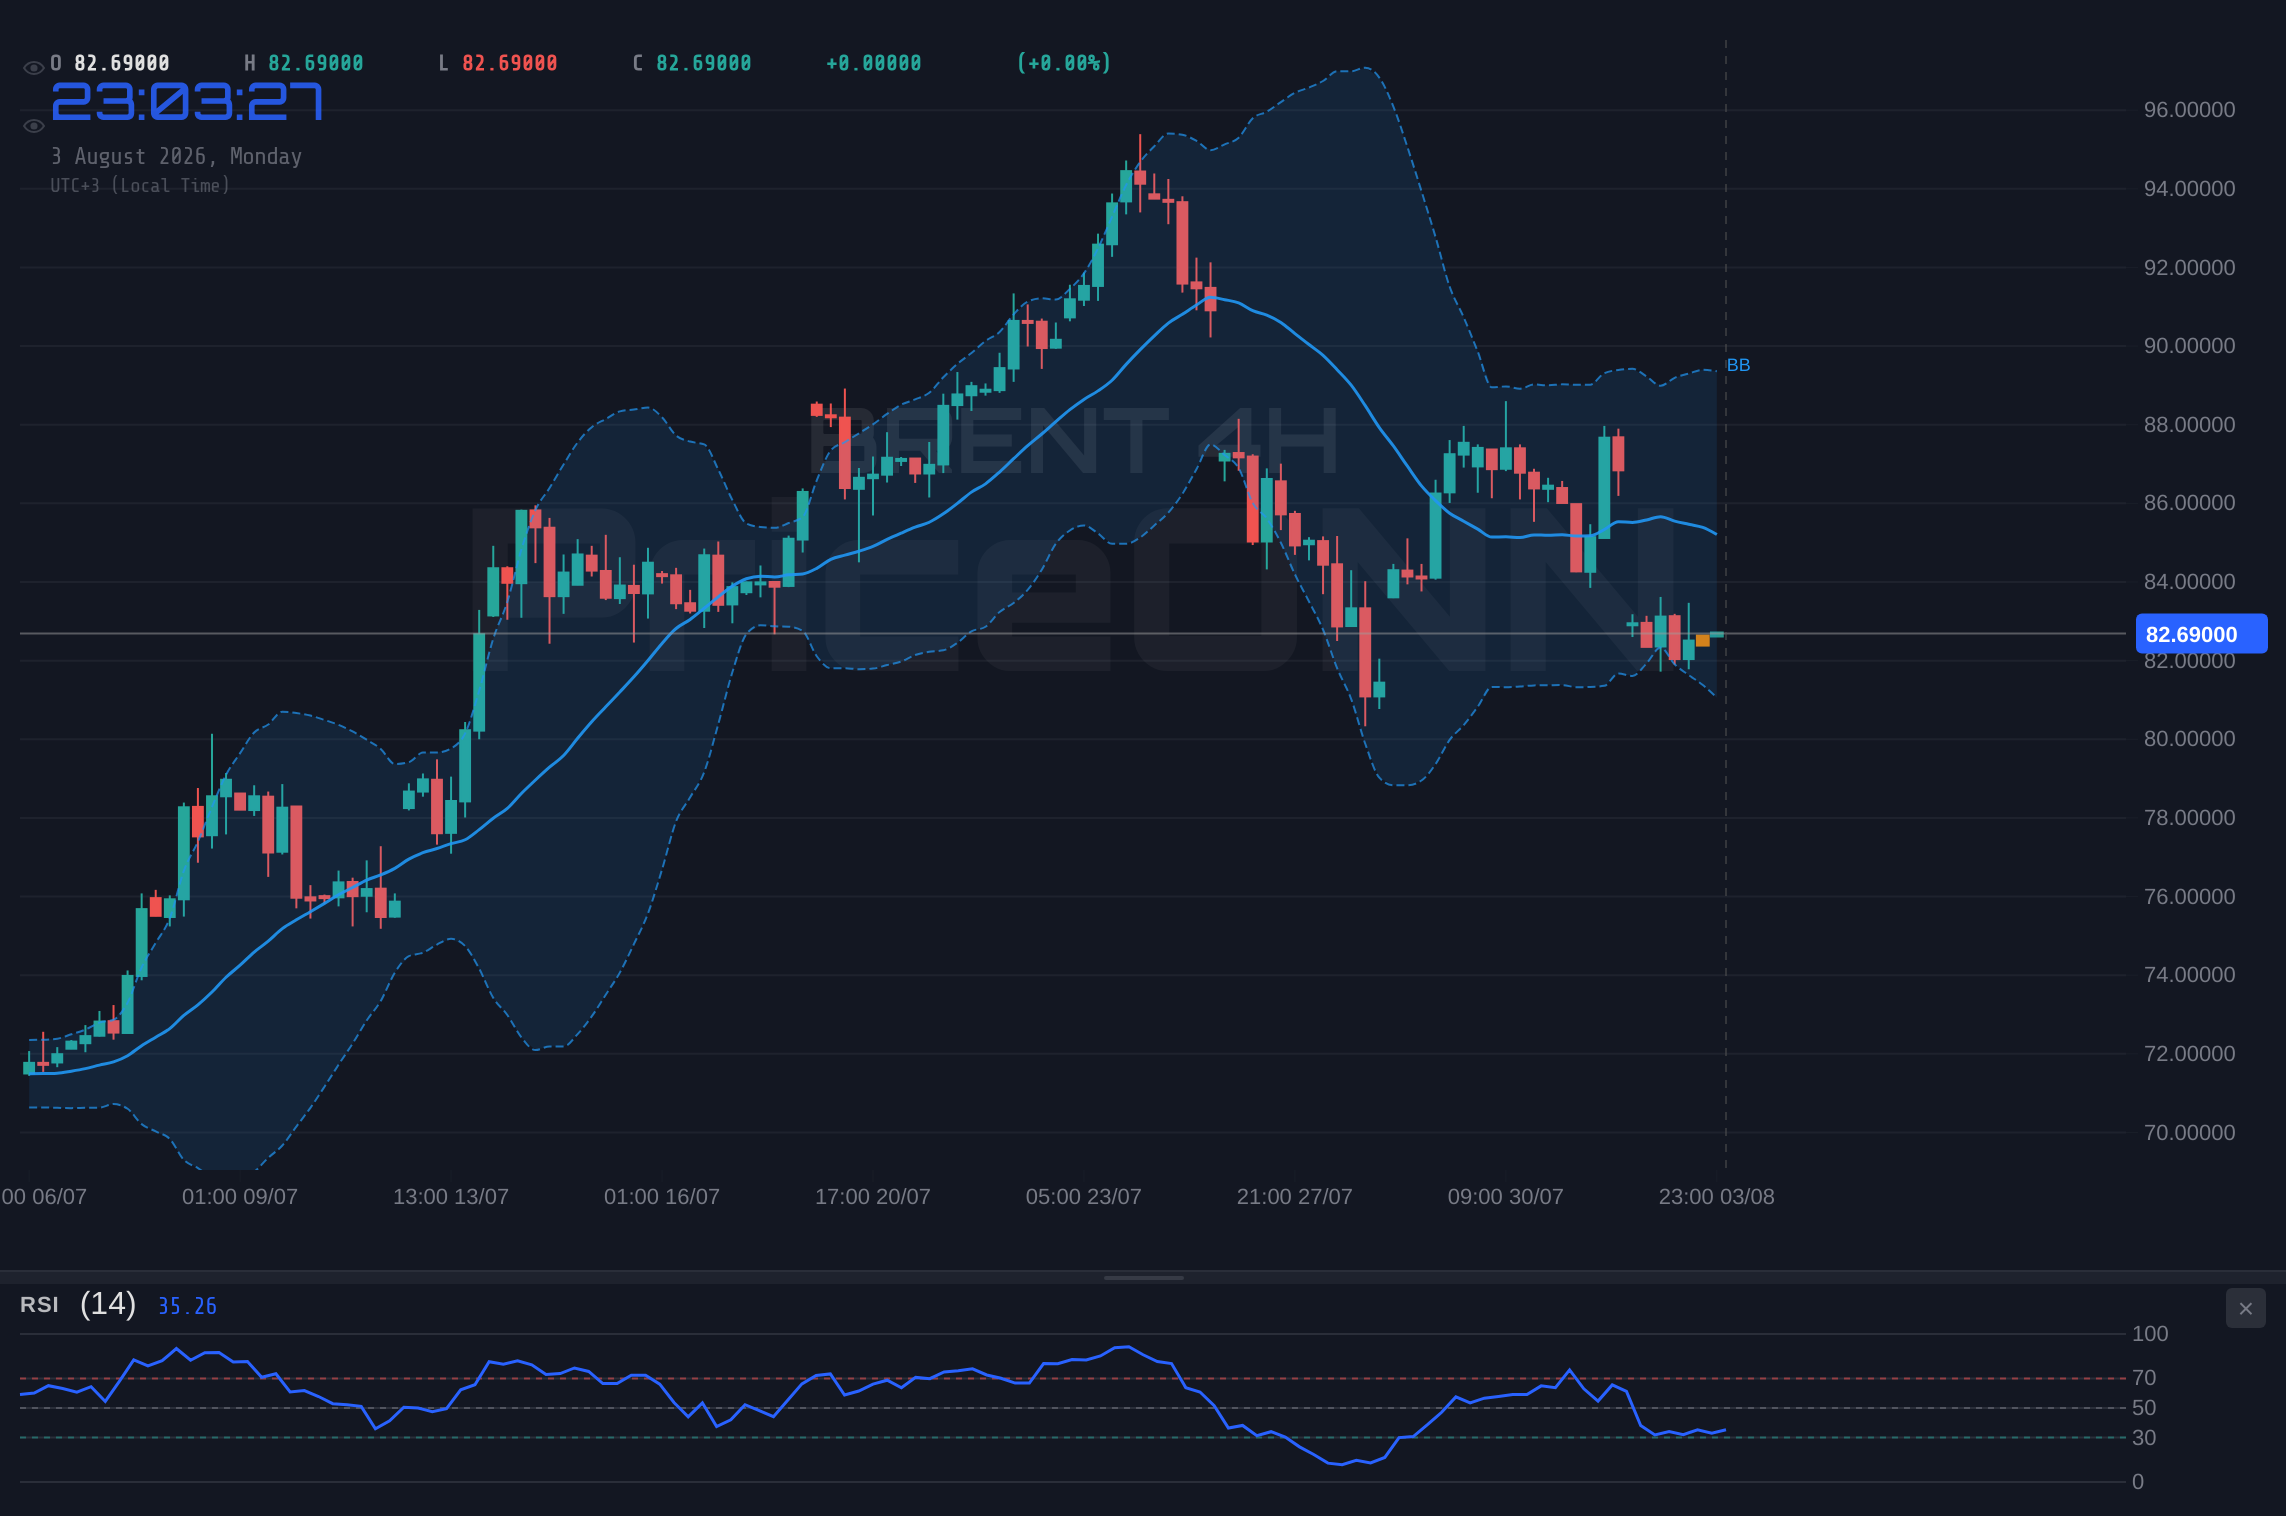
On the 1-hour timeframe, Brent crude exhibits a neutral trend with moderate strength, currently hovering around the $82.69 mark. The price action has seen a notable retreat, pushing below the $83.22 resistance level that served as a temporary ceiling. The immediate support is identified at $82.19, followed by $81.58 and $81.16. The RSI(14) stands at 42.27, a reading that, while not deeply oversold, does indicate a bearish tilt in momentum. This suggests that the selling pressure might not be exhausted, and further declines are plausible before the market finds a bottom. The MACD indicator supports this view, showing positive momentum but with the MACD line positioned below the signal line, hinting at a potential shift or consolidation rather than a strong reversal. Bollinger Bands also align with this bearish inclination, with the price trading above the middle band but showing signs of downward pressure, suggesting it might be testing the upper boundary of its immediate trading range before a potential move lower. Stochastic K and D lines (53.45 and 46.43 respectively) show %K above %D, which technically signals a potential for upward movement, but in the context of the other indicators, this could be a brief pause rather than a sustained rally. The ADX at 23.28 confirms a moderately strong downtrend, reinforcing the caution warranted in immediate trading decisions.
The 4-Hour Chart: Confirming the Downtrend Bias
Shifting to the 4-hour chart, the trend for Brent crude becomes more decisively bearish, with a strength of 89%. The current price of $82.69 is well within the confines of this established downtrend. Immediate support levels are situated at $81.56, $81.09, and $80.27. These levels represent significant psychological and technical barriers that, if breached, could trigger further downside momentum. Resistance is noted at $82.85, $83.67, and $84.14. The RSI(14) at 40.73 continues to signal a bearish inclination, reinforcing the narrative from the shorter timeframe. It suggests that the market is still absorbing selling pressure, and the oversold territory has not yet been reached, leaving room for prices to fall further. The MACD indicator here paints a clearer bearish picture, displaying negative momentum with the MACD line firmly below its signal line. This is a classic sign of weakening buying interest and strengthening selling pressure. Bollinger Bands are also aligned with the bearish trend, showing the price below the middle band, indicating a downward bias. The Stochastic oscillator, with K at 14.35 and D at 27.19, provides a strong bearish signal, as %K is significantly below %D and both are in oversold territory, suggesting a potential for a bounce, but the overall trend context tempers this expectation. The ADX value of 18.74 indicates a weak trend on this timeframe, which might seem contradictory to the strong bearish trend strength (89%). However, this often signifies that while the direction is bearish, the momentum isn't yet accelerating strongly, possibly leading to periods of consolidation within the broader downtrend.
The Daily Chart: The Bigger Picture and Long-Term Outlook
On the daily chart, Brent crude's trend is currently neutral, with a strength of 50%. This neutrality suggests that while shorter-term trends might be present, the longer-term outlook is still forming or consolidating. The current price of $82.69 finds itself between significant daily support at $85.12, $83.79, and $82.05, and resistance levels at $88.19, $89.93, and $91.26. The RSI(14) is at 47.69, residing in the neutral zone and exhibiting a slight downward eğilim. This indicates that the market is neither overbought nor oversold on a daily basis, leaving ample room for price discovery in either direction. The MACD indicator on the daily chart shows positive momentum, with the MACD line above its signal line. This can be interpreted as underlying buying interest, even amidst short-term selling. However, the Bollinger Bands are positioned above the middle band, suggesting an upward bias, but the recent price action has seen it hover near the middle band, indicating potential for a test of lower bands. Stochastic K at 34.73 and D at 60.01 presents a bearish signal (%K
Fundamental Drivers: Inflation, Geopolitics, and Demand
The recent sharp decline in Brent crude prices, pushing it towards the $82.69 level, is not occurring in a vacuum. It is heavily influenced by a confluence of macroeconomic factors and evolving geopolitical landscapes. One of the primary drivers remains inflation. As central banks globally grapple with persistent inflation, their monetary policy decisions - particularly interest rate hikes - directly impact economic growth and, consequently, energy demand. Higher interest rates tend to dampen economic activity, leading to reduced consumption of oil and refined products. The current RSI reading of 42.27 on the 1-hour chart and 40.73 on the 4-hour chart suggests that traders are pricing in a scenario of slower global growth, which would naturally lead to lower oil prices. Furthermore, the ADX values consistently indicating a downtrend or moderate trend strength across shorter timeframes underscore this sentiment. Analysts are closely watching upcoming inflation reports, such as CPI and PPI, as they will provide crucial insights into whether inflationary pressures are abating or persisting, thereby guiding central bank policy and, by extension, oil market sentiment.
Geopolitical risks, while often a catalyst for oil price surges, can also contribute to price declines when tensions ease or when specific supply disruptions are resolved. For instance, news regarding potential de-escalation in certain regions or increased oil production from non-OPEC+ sources can quickly shift market sentiment. While specific geopolitical events directly impacting Brent crude weren't highlighted in the immediate news feed, the broader context of global stability remains a key factor. The recent news about Georgia's Kulevi Refinery replacing Russian crude with Kazakh and Libyan oil, while specific, illustrates the ongoing adjustments in global oil flows. Such shifts can sometimes alleviate supply concerns, contributing to price moderation. Conversely, any unexpected flare-ups in major oil-producing regions, particularly the Middle East, could rapidly reverse this trend and send prices higher, creating significant volatility. The current neutral stance on the daily chart suggests that the market is weighing these competing factors, awaiting a clearer signal.
Demand-side factors are equally critical. Global economic growth projections, particularly from major consumers like China and the United States, play a significant role. Stronger-than-expected economic data can boost demand forecasts, while weaker data can dampen them. The performance of indices like the S&P 500 and Nasdaq, which are currently showing mixed signals with the S&P 500 on a daily chart indicating a downtrend (ADX 47.51) and Nasdaq showing a bearish trend (ADX 26.63), suggests underlying caution in risk appetite. This can translate into reduced demand for oil. The DXY, currently around 99.97, shows a neutral trend on the 1-hour chart but a bearish inclination on the 4-hour and daily charts, which typically correlates with a supportive environment for commodities like oil, yet the price action suggests other factors are currently dominating. The interplay between these fundamental drivers - inflationary pressures, geopolitical stability, and economic growth - creates a complex environment for Brent crude, contributing to the current indecision seen on the daily chart.
Correlation Analysis: DXY, Equities, and Brent's Path
Understanding how Brent crude interacts with other major market instruments is crucial for a comprehensive analysis. The US Dollar Index (DXY) often exhibits an inverse correlation with oil prices; as the dollar strengthens, commodities priced in dollars, like Brent, tend to become more expensive for holders of other currencies, potentially dampening demand and leading to price declines. Currently, the DXY shows a neutral trend on the 1-hour chart, but a bearish inclination on longer timeframes. This mixed signal from the dollar index adds another layer of complexity to Brent's price action. If the dollar were to show a sustained weakening trend, it could provide some support for Brent, even amidst bearish demand signals. However, the current technical indicators on Brent's shorter timeframes suggest that the bearish momentum might be overriding any potential support from a weaker dollar.
Equity markets, particularly the S&P 500 and Nasdaq, serve as key indicators of global risk appetite. A strong rally in equities typically correlates with increased risk-taking and higher demand for commodities, including oil. Conversely, a decline in stock markets often signals a 'risk-off' sentiment, leading investors to reduce exposure to riskier assets like oil and seek safer havens. The S&P 500's daily chart indicates a strong downtrend with an ADX of 47.51, suggesting significant selling pressure in the broader stock market. Similarly, the Nasdaq 100 also shows a bearish trend on its daily chart with an ADX of 26.63. This prevailing weakness in major equity indices suggests that global risk sentiment is subdued, which is likely contributing to the downward pressure on Brent crude prices. The fact that Brent is experiencing a decline while equities are also weak reinforces the idea that demand concerns are a primary driver, rather than just specific commodity market dynamics.
The correlation between Brent and WTI (West Texas Intermediate) crude is also noteworthy. Historically, these benchmarks move in tandem, reflecting similar global supply and demand fundamentals. The current data shows both benchmarks experiencing similar sharp declines, with Brent at $82.69 and WTI at $80.72. This synchronized movement strengthens the conviction that the bearish pressure is systemic across the crude oil market, driven by factors affecting both benchmarks equally. The magnitude of the daily percentage change is also comparable, indicating a broad-based sell-off in the energy sector rather than an isolated event affecting one particular grade of crude. This broad market correlation suggests that any analysis of Brent must consider the wider energy complex and the overarching macroeconomic environment.
Trading Scenarios: Navigating the $82.69 Crossroads
Bearish Scenario: Testing Lower Support Levels
60% ProbabilityNeutral Scenario: Consolidation Around $82.69
30% ProbabilityBullish Scenario: Reclaiming Higher Ground
10% ProbabilityInterpreting the Signals: What the Indicators Tell Us
The technical indicators provide a nuanced view of Brent crude's immediate future. On the 1-hour chart, the RSI at 42.27 suggests room for further downside before hitting oversold territory, while the MACD shows negative momentum. The Stochastic oscillator, however, offers a glimmer of hope with %K above %D, hinting at a potential short-term bounce. This creates a conflict: the overall trend and momentum indicators lean bearish, but a short-term oscillator suggests a possible pause or reversal. The ADX at 23.28 confirms a moderate downtrend, indicating that any upward moves might be short-lived unless significant buying pressure emerges. On the 4-hour chart, the bearish signals are stronger, with RSI at 40.73 and a MACD below its signal line. The Stochastic here is also in oversold territory with a bullish crossover, but the ADX at 18.74 indicates a weak trend, meaning this bounce potential might not have enough strength to overcome the broader bearish sentiment. The daily chart presents the most mixed picture. While ADX suggests a strong uptrend, the RSI at 47.69 is neutral, and the MACD and Stochastic lean bearish. This divergence is critical; it suggests that while there might be underlying strength in the market, the immediate sentiment is bearish, and a break below key support levels could trigger a more significant move downwards.
The conflict between the daily chart's ADX suggesting a strong uptrend and shorter-term charts showing bearish momentum is a key point of analysis. It implies that the current downtrend might be a correction within a larger bullish structure, or it could be the beginning of a significant trend reversal. The strength of the DXY's longer-term bearish inclination is a factor that could theoretically support Brent, but the current price action indicates that demand concerns and inflation outlook are currently dominating market psychology. Traders should pay close attention to the $82.19 support level on the 1-hour chart. A decisive break below this level, especially with increasing volume, would likely invalidate any immediate bullish hopes and confirm the bearish scenario outlined, targeting lower support levels. Conversely, a sustained move above the $83.67 resistance, coupled with confirmation from MACD and RSI on shorter timeframes, would be necessary to signal a potential shift towards the bullish scenario.
The divergence between daily ADX and shorter-term indicators presents a significant risk. A strong uptrend indicated by the daily ADX could quickly reassert itself if fundamental catalysts shift favorably, potentially catching short sellers off guard. Conversely, a failure to hold immediate support levels could accelerate the downtrend, invalidating the neutral scenario and pushing prices towards the lower targets outlined in the bearish scenario.
The Road Ahead: What to Watch for in Brent Crude
Looking forward, the price action around the $82.69 level for Brent crude will be heavily influenced by upcoming economic data releases and any shifts in geopolitical sentiment. Central bank policy remains a dominant theme; any hints from the Federal Reserve or the European Central Bank regarding interest rate trajectories will directly impact economic growth forecasts and, consequently, oil demand. For instance, if upcoming inflation data proves to be stickier than expected, it could prompt further monetary tightening, adding downward pressure on crude prices. Conversely, signs of inflation cooling could lead to a more dovish monetary policy stance, potentially boosting economic optimism and oil demand.
The correlation with equity markets and the DXY will also be critical to monitor. A sustained downturn in the S&P 500 and Nasdaq, reinforcing the current bearish trend on their daily charts, would likely amplify selling pressure on Brent. Similarly, a strengthening dollar could add further headwinds. Traders will be looking for confirmation signals across multiple timeframes and indicators. A confirmed break below $82.19, supported by increased volume and bearish MACD crossovers on shorter timeframes, would solidify the bearish outlook. On the other hand, a rally above $83.67, with RSI moving back above 50 and MACD showing renewed positive momentum, would suggest a potential reversal. The market is currently at a critical juncture, and patience will be key for traders looking to capitalize on the next significant move. Managing risk and waiting for clear signals remain the most prudent strategies.
| Indicator | Value | Signal | Interpretation |
|---|---|---|---|
| RSI (14) | 47.69 | Neutral | Suggests room for price movement in either direction. |
| MACD | Positive | Bullish Momentum | MACD line above signal line, but momentum is weakening. |
| Stochastic | K: 34.73, D: 60.01 | Bearish Crossover | Indicates potential for further downside. |
| ADX | 27.7 | Strong Uptrend | Suggests a strong underlying trend, contradicting shorter-term signals. |
| Bollinger Bands | Middle Band Test | Watch | Price hovering near the middle band, indicating indecision. |
Frequently Asked Questions: Brent Crude Analysis
What happens if Brent crude breaks below the $82.19 support level?
A break below $82.19 would likely confirm the bearish scenario, potentially triggering further declines towards $81.58 and $81.09. This would be driven by increasing selling pressure and confirmation from MACD and RSI indicators on shorter timeframes.
Should I consider buying Brent at current levels near $82.69 given the mixed indicator signals?
Caution is advised. While some oscillators hint at a potential bounce, the prevailing bearish momentum on shorter timeframes and the neutral stance on the daily chart suggest waiting for clearer confirmation. A sustained move above $83.67 would be a more reliable buy signal.
Is the RSI at 42.27 a sell signal for Brent crude right now?
An RSI of 42.27 indicates a bearish tilt but is not yet in oversold territory. It suggests that sellers have an advantage, but there is room for prices to fall further before a potential bounce. It signals caution rather than an immediate sell order.
How might upcoming inflation data affect Brent crude prices this week?
Higher-than-expected inflation could lead to fears of further interest rate hikes, dampening economic growth and oil demand, thus pressuring Brent prices lower. Conversely, cooling inflation might ease rate hike fears, potentially supporting oil prices.
Track markets in real-time
AI-powered analysis, technical indicators and real-time price data.
Join Our Telegram Channel
Breaking market news, AI analysis and trading signals instantly.
Join Channel