

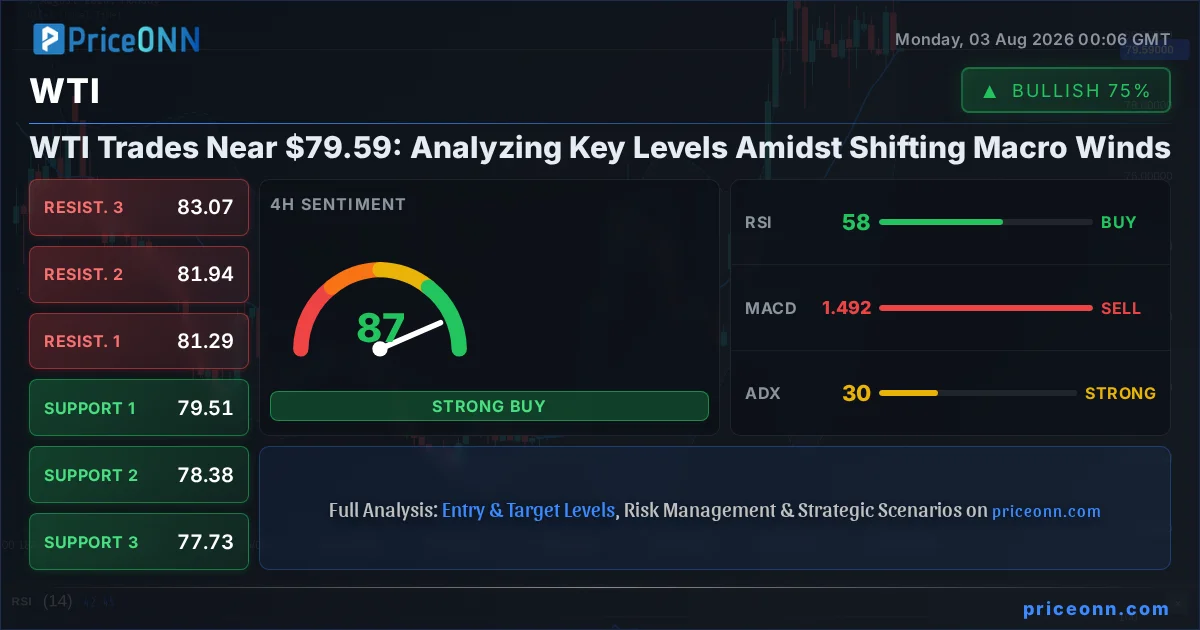
The narrative surrounding WTI crude oil is currently dominated by its tight dance around the $79.59 mark. This seemingly narrow trading range belies a complex interplay of macroeconomic forces, shifting geopolitical tensions, and subtle technical signals that traders are closely monitoring. While the immediate price action might appear consolidated, the underlying drivers suggest a potential for significant moves as key economic data and central bank policy expectations continue to shape market sentiment. Understanding the current landscape requires a deep dive into not just the charts, but the fundamental underpinnings that are dictating the flow of capital in the energy markets.
- WTI hovers around $79.59, with RSI at 46.91 indicating a neutral-to-bearish lean.
- Critical support is identified at $78.99, with further levels at $77.57 and $76.63.
- Key resistance lies at $81.29, followed by $81.94 and $83.07.
- The strengthening DXY (currently 100.7) is exerting downward pressure on oil prices.
The current price of WTI crude oil, precisely at $79.59, finds itself at a pivotal juncture. This level is not merely a number; it represents a delicate balance between supply-side dynamics and demand-side expectations, all while being heavily influenced by broader market correlations. The Dollar Index (DXY) currently stands at 100.7, showing a slight upward bias. Historically, a stronger dollar tends to put downward pressure on dollar-denominated commodities like oil, as it makes them more expensive for holders of other currencies. This inverse relationship is a cornerstone of commodity trading analysis, and its presence today adds a layer of complexity to the bullish arguments for WTI.
Furthermore, the performance of major equity indices provides context. The SP500 is trading around 6572.87, showing a positive daily change, suggesting a degree of risk appetite in the broader market. However, the Nasdaq, currently at 29164.86, has experienced a notable decline, indicating sector-specific weakness or a broader tech sell-off. This divergence within equities can sometimes spill over into commodity markets, creating uncertainty. For WTI, a risk-off sentiment often correlates with lower energy demand expectations, potentially capping upside moves. The ADX on the 1H chart for WTI is 10.18, signaling a very weak trend, which implies that the current price action is more range-bound than directional, awaiting a stronger catalyst.
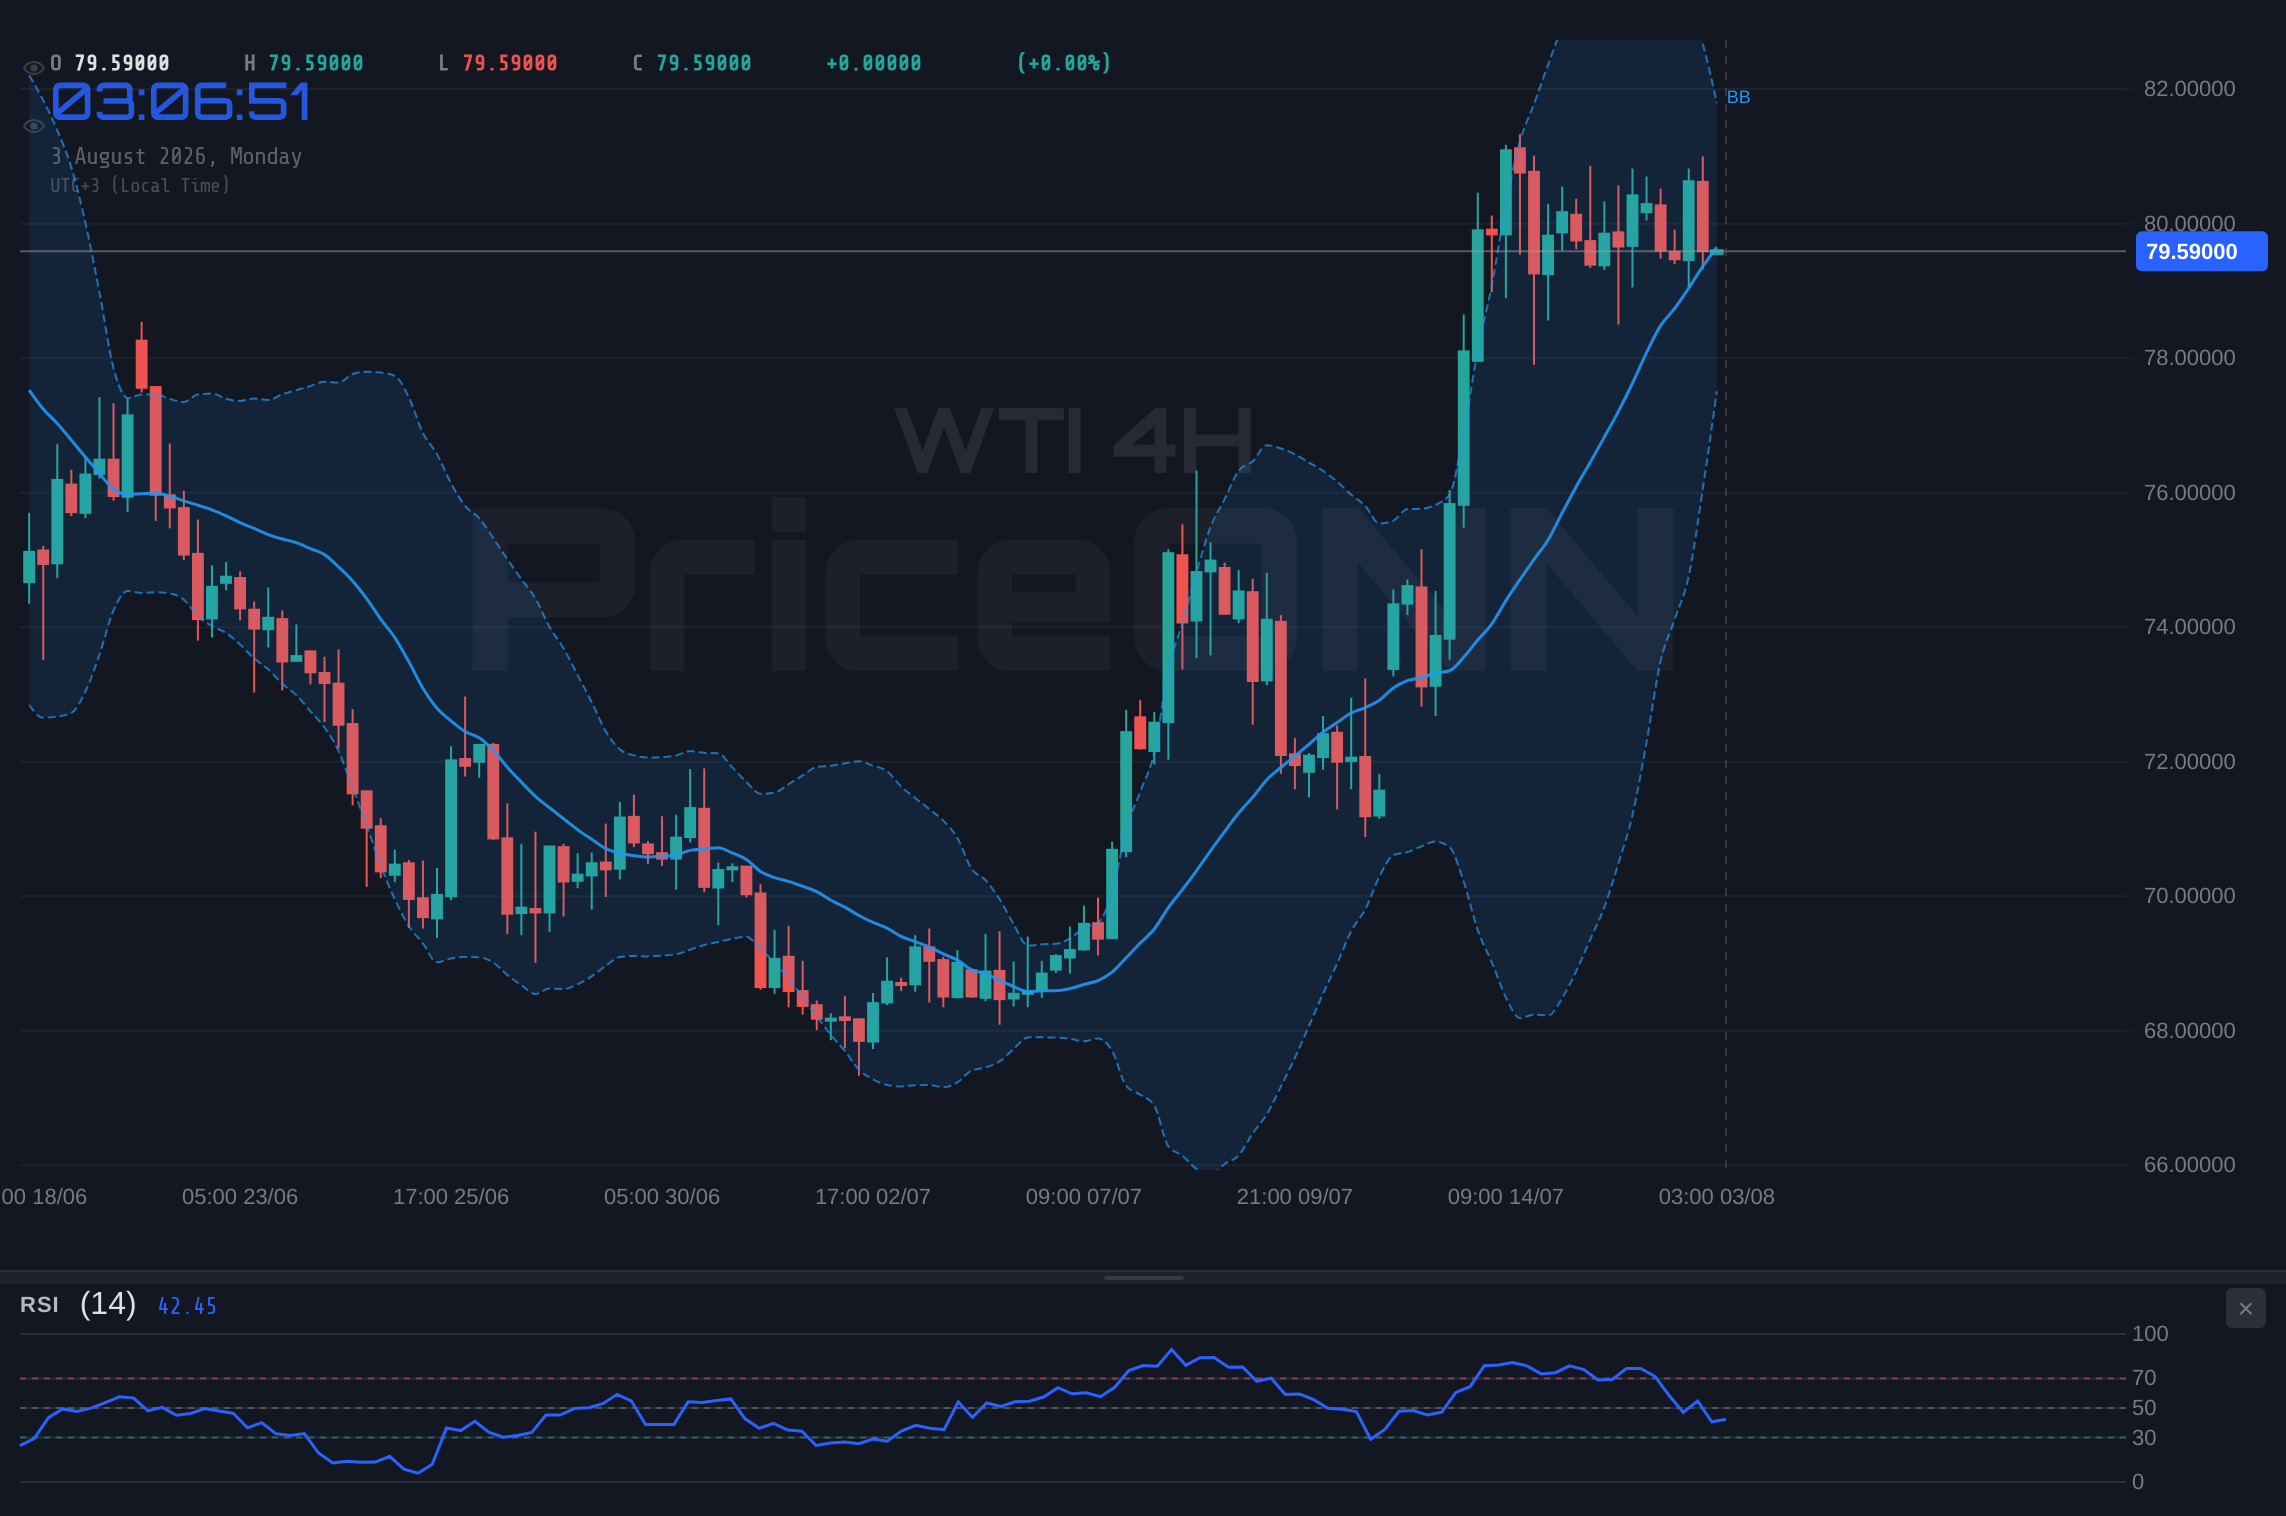
Navigating the Technical Terrain: Support and Resistance
Delving into the technical indicators, the WTI 1H chart presents a neutral trend with a power of 50%. The RSI(14) is hovering at 46.91, sitting comfortably in the neutral zone but leaning towards bearish territory. This suggests that while sellers are not overwhelming buyers, there isn't strong conviction for an upward push either. The MACD is showing negative momentum, with the MACD line below its signal line, reinforcing the cautious sentiment. Bollinger Bands are also positioned below the middle band, indicating a bearish bias in the short term. However, the Stochastic oscillator offers a conflicting signal, with K=28.74 and D=52.74, suggesting a potential for a bounce as it moves out of oversold territory. This divergence between RSI and Stochastic highlights the choppiness in the immediate price action.
The ADX value of 10.18 on the 1H timeframe is particularly telling. It signifies a lack of a strong directional trend, meaning that price movements are more likely to be choppy and range-bound until a significant catalyst emerges. This low ADX reading implies that breakout attempts might be short-lived or deceptive. The overall signal for the 1H timeframe is SAT (Sell), with 1 Buy, 7 Sell, and 0 Neutral signals, indicating a short-term bearish bias from the aggregated indicators, despite the conflicting Stochastic signal.
Shifting to the 4H timeframe, the trend is still classified as neutral (50% power), but the indicators paint a slightly different picture. The RSI is at 58.47, moving into the upper half of the neutral zone and showing a rising tendency, which could signal building bullish momentum. The MACD, however, still indicates negative momentum, with the MACD line below its signal line. The Bollinger Bands are above the middle band, suggesting a more bullish inclination in this timeframe. The Stochastic oscillator (K=58.32, D=60.98) is showing a bearish signal, with the %K line crossing below the %D line, indicating potential downward pressure. The ADX at 30.49 suggests a strong uptrend, which seems to contradict the MACD and Stochastic signals, highlighting a lack of consensus across indicators.
Despite these mixed signals on the 4H chart, the overall signal leans towards AL (Buy), with 6 Buy, 2 Sell, and 0 Neutral signals. This suggests that while short-term momentum might be wavering, the medium-term outlook, as interpreted by this aggregation, leans positive. The key levels to watch on the 4H chart are support at $79.51, $78.38, and $77.73, with resistance eyed at $81.29, $81.94, and $83.07. These levels are crucial for determining the direction of the next significant price move.
The Daily Perspective: Trend Strength and Momentum
On the daily timeframe, WTI exhibits a neutral trend (50% power), mirroring the uncertainty seen across shorter timeframes. The RSI(14) is at 53.65, firmly in the neutral zone and showing a slight upward trajectory, suggesting that buyers are beginning to gain some traction. The MACD is displaying positive momentum, with the MACD line above its signal line, which is a classic bullish signal. Bollinger Bands are situated above the middle band, reinforcing this potentially bullish outlook. The Stochastic oscillator is in overbought territory (K=89.73, D=76.8), indicating that the price may have risen too far, too fast, and a pullback or consolidation is possible. However, the ADX at 29.46 indicates a strong uptrend, which seems to align with the MACD and Stochastic signals, suggesting that the current upward move has substance.
The overall signal on the daily timeframe is AL (Buy), with 7 Buy, 1 Sell, and 0 Neutral signals. This aggregation points towards a bullish bias in the longer term. The key support levels on the daily chart are $78.99, $77.57, and $76.63. These are the price points where buying interest is expected to emerge if the price declines. Conversely, resistance levels are seen at $81.35, $82.29, and $83.71. A decisive break above these resistance levels would be necessary to confirm a sustained bullish trend.
The current price of $79.59 for WTI is nestled between the immediate support of $78.99 and the nearby resistance at $81.29. This narrow range highlights the market's indecision. The fundamental backdrop, particularly concerning global oil supply and demand, remains a key driver. Recent news regarding Argentina's Vaca Muerta shale output, which is booming, could theoretically add to global supply. However, the article notes that this hasn't lifted Argentina's wider economy, suggesting localized impacts rather than a broad market shift. Conversely, geopolitical tensions, such as those mentioned in the context of Suriname's oil bet and Middle East turmoil, can inject volatility and support prices by threatening supply disruptions.
The influence of central bank policies cannot be overstated. While specific central bank actions aren't detailed for WTI's direct movement in the provided data, the general macro environment is crucial. The DXY's strength (100.7) suggests a relatively hawkish stance or market expectation regarding US monetary policy, which typically acts as a headwind for oil. If upcoming economic data, such as inflation reports or employment figures, were to signal persistent inflation or a robust economy, it could reinforce expectations of higher-for-longer interest rates, potentially strengthening the dollar further and pressuring WTI. Conversely, signs of economic cooling could lead to a weaker dollar and support oil prices.
The interplay between these factors creates a complex trading environment. The RSI at 46.91 on the 1H chart suggests room for a downward move before hitting oversold territory, while the Stochastic offers a counter-signal of a potential bounce. This technical ambiguity, combined with the mixed fundamental signals - potential supply increases from shale plays versus geopolitical supply risks - means that traders must remain vigilant. The ADX readings across timeframes (10.18 on 1H, 30.49 on 4H, 29.46 on 1D) show a very weak trend in the short term, strengthening in the medium term, and then weakening again on the daily, further complicating a clear directional call.
Considering the current price action around $79.59, the immediate focus remains on the $78.99 support level. A decisive break below this could open the door for a test of the $77.57 level. On the upside, breaking through the $81.29 resistance is crucial for any sustained rally. The confluence of indicators on the daily chart (MACD positive momentum, Stochastic rising, ADX strong trend) offers a slightly more optimistic view for the longer term, but the short-term signals remain cautious. The market is essentially waiting for a clearer signal from either macroeconomic data releases or a significant geopolitical event to break this current stalemate.
The recent news regarding China doubling down on clean energy, even as coal use grows, adds another layer to the long-term demand picture for oil. While this is a secular trend, it doesn't negate the short-to-medium term impact of current supply-demand fundamentals and geopolitical risks. The market's reaction to the Abqaiq attack, mentioned in the news, serves as a reminder of how sensitive oil prices can be to supply chain vulnerabilities in critical regions. Such events can quickly override broader economic considerations, leading to sharp price spikes.
For traders, the current environment demands a disciplined approach. The lack of a strong directional trend on the 1H chart, coupled with conflicting signals from oscillators like RSI and Stochastic, suggests that scalping or very short-term trades might be favored by some. However, for those with a longer time horizon, the key lies in waiting for a clear breakout above resistance or a confirmed test and hold of the key support levels. The $79.59 price point is a battleground, and the outcome will likely be dictated by factors beyond the immediate technicals, including upcoming economic data and any shifts in global risk sentiment.
Bearish Scenario: Testing Lower Supports
65% ProbabilityConsolidation Scenario: Range-Bound Trading
25% ProbabilityBullish Scenario: Breaking Resistance
10% ProbabilityFrequently Asked Questions: WTI Analysis
What happens if WTI breaks below the $78.99 support level?
A break below $78.99 on WTI would likely trigger further selling pressure, potentially testing the next support at $77.57. This scenario gains probability if the DXY continues to strengthen or if broader risk aversion takes hold in financial markets.
Is the current RSI reading of 46.91 a sell signal for WTI at $79.59?
An RSI of 46.91 is in the neutral zone, leaning bearish but not definitively oversold or overbought. While it doesn't signal an immediate buy, it suggests that the market is not yet in a strong bullish momentum phase, leaving room for potential downside towards support levels.
How will upcoming economic data potentially affect WTI around $79.59 this week?
Stronger-than-expected inflation or employment data could lead to a stronger dollar (DXY at 100.7) and pressure WTI lower. Conversely, weaker data might weaken the dollar and provide support for oil prices, potentially aiding a move towards the $81.29 resistance.
What are the key levels to watch for WTI if it consolidates near $79.59?
If WTI remains range-bound, traders will watch the immediate support at $78.99 and resistance at $81.29. A hold above $79.59 maintains a neutral stance, while a close below $78.99 turns the outlook bearish, and a sustained break above $81.29 would be bullish.
Track markets in real-time
AI-powered analysis, technical indicators and real-time price data.
Join Our Telegram Channel
Breaking market news, AI analysis and trading signals instantly.
Join Channel