

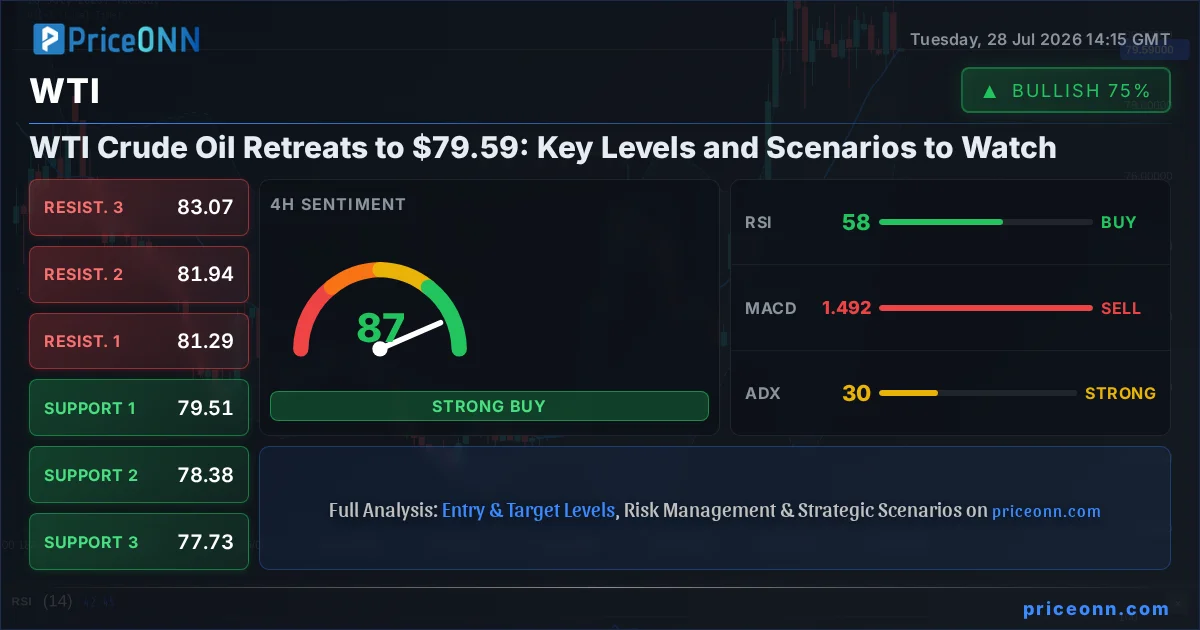
The price of WTI crude oil has fallen to $79.59, marking a 1.03% decline on the day. This move comes amidst a complex interplay of factors, including a strengthening US dollar, shifting inflation expectations, and ongoing geopolitical undercurrents in the Middle East. As traders digest this pullback, the question on everyone's mind is whether this represents a minor correction within a larger uptrend or the beginning of a more significant downturn. Understanding the key technical levels and potential scenarios is crucial for navigating this volatile market. This analysis delves into the current technical landscape, providing a multi-scenario outlook to help traders prepare for the next potential move.
- WTI crude oil is currently priced at $79.59, down 1.03% as market sentiment shifts.
- The 1-hour chart shows a strong bearish signal with RSI at 46.91, indicating downward momentum.
- Key support is identified at $79.23, with crucial resistance overhead at $83.44 on the 1-hour timeframe.
- The US Dollar Index (DXY) is trading at 100.70, its strength potentially pressuring oil prices.
- A confluence of technical indicators suggests a neutral to bearish outlook in the short term, pending further catalysts.
Navigating the $79.59 Juncture: A Technical Deep Dive
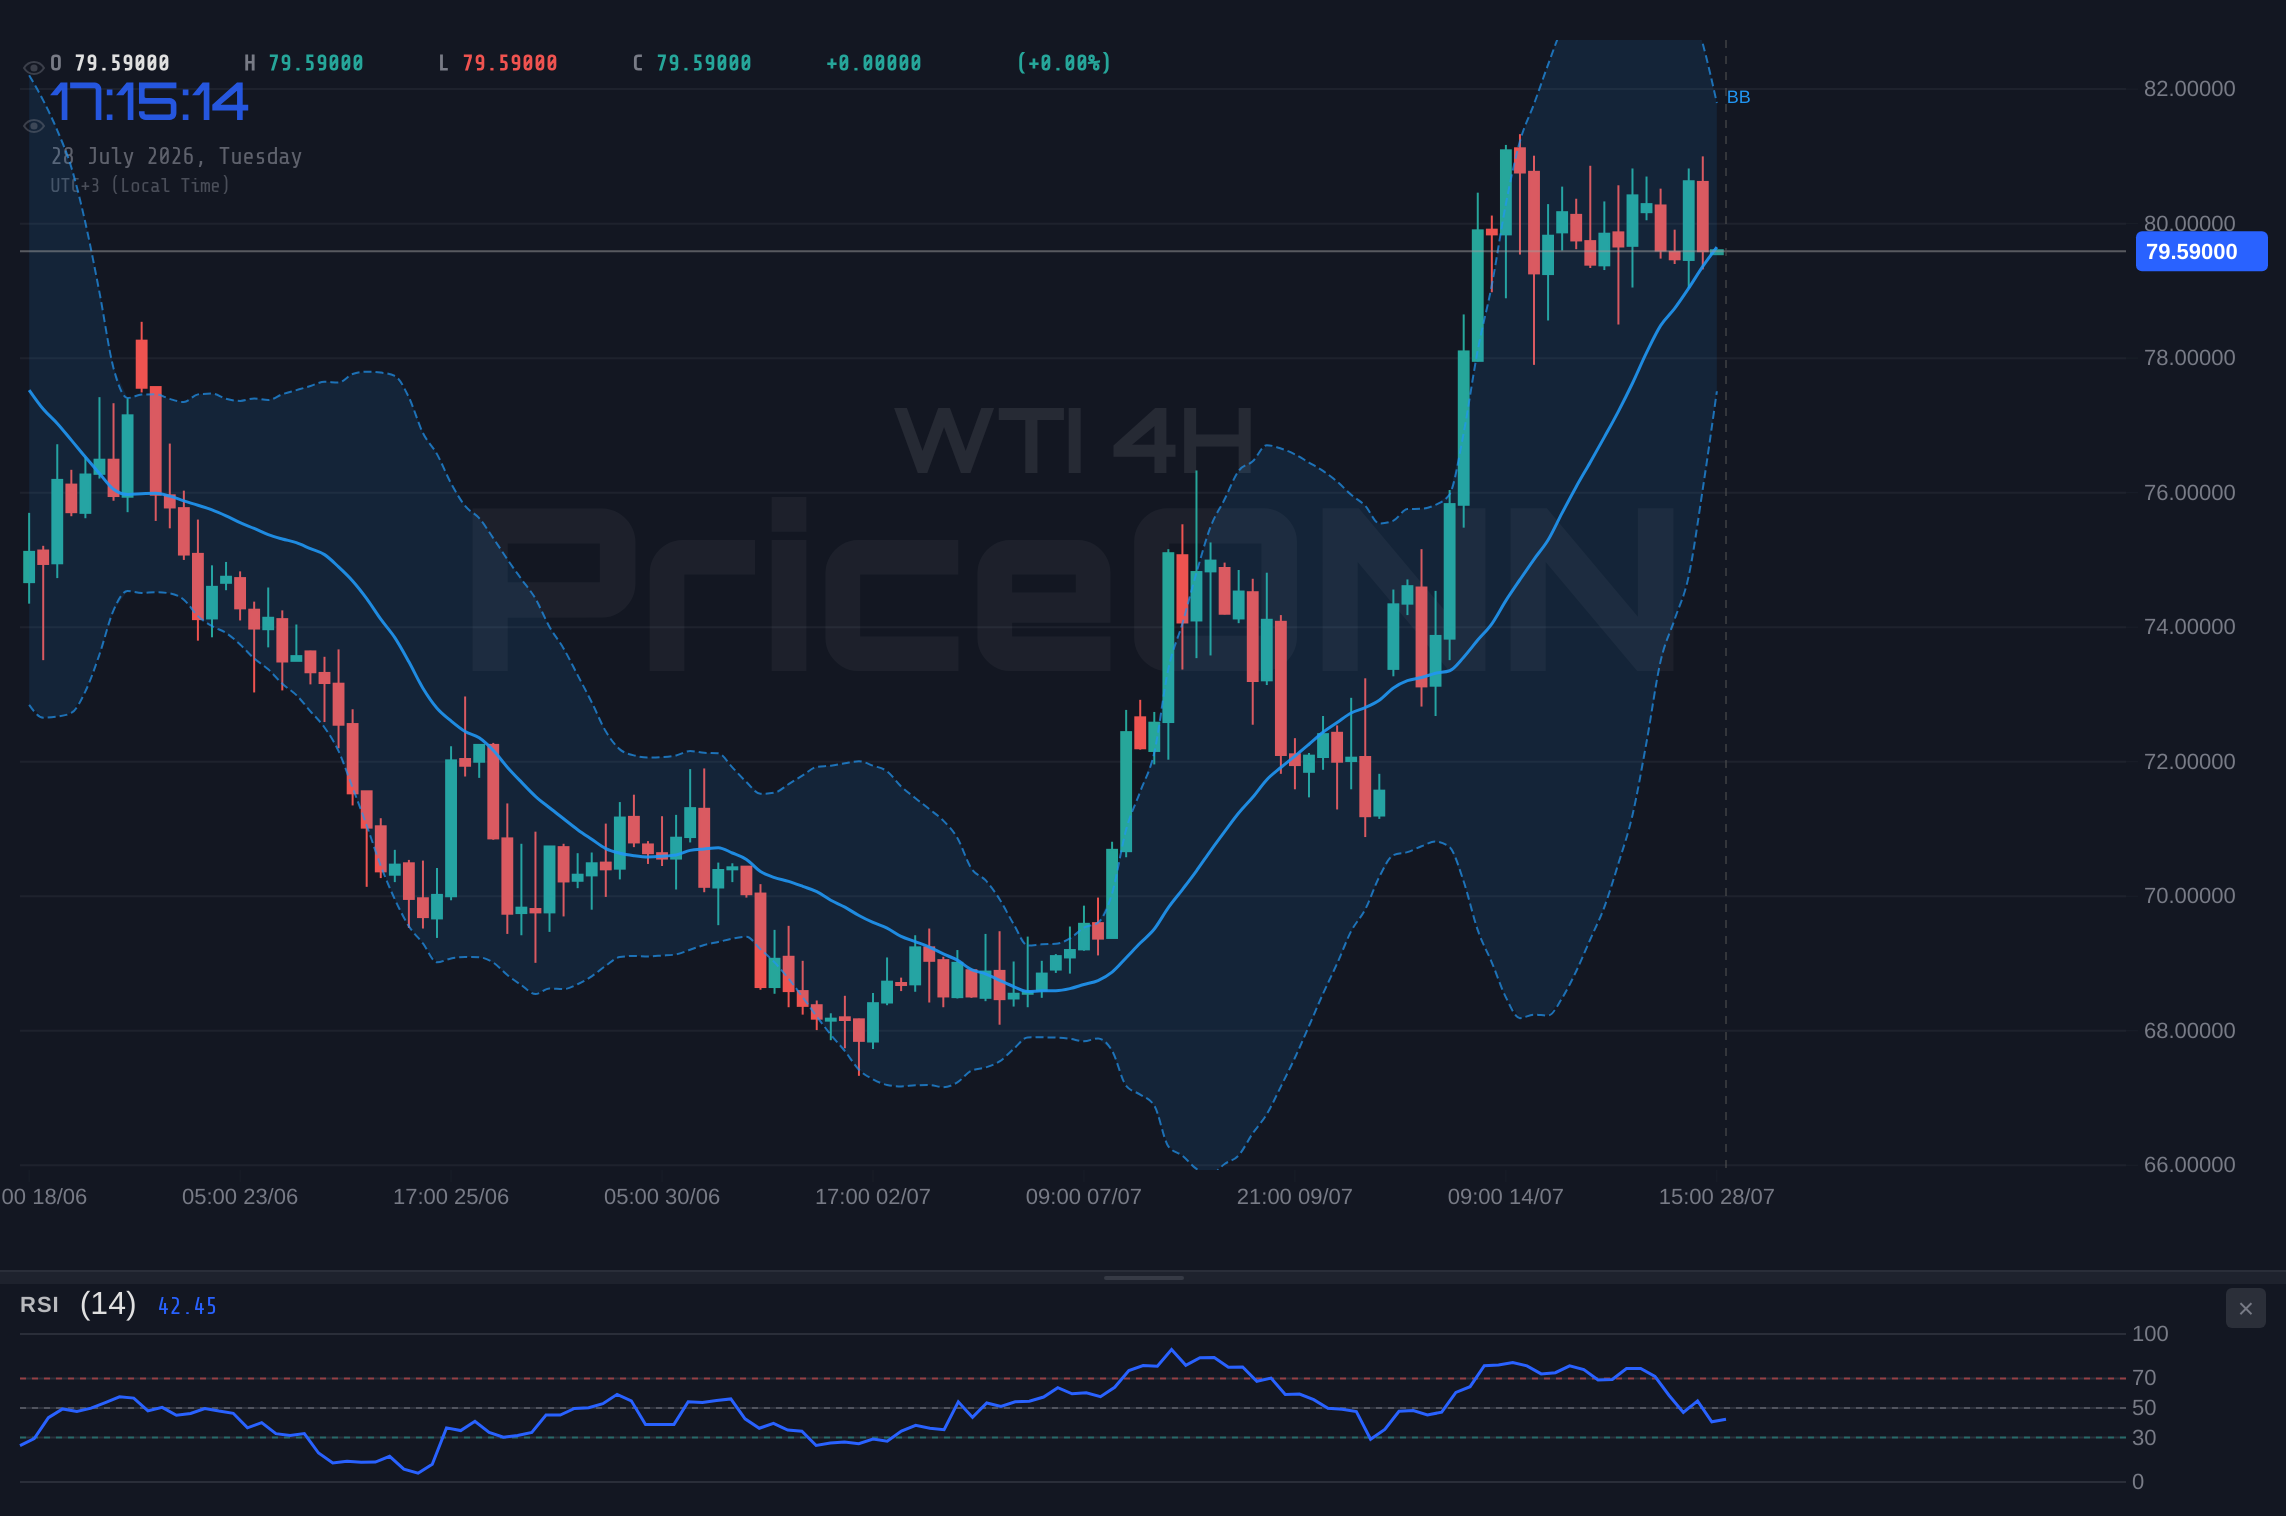
WTI crude oil's retreat to $79.59 presents a critical juncture for market participants. The daily decline of 1.03%, or $0.83, underscores a shift in short-term sentiment. While the 4-hour and daily charts still exhibit some bullish undertones, the immediate 1-hour timeframe is flashing warning signs. The ADX at 10.18 on the 1-hour chart suggests a lack of strong trend conviction in the immediate term, indicating that the current price action might be more range-bound or susceptible to sharp reversals. This is further supported by the Bollinger Bands sitting below the middle band, a classic sign of bearish pressure building. However, the Stochastic Oscillator, with K at 28.74 and D at 52.74, is signaling a potential upward move from oversold territory, creating a conflict with the prevailing bearish momentum indicated by the MACD histogram, which is currently negative.
The interplay between these indicators highlights the uncertainty surrounding WTI's immediate direction. The RSI at 46.91 on the 1-hour chart, while below the 50 level, is not yet in oversold territory, suggesting there could be room for further downside before significant buying pressure emerges. This technical picture demands a cautious approach, focusing on specific price levels to define potential trading strategies. The 1-hour resistance at $80.17 and support at $79.23 become paramount in the intraday trading context. A break and hold above $80.17 could signal a short-term bounce, while a decisive move below $79.23 might accelerate the decline towards lower support levels.
The Dollar's Shadow: DXY and its Impact on Oil
The strength of the US Dollar Index (DXY) is a significant factor influencing WTI's price action. Currently trading at 100.70, the DXY is exhibiting a mixed signal across different timeframes. On the 1-hour chart, the DXY shows a bullish trend with RSI at 56.6 and Stochastic in the overbought zone, suggesting potential upward pressure. However, the 4-hour chart paints a contrasting picture, with RSI at 46.15 indicating bearish momentum and Bollinger Bands below the middle band. The daily chart also leans bearish, with negative MACD momentum. This divergence in DXY signals adds another layer of complexity to WTI's outlook. Generally, a stronger dollar tends to put downward pressure on dollar-denominated commodities like oil, as they become more expensive for holders of other currencies. If the DXY finds sustained strength, particularly from its 1-hour bullish signals, it could exacerbate the selling pressure on WTI.
Conversely, if the bearish signals on the DXY's 4-hour and daily charts begin to dominate, it could provide some relief for oil prices. The current DXY price of 100.70 is a key level to watch. A decisive break above 100.86 on the 4-hour chart would reinforce the bullish dollar narrative, potentially pushing WTI lower. Conversely, a close below 100.37 on the 4-hour chart could signal a dollar pullback, offering a potential tailwind for oil prices. This correlation analysis is vital for understanding the broader market forces at play and for anticipating potential shifts in WTI's trajectory. Traders must monitor the DXY closely, as its movements can significantly amplify or counteract other market drivers impacting crude oil.
Broader Market Sentiment: Equities and Risk Appetite
The performance of major stock indices like the S&P 500 and Nasdaq 100 provides crucial insights into overall market risk appetite, which often correlates with commodity prices. The S&P 500 is currently trading at 6572.87, showing a 0.74% daily gain, suggesting a degree of risk-on sentiment in the broader equity market. However, the technical indicators on the S&P 500 present a mixed picture. The 1-hour chart shows a bullish trend with a strong ADX of 49.72, yet the RSI is in overbought territory at 70.95, hinting at potential consolidation or a pullback. The 4-hour chart also leans bullish, but the daily chart is decidedly bearish, with RSI at 45.35 and a strong downward trend indicated by ADX 47.51.
The Nasdaq 100, on the other hand, is showing more pronounced weakness, trading down 1.16% at 29164.86. Its 1-hour and 4-hour charts are firmly in bearish territory, with RSI readings below 40. This divergence between the S&P 500's intraday strength and the Nasdaq's more significant decline suggests caution. A broad risk-off sentiment, if it takes hold, could spill over into commodities, including WTI. The recent news about Bitcoin joining the tech selloff due to fears surrounding Nvidia and AI trade could be an early indicator of a broader risk-off move. If equity markets continue to decline, especially the tech-heavy Nasdaq, it would likely increase demand for safe-haven assets and put further pressure on riskier commodities like oil. Therefore, monitoring the equity markets' reaction to the DXY and inflation data is as important as analyzing oil's own technicals.
The Bull's Roadmap: Scenarios for Upside Potential
Despite the current bearish signals on the 1-hour chart, a bullish scenario for WTI crude oil remains plausible, particularly if key resistance levels are decisively breached. The primary trigger for a bullish reversal would be a sustained move above the immediate 1-hour resistance at $80.17. Confirmation would come from holding this level, followed by a break above the next resistance at $80.43. The 4-hour chart offers a more optimistic view, with its trend strength at 50% and Stochastic showing an upward signal. If WTI can consolidate above $80.43, the next significant upside target becomes the 4-hour resistance at $81.29. A decisive break and close above this level, supported by improving risk appetite in equity markets and a weakening DXY, could open the door for a move towards the $81.94 resistance, and potentially even higher towards the $83.44 level identified on the 1-hour chart.
The daily chart, while showing a strong downtrend with ADX at 39.16, does have MACD and Stochastic indicators suggesting some underlying buying pressure or potential for a bounce. For a sustained bullish trend to emerge, WTI would need to overcome the daily resistance levels, starting with $85.64. This would likely require a significant shift in market fundamentals, such as unexpected supply disruptions or a surge in global demand expectations. However, in the short to medium term, the focus remains on the intraday and 4-hour levels. A bullish scenario would be invalidated if WTI fails to hold the $79.23 support and breaks decisively below it, signaling a continuation of the bearish momentum.
Bullish Scenario: The Bounce Back
35% ProbabilityThe Bear's Grip: Scenarios for Further Downside
The bearish scenario appears to be the most immediate threat, given the current 1-hour technical signals and the broader context. The immediate trigger for further downside would be a failure to hold the 1-hour support at $79.23. A decisive break below this level, especially on increasing volume, could accelerate the decline towards the next support at $78.97, and then towards the 4-hour support at $78.38. The daily chart's strong ADX of 39.16 and bearish MACD momentum lend credence to this scenario. If the DXY continues its upward trajectory, as suggested by its 1-hour signals, it would add further pressure on WTI prices.
Furthermore, if the broader equity markets, particularly the Nasdaq, experience a significant selloff, it could trigger a flight to safety, impacting oil negatively. The news regarding Nvidia and potential circular financing issues, coupled with the general tech selloff, suggests that risk sentiment could sour quickly. In such an environment, WTI could easily retest its lower support levels. The 4-hour chart shows support at $77.73, and a break below this could signal a more substantial move lower. The daily chart's next major support is at $76.63. This bearish thesis would be invalidated if WTI manages to reclaim and hold above the $80.17 resistance level, signaling a potential shift back towards a more neutral or bullish stance.
Bearish Scenario: The Slide Continues
55% ProbabilityThe Waiting Game: Consolidation and Range-Bound Dynamics
A neutral scenario, characterized by range-bound trading, is also a distinct possibility, especially given the conflicting signals across different timeframes and indicators. The weak ADX readings on the 1-hour and daily charts (10.18 and 29.46 respectively, though the daily ADX is stronger) suggest that a strong directional trend has not yet firmly established itself. Price could oscillate between the immediate support and resistance levels, creating a choppy trading environment. In this scenario, WTI might struggle to decisively break either the $79.23 support or the $80.17 resistance, leading to sideways movement.
This consolidation could occur as the market awaits clearer fundamental catalysts. Upcoming economic data releases, such as inflation reports or central bank policy cues, could provide the necessary impetus for a breakout. Geopolitical developments in the Middle East also play a crucial role; any escalation or de-escalation of tensions could dramatically shift the market's focus and trigger a directional move. Until such a catalyst emerges, traders might see WTI confined within the range defined by the current intraday support and resistance. This phase could be characterized by lower trading volumes and a lack of clear directional conviction, making it challenging for trend-following strategies but potentially offering opportunities for range-bound traders focusing on the intraday levels.
Neutral Scenario: Range-Bound Uncertainty
10% ProbabilityThe Verdict: What's Most Likely?
Considering the immediate technical readings, the bearish scenario holds the highest probability at 55%. The 1-hour chart, which often dictates short-term price action, is exhibiting clear bearish signals with RSI below 50, MACD negative momentum, and Bollinger Bands suggesting downward pressure. The confirmation of a strong trend on the 1-hour ADX at 29.09, despite the weak overall trend reading on the same timeframe, indicates that bearish momentum is present. Furthermore, the potential for a strengthening US Dollar, as indicated by its 1-hour bullish signals, and a souring risk appetite in equity markets, could amplify selling pressure on WTI. The breakdown below the $79.23 support level is the key trigger to watch for this scenario to unfold, potentially leading WTI towards the $77.73 level.
However, the presence of conflicting signals, especially on the 4-hour and daily charts, means the bullish scenario cannot be entirely dismissed. The Stochastic oscillator's upward signal on the 1-hour chart, and the presence of bullish signals on the 4-hour and daily charts for WTI (despite their overall trend strength), suggest that a bounce is possible if key resistance levels are overcome. The probability assigned to the bullish scenario is 35%. The neutral scenario, with a 10% probability, represents a holding pattern where the market awaits clearer direction. The immediate focus should be on the $79.23 support level. A breach here would strongly favor the bearish outlook. Conversely, a decisive close above $80.17 could shift the odds towards a short-term bullish correction.
| Indicator | Value | Signal | Interpretation |
|---|---|---|---|
| RSI (1H) | 46.91 | Bearish | Below 50, indicating downward momentum. |
| MACD (1H) | Negative | Bearish | Negative histogram, below signal line. |
| Stochastic (1H) | K:28.74, D:52.74 | Bearish | %K |
| ADX (1H) | 10.18 | Neutral | Weak trend, lacks conviction. |
| RSI (4H) | 58.47 | Bullish | Above 50, suggesting upward momentum. |
| MACD (4H) | Negative | Bearish | Negative histogram, below signal line. |
| Stochastic (4H) | K:58.32, D:60.98 | Bearish | %K |
| ADX (4H) | 30.49 | Bullish | Strong uptrend, despite recent pullback. |
What I'm Watching This Week
The immediate focus for WTI traders will be the price action around the $79.23 support level on the 1-hour chart. A confirmed break below this level, especially if accompanied by increased volume and a strengthening DXY, would significantly increase the probability of the bearish scenario unfolding. Key triggers to monitor include:
1. DXY Movement: A sustained push above 100.73 on the 1-hour DXY chart could signal further dollar strength, pressuring WTI. Conversely, a break below 100.54 might offer WTI some respite.
2. Equity Market Reaction: Watching the S&P 500 and Nasdaq 100 for signs of a broader risk-off move. A continued decline in these indices, particularly the Nasdaq, could negatively impact oil prices.
3. Geopolitical Developments: Any significant news regarding the Middle East or major central bank policy shifts could override technicals and trigger a sharp move. The recent reports about potential US-Iran truce talks, while offering some downside potential for oil, remain a fluid situation.
The current technical setup on the 1-hour chart suggests caution is warranted. While the 4-hour and daily charts offer some hope for eventual recovery, the immediate path of least resistance appears to be downwards. Traders should remain vigilant for a decisive break of the $79.23 support level as confirmation of further downside. Alternatively, a strong close above $80.17 could signal a short-term bounce, but would require confirmation from higher timeframes to be considered a trend reversal.
Frequently Asked Questions: WTI Analysis
What happens if WTI breaks below the $79.23 support level today?
A break below $79.23 on the 1-hour chart, especially with increased volume, would likely signal further downside. This could trigger a move towards the next support at $78.97, and potentially accelerate towards the 4-hour support at $78.38, aligning with the bearish scenario.
Should I consider buying WTI at current levels around $79.59 given the mixed signals?
Buying at current levels is speculative given the bearish 1-hour signals and the potential for further downside. A more prudent approach would be to wait for confirmation, such as a clear break above $80.17 resistance or a test of lower support levels like $78.38, depending on your risk tolerance and strategy.
Is the RSI at 46.91 on the 1-hour chart a sell signal for WTI right now?
An RSI of 46.91 on the 1-hour chart is below 50, indicating bearish momentum rather than an oversold condition. While not a direct sell signal in isolation, it supports the view that downward pressure is present and further declines are possible before any significant oversold bounce.
How will the strengthening DXY at 100.70 affect WTI's price this week?
A stronger US Dollar generally puts downward pressure on dollar-denominated commodities like WTI. If the DXY continues its upward trend, particularly on the 1-hour chart, it could exacerbate selling pressure on oil, potentially pushing WTI towards its lower support levels.
Track markets in real-time
AI-powered analysis, technical indicators and real-time price data.
Join Our Telegram Channel
Breaking market news, AI analysis and trading signals instantly.
Join Channel