

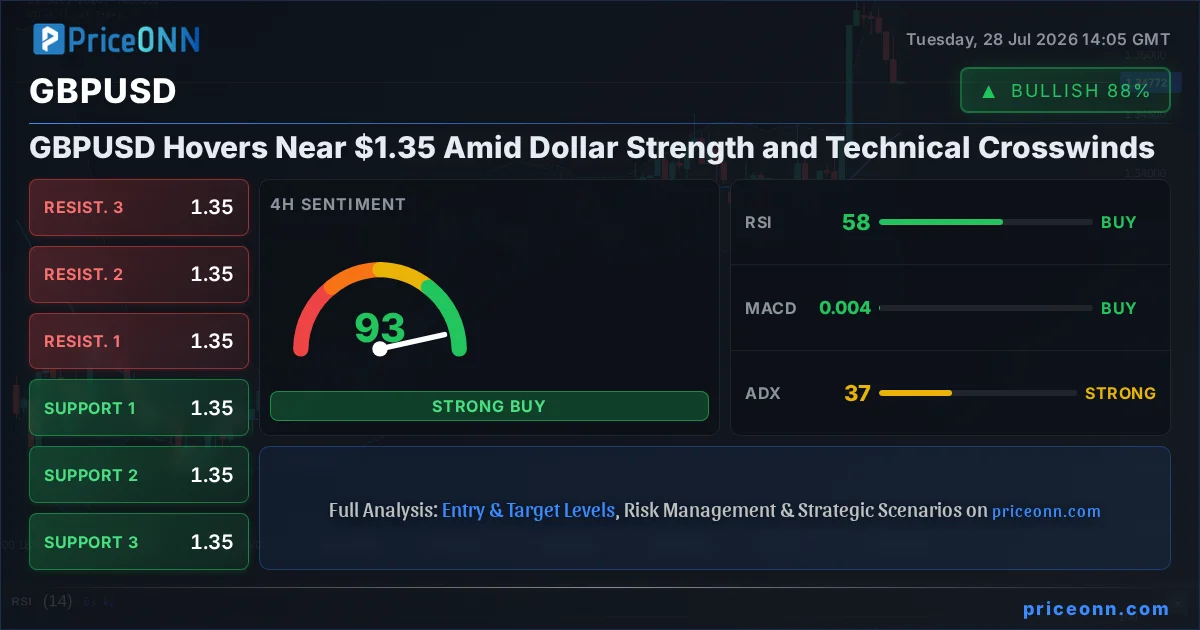
Having tracked GBPUSD through a period of significant volatility, the current price action around $1.3477 presents a compelling narrative of competing forces. The US Dollar Index (DXY) is showing renewed strength, currently trading around 100.70, which typically casts a shadow over major currency pairs like the British Pound. However, the picture for GBPUSD is far from straightforward, with technical indicators flashing a complex array of signals across different timeframes. This isn't just a simple tug-of-war; it's a nuanced battle where the bulls and bears are locked in a delicate dance, and understanding the precise levels and conditions is paramount for any serious trader right now.
- RSI at 41.45 on the 1H chart signals bearish momentum, while the 4H and 1D charts show RSI at 58.41 and 59.83 respectively, indicating a more neutral to bullish sentiment.
- Critical support for GBPUSD sits at $1.3477, tested multiple times this week, while key resistance looms around $1.3543.
- The ADX indicator presents conflicting trends: strong bearish on 1H (26.22), strong bullish on 4H (36.73), and weak on 1D (18.43), highlighting market indecision.
- DXY strength around 100.70 is a headwind, but upcoming economic data releases and central bank divergence could shift the balance for GBPUSD.
Navigating the Dollar's Resurgence
The US Dollar Index (DXY) has been a dominant force in recent trading sessions, pushing higher towards the 100.70 mark. This upward momentum in the dollar often translates into downward pressure on other major currencies, and GBPUSD is no exception. A stronger dollar makes it more expensive for holders of other currencies to acquire USD-denominated assets, including US Treasuries and equities, potentially leading to capital outflows from non-dollar assets. The fact that DXY is showing positive momentum, with its 1-hour trend described as neutral but with a strong trend reading on the ADX at 27.71, suggests that the dollar’s influence is a significant factor that cannot be ignored. This dollar strength acts as a persistent headwind for GBPUSD, making any upside attempts more challenging. Investors are closely watching the DXY's ability to sustain this strength, as a decisive break above key resistance levels could exacerbate selling pressure on the pound.
The correlation between the DXY and GBPUSD is a well-established dynamic in the forex market. Historically, when the dollar strengthens, GBPUSD tends to fall, and vice versa. With the DXY currently trading near 100.70, the immediate technical picture for GBPUSD suggests a bearish bias, especially on shorter timeframes. The 1-hour RSI at 41.45 clearly indicates a lack of buying enthusiasm, while the MACD is printing negative momentum, and Stochastic is deep in oversold territory at 2.33% K and 12% D. This confluence of bearish indicators on the 1-hour chart paints a picture of immediate selling pressure, suggesting that any rallies might be short-lived unless broader market conditions shift dramatically.
Technical Crosscurrents on the Charts
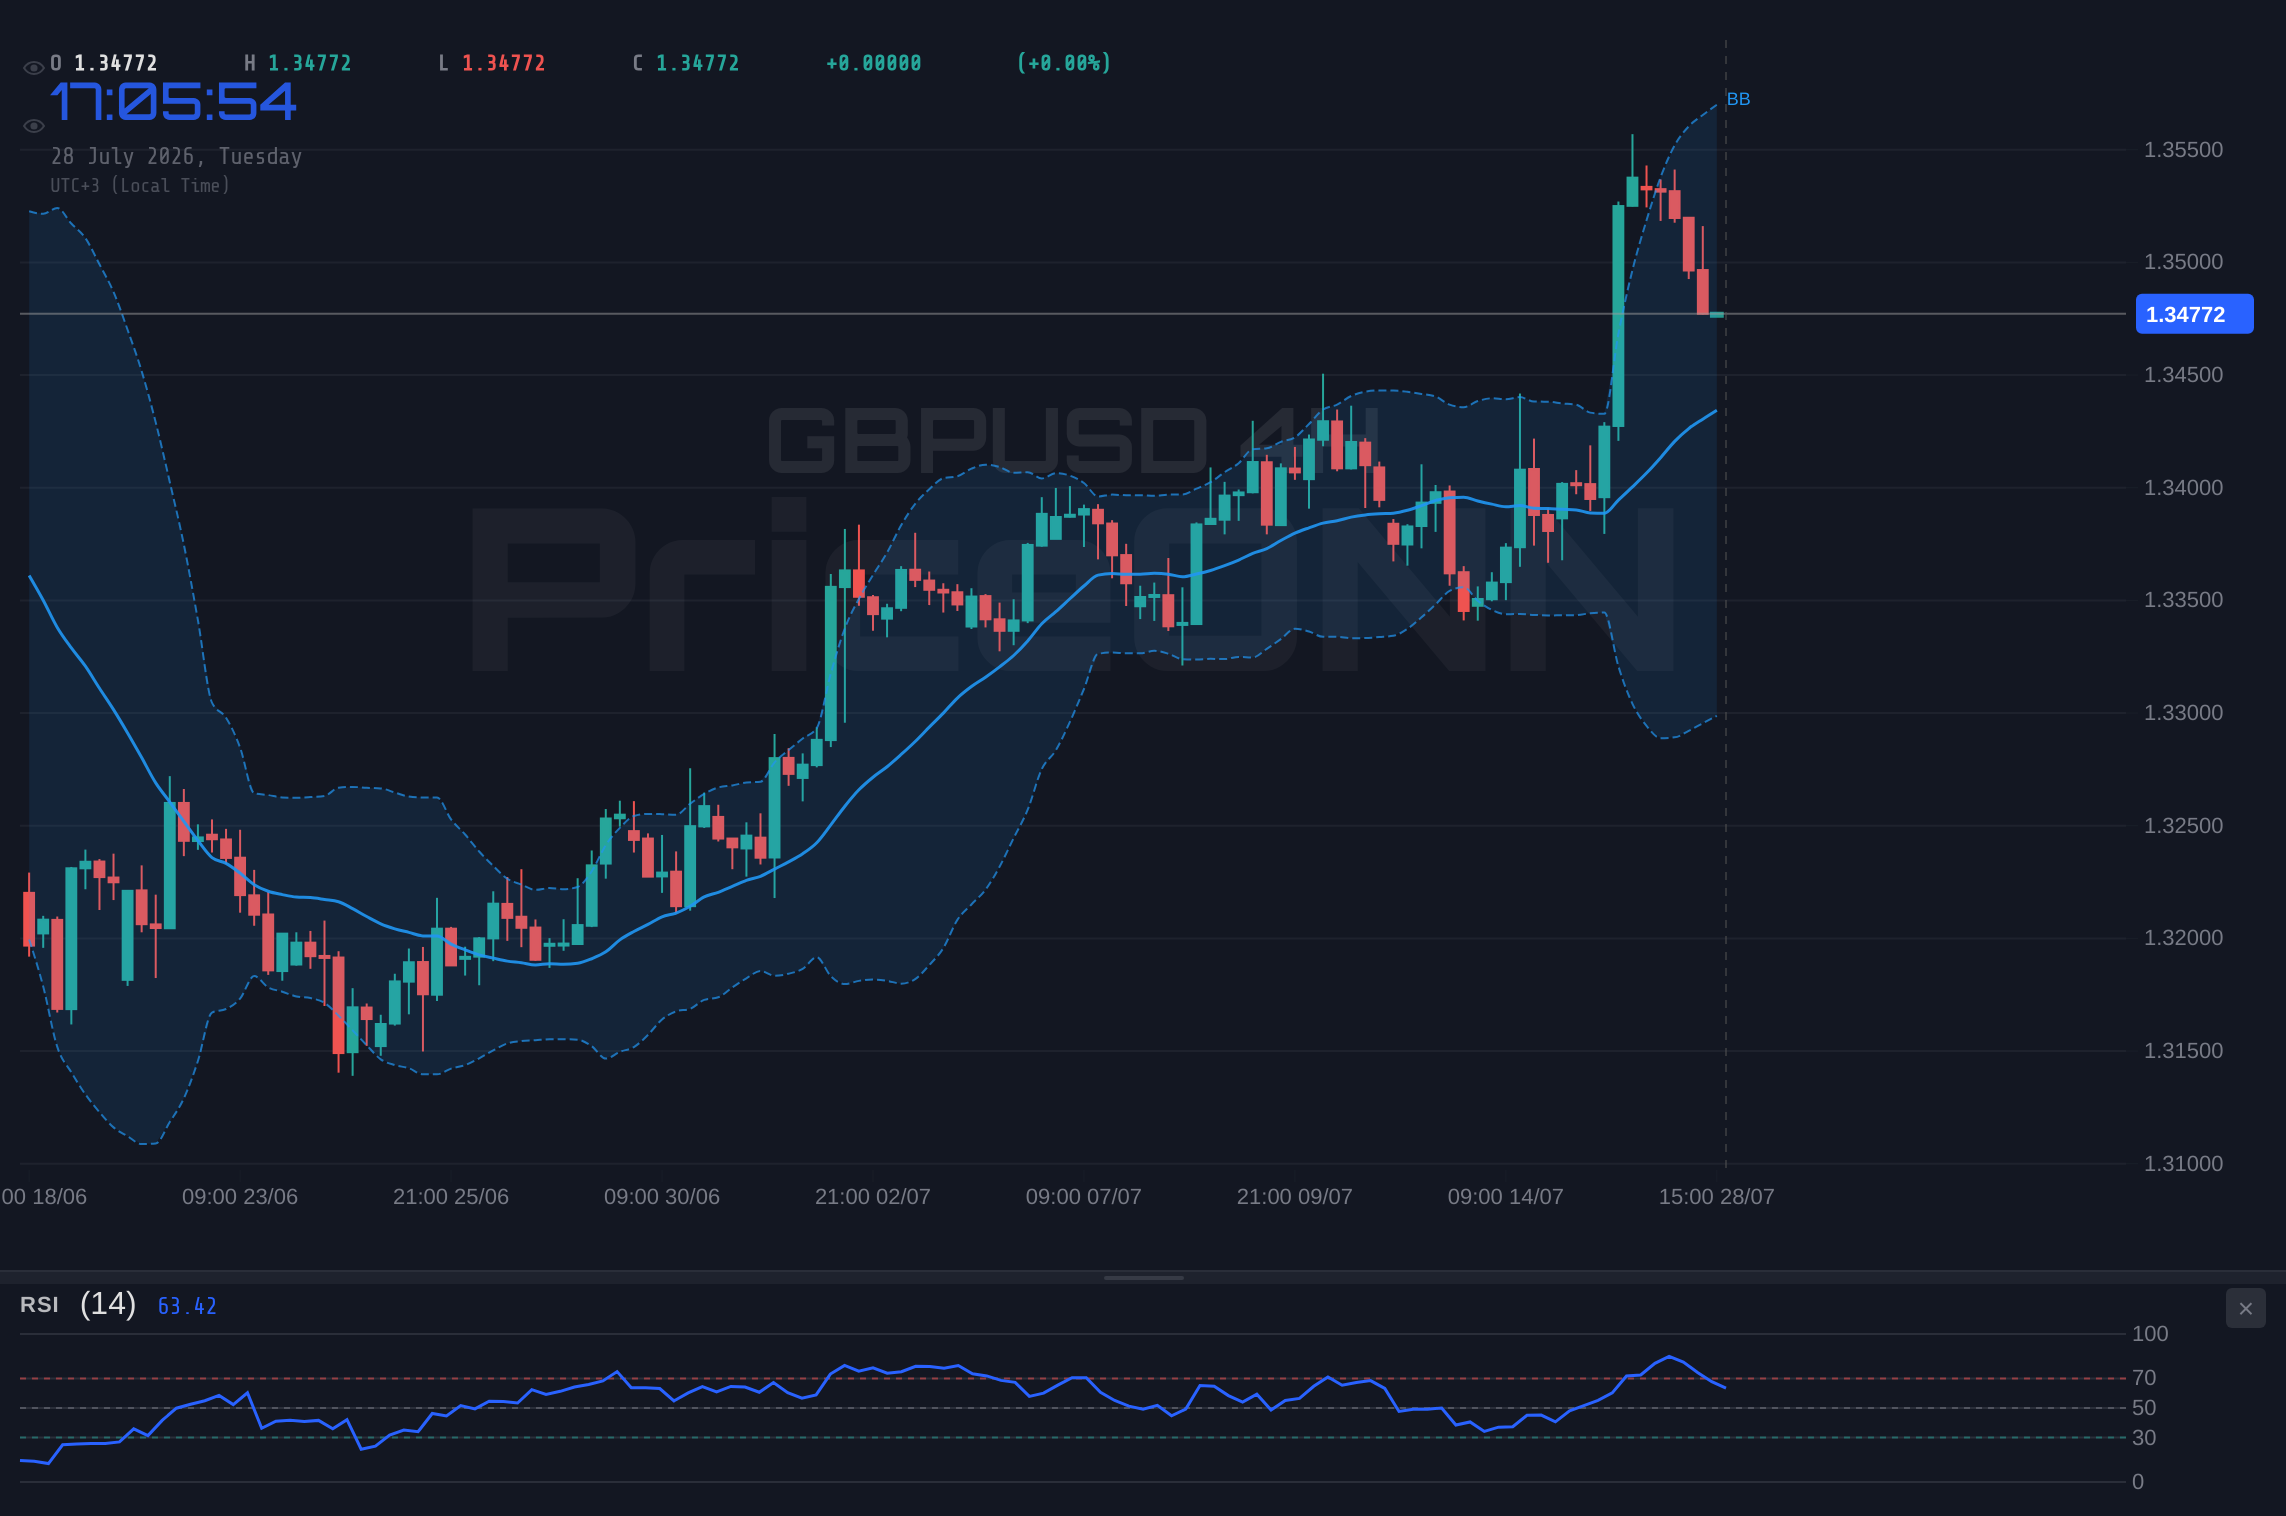
Diving deeper into the technicals, the GBPUSD pair presents a fascinating study in conflicting signals across different timeframes. On the 1-hour chart, the trend is deemed neutral with a strong bearish trend reading from the ADX at 26.22. The RSI is hovering at 41.45, indicating a bearish lean, and the Stochastic oscillator is deeply oversold at 2.33% K and 12% D, suggesting a potential for a short-term bounce. However, this picture starkly contrasts with the 4-hour and daily charts. The 4-hour timeframe shows a neutral trend with a strong bullish trend strength indicated by the ADX at 36.73. Here, the RSI is at a more robust 58.41, and while Stochastic is showing a bearish crossover, the overall momentum appears to be building for a potential upward move. The daily chart reinforces this more optimistic view, with a neutral trend but a strong bullish ADX reading of 18.43, RSI at a healthy 59.83, and Stochastic indicating a bullish signal with %K at 73.75 and %D at 76.02.
This divergence across timeframes is precisely where the market gets interesting. The short-term bearish signals on the 1-hour chart could be interpreted as noise within a larger, potentially bullish trend developing on the higher timeframes. Traders looking for short-term opportunities might be tempted to fade rallies, anticipating a move towards the 1-hour support level of $1.34725. However, those with a longer-term perspective might view these 1-hour dips as buying opportunities, especially if the price holds above the key daily support at $1.3418. The critical takeaway here is that the immediate direction is uncertain, and confirmation from higher timeframes will be crucial for establishing a conviction trade.
The Battle at Key Levels
The current price of $1.3477 places GBPUSD precariously close to significant support levels. On the 1-hour chart, the immediate support is identified at $1.34772, followed by $1.34725 and then $1.34661. A break below these levels, particularly the $1.34661 mark, could trigger further selling pressure, aligning with the bearish sentiment on the shorter timeframe. Conversely, resistance on the 1-hour chart is seen at $1.34883, $1.34947, and $1.34994. A sustained move above $1.3500 would begin to challenge the immediate bearish narrative.
Looking at the daily levels, the picture becomes clearer about the broader range. Support is situated at $1.3418, $1.32983, and $1.32289. These are substantial levels that, if breached, would signal a significant shift in sentiment. On the resistance side, we have $1.36071, $1.36765, and $1.37962. The current price of $1.3477 is nestled between these broader levels, highlighting the consolidation phase. The fact that the 4-hour ADX is strong at 36.73 suggests that a trend *could* be building, but the weak 1D ADX at 18.43 indicates a lack of commitment from the market. This is a classic scenario where traders need to wait for a clear breakout or breakdown confirmation.
Indicator Conundrums and Trend Strength
The ADX, or Average Directional Index, is particularly telling here. On the 1-hour chart, ADX is 26.22, suggesting a strong trend, which aligns with the bearish sentiment. However, the 4-hour ADX jumps to 36.73, indicating a very strong trend, but this time in a bullish direction according to the other indicators on that timeframe. The daily ADX then drops to a weak 18.43, implying a lack of trend strength on the longest timeframe. This is a prime example of indicator conflict. A strong ADX reading on the 4-hour chart (36.73) suggests that if a trend is to emerge, it will likely be sustained. The question is, which direction will it take? The current price action, hovering near $1.3477, suggests the market is undecided, waiting for a catalyst to break the stalemate.
The Stochastic oscillator offers another layer of complexity. On the 1-hour chart, it's deeply oversold at 2.33% K and 12% D, hinting at a potential bounce. Yet, on the 4-hour chart, it shows a bearish crossover (18.51% K, 31.25% D for XAGUSD, but for GBPUSD it's K=67.1, D=83.37), suggesting a pullback. The daily Stochastic, however, is firmly in bullish territory with a crossover (73.75% K, 76.02% D). This conflicting information means that relying solely on one indicator is a recipe for disaster. A trader must seek confluence across multiple indicators and timeframes, or wait for a clear breakout above resistance or breakdown below support to gain conviction.
Macroeconomic Undercurrents and Geopolitical Whispers
Beyond the charts, macroeconomic factors and geopolitical developments are always at play. The strength of the US Dollar, driven by various factors including interest rate differentials and safe-haven demand, is a primary driver for GBPUSD. Recent news indicates that the European Central Bank (ECB) might be leaning towards further rate hikes, as suggested by ECB Governing Council member Peter Kazimir, who argued for at least one more hike. This hawkish stance from the ECB could provide some underlying support for the Euro, and by extension, indirectly influence GBPUSD through cross-currency dynamics. However, the immediate pressure remains on the pound due to dollar strength.
Furthermore, the lingering inflation concerns, particularly with rising oil prices, add another layer of complexity. While recent news suggests some easing of Middle East tensions and falling oil prices, the market remains sensitive to any geopolitical flare-ups. The report mentioning Standard Chartered's view that oil markets must now price two Middle East chokepoints underscores the persistent risk premium in energy markets. This can indirectly impact inflation expectations and central bank policy, creating ripples across all asset classes, including forex. For GBPUSD, this means that any geopolitical escalation could strengthen the dollar as a safe haven, or conversely, if it leads to a significant drop in oil prices, it might reduce inflation fears, potentially softening the dollar.
Trading Scenarios: Charting the Path Forward
Given the conflicting signals and the current price hovering near $1.3477, it's crucial to map out potential scenarios. The market appears to be consolidating, waiting for a clear catalyst. The upcoming economic calendar, while not explicitly detailed here for GBPUSD, will undoubtedly play a role. Traders will be scrutinizing any data releases that could influence the Bank of England's or the Federal Reserve's future policy decisions. Understanding these potential shifts is key to navigating the current choppy waters.
Bearish Scenario: Dollar Dominance Prevails
65% ProbabilityNeutral Scenario: Range-Bound Consolidation Continues
25% ProbabilityBullish Scenario: Sterling Reclaims Ground
10% ProbabilityThe Path Forward: Patience and Precision
Right now, the market is at a critical juncture. The 1-hour chart screams caution, suggesting a potential dip towards the $1.34661 support. However, the higher timeframes, particularly the 4-hour and daily charts, hint at underlying strength and a potential for a move higher, especially if key resistance levels are breached. The ADX readings are particularly confusing, showing strong trends in opposing directions across different timeframes. This suggests that while a trend might be trying to establish itself, it lacks broad consensus across all market participants and time horizons.
For the active trader, this environment calls for extreme patience and precision. Chasing the price on the 1-hour chart could lead to getting caught on the wrong side if the higher timeframe trend takes hold. Conversely, blindly buying into the higher timeframe bullish signals without observing short-term confirmation could lead to premature entries. The most prudent approach appears to be waiting for a clear signal: either a decisive break below the $1.34661 support, confirming the bearish short-term outlook, or a strong move and sustained price action above the $1.3500 handle, paving the way for a test of higher daily resistance levels like $1.35679. Until then, managing risk and waiting for a clearer setup is the name of the game.
Frequently Asked Questions: GBPUSD Analysis
What happens if GBPUSD breaks below the $1.34661 support level?
A break below $1.34661 on the 1-hour chart would likely confirm the bearish momentum seen on shorter timeframes, potentially triggering further downside towards the $1.34383 support level. This would align with the prevailing dollar strength narrative.
Should I consider buying GBPUSD near the current $1.3477 levels given the mixed signals?
Buying at current levels carries significant risk due to conflicting indicators. A more prudent approach would be to wait for confirmation, such as a sustained move above $1.3500, or a clear bounce from a lower daily support level like $1.3418. A 65% probability scenario suggests downside risk from current levels.
Is the RSI at 41.45 on the 1-hour chart a sell signal for GBPUSD?
An RSI reading of 41.45 on the 1-hour chart indicates bearish momentum but is not yet in oversold territory. While it leans bearish, it should be considered alongside other indicators and timeframes; the daily RSI at 59.83 suggests a more neutral to bullish underlying sentiment.
How might the DXY strength around 100.70 impact GBPUSD this week?
The current DXY strength creates headwinds for GBPUSD, potentially capping upside moves and increasing the risk of a breakdown towards support levels. However, upcoming central bank policy divergence, such as potential further hikes from the ECB, could offer some counter-balance if it weakens the dollar's overall advance.
Track markets in real-time
AI-powered analysis, technical indicators and real-time price data.
Join Our Telegram Channel
Breaking market news, AI analysis and trading signals instantly.
Join Channel