

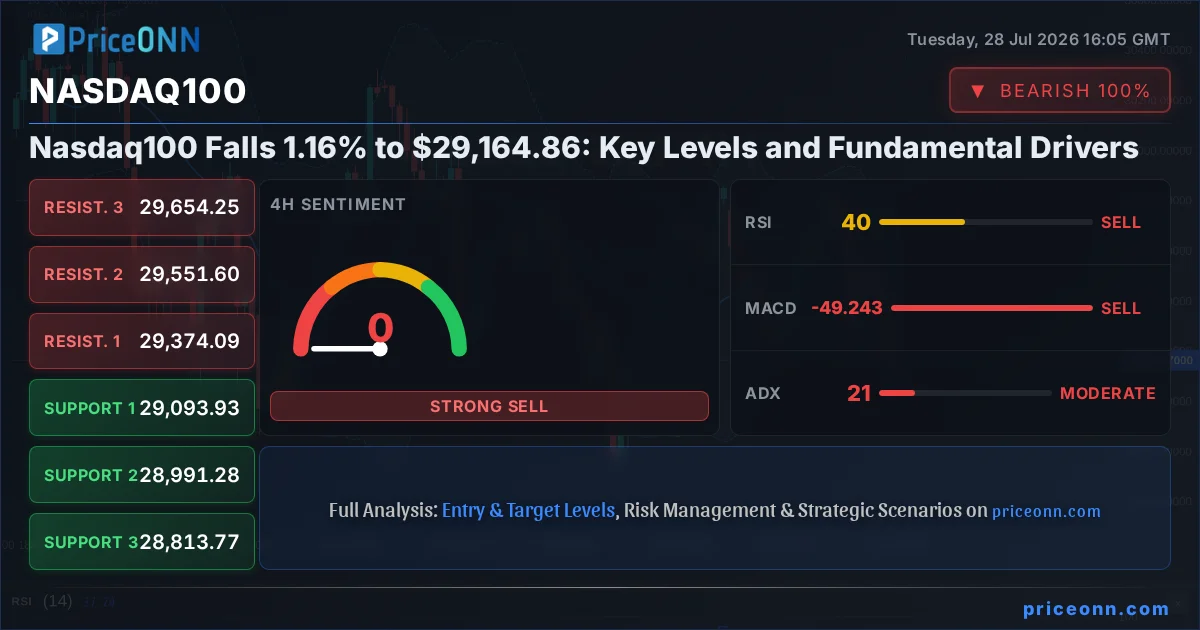
The Nasdaq100 index experienced a significant downturn, falling 1.16% to trade at $29,164.86. This decline, occurring amidst a strengthening US dollar and a backdrop of mixed economic data, raises questions about the sustainability of recent tech sector rallies. Investors are now closely scrutinizing key technical levels and macroeconomic undercurrents to gauge the next potential move in the tech-heavy index. The interplay between rising yields, inflation concerns, and central bank policy expectations is creating a complex trading environment, demanding a nuanced approach from market participants.
- RSI at 32.77 signals oversold pressure on the 1-hour chart, but the overall trend remains bearish.
- Critical support for the Nasdaq100 sits at $29,135.55, a level tested multiple times this week.
- MACD histogram shows negative momentum, indicating bearish pressure is building.
- The correlation with the rising DXY (currently at 100.7) is putting pressure on the Nasdaq100, reflecting a risk-off sentiment.
The tech-heavy Nasdaq100 index has succumbed to selling pressure, shedding 1.16% to settle at $29,164.86. This move is not happening in a vacuum; it's a confluence of factors including a robust US dollar, renewed inflation jitters, and a cautious stance from central banks. The recent market action suggests that the exuberance seen in the tech sector might be facing headwinds, as investors begin to re-evaluate risk appetite. The index's retreat from its recent highs underscores the volatility inherent in growth-oriented assets, especially when macroeconomic conditions shift.
Looking at the 1-hour chart, the trend is decidedly bearish, with a strength of 92%. This short-term outlook is painting a concerning picture for immediate price action. The immediate support level to watch is $29,135.55, followed by $29,076.62 and $29,010.24. A break below these levels could trigger further downside momentum. On the resistance side, the index faces hurdles at $29,260.86, $29,327.24, and $29,386.17. The RSI(14) is hovering at 32.77, indicating a bearish inclination within the neutral zone, suggesting that while oversold conditions might be present on this very short timeframe, the prevailing sentiment is one of caution rather than outright buying.
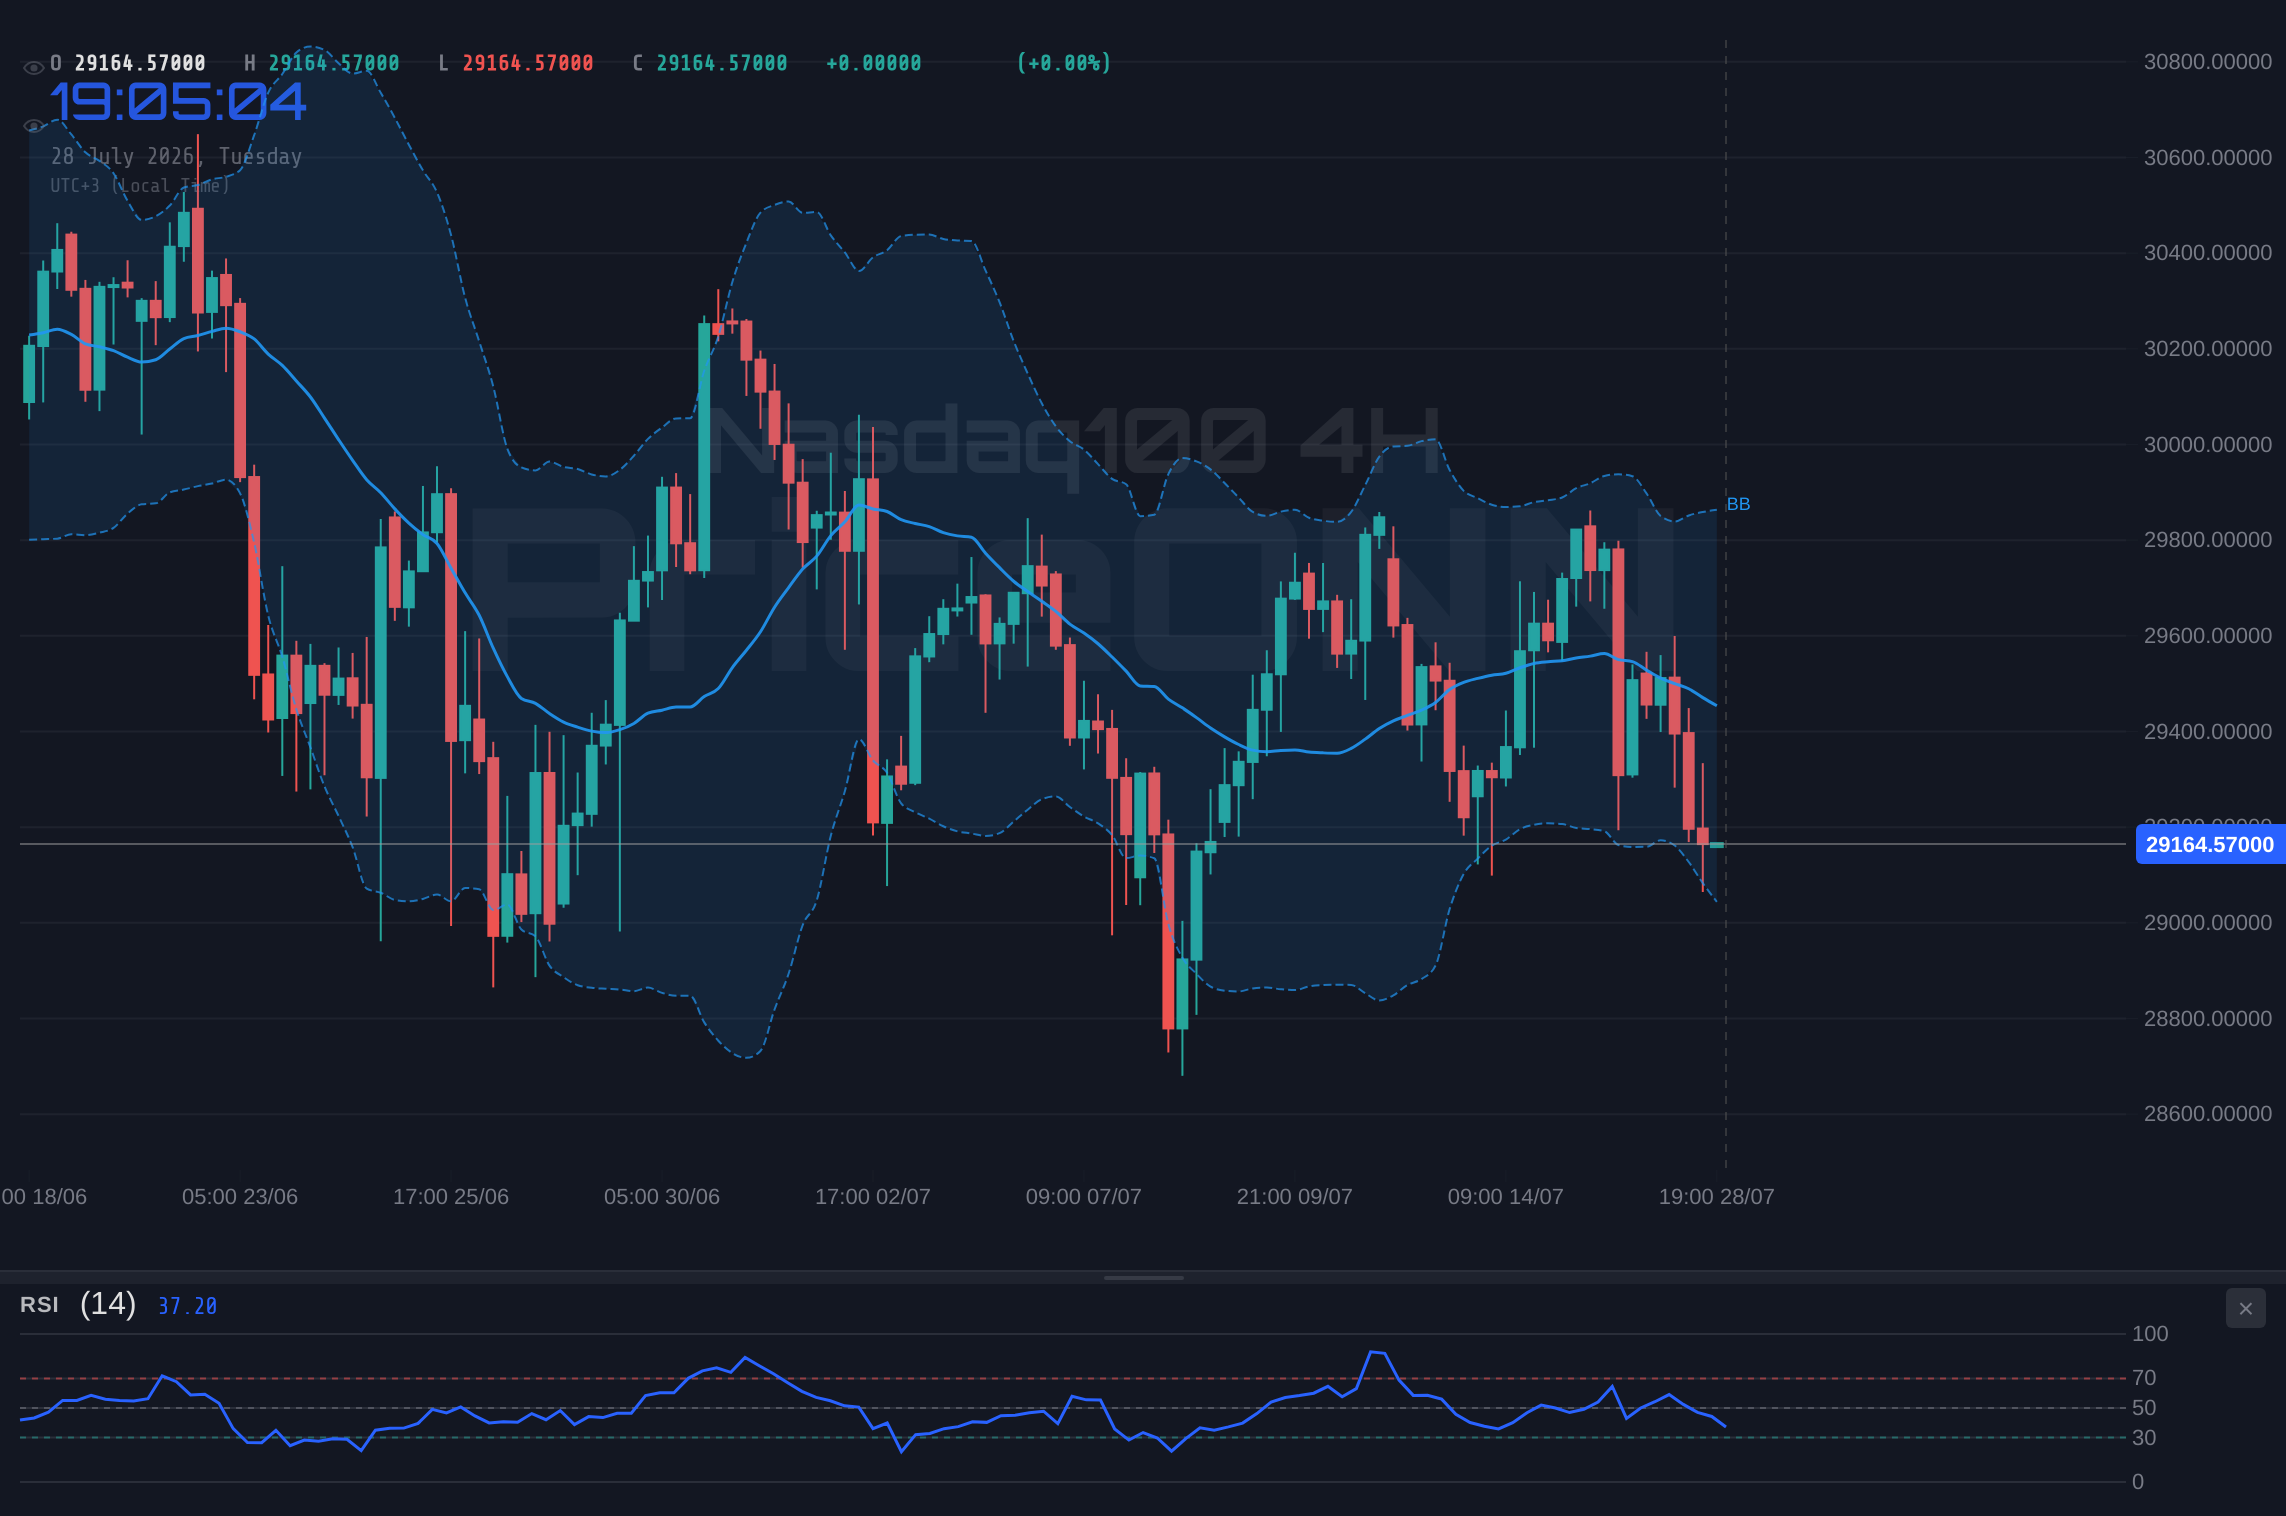
The MACD indicator on the 1-hour chart further reinforces the bearish sentiment, displaying negative momentum with the MACD line positioned below its signal line. This technical reading implies that selling pressure is building, and any upward retracements might be met with renewed selling. The Bollinger Bands also show the price trading below the middle band, a classic sign of bearish momentum. While the Stochastic oscillator (%K at 30.97, %D at 20.52) is flashing a potential buy signal as %K crosses above %D, its position in the lower half of the range tempers immediate bullish expectations. The ADX at 33.23 confirms a strong downtrend on this timeframe, suggesting that the current price action is part of a more significant bearish move.
Shifting to the 4-hour timeframe, the trend is neutral, indicating a period of consolidation or indecision after the sharp sell-off. However, the overall trend strength is still leaning towards a bearish bias at 50%. Support levels are identified at $29,093.93, $28,991.28, and $28,813.77. These are crucial levels that could determine the short-to-medium term direction. Resistance is capped around $29,374.09, $29,551.60, and $29,654.25. The RSI(14) at 39.92 reinforces the bearish sentiment, staying firmly in neutral territory but pointing downwards. The MACD continues to show negative momentum, and the Bollinger Bands remain below the middle band, aligning with the bearish outlook on this timeframe.
The Stochastic oscillator on the 4-hour chart (K=15.62, D=35.37) provides a strong bearish signal, with %K below %D and both in oversold territory, suggesting that selling pressure could intensify. The ADX reading of 21.06 indicates a moderately strong downtrend. While the overall signal for the 4-hour chart leans towards 'SELL' (0 Buy, 8 Sell, 0 Neutral), the neutral trend strength suggests that the market is digesting recent moves. This could lead to a period of sideways trading or a decisive break in either direction based on upcoming economic news or shifts in risk sentiment.
On the daily chart, the Nasdaq100's trend is classified as bearish with a strength of 83%. This longer-term perspective is critical for understanding the broader market dynamics. The significant support levels to monitor are $29,179.85, $28,852.38, and $28,511.31. These are substantial price points that, if breached, could signal a deeper correction. Resistance is formidable, with the nearest hurdle at $29,848.39, followed by $30,189.46 and $30,516.93. The RSI(14) at 46.36 is in neutral territory but trending downwards, indicating room for further declines before becoming oversold. The MACD, however, is showing negative momentum with the MACD line below its signal line, reinforcing the bearish outlook.
The Bollinger Bands on the daily chart are positioned below the middle band, consistent with a bearish trend. The Stochastic oscillator (K=58.96, D=53.46) is showing a rising signal as %K moves above %D, indicating a potential shift towards upward momentum or at least a pause in the selling pressure. However, this bullish signal from Stochastic needs to be viewed with caution given the prevailing bearish trend indicated by other indicators like ADX. The ADX at 15.12 suggests a weak trend, which could imply that the current bearish move might lack conviction or that the market is consolidating before the next major move. The overall signal for the daily chart is 'SELL' (2 Buy, 6 Sell, 0 Neutral), reflecting the dominant bearish sentiment.
The US Dollar Index (DXY) is currently trading at 100.7, showing a positive daily change and a clear upward trajectory. This strength in the dollar is a significant factor weighing on the Nasdaq100. Historically, a rising dollar often correlates with a weakening Nasdaq100, as it makes US assets more expensive for foreign investors and can signal tighter monetary policy or a flight to safety. With the DXY at 100.7, the pressure on growth assets like tech stocks is palpable. This correlation highlights the interconnectedness of global markets and the influence of currency movements on equity indices. The current DXY setup suggests that dollar strength could persist, acting as a drag on the Nasdaq100.
Furthermore, the S&P 500, a broader market index, is also showing signs of weakness, trading at 6572.87 with a daily gain of 0.74% but its 1-day trend is bearish (strength 100%). This divergence and the overall market sentiment point towards a 'risk-off' environment. When major indices like the S&P 500 show bearish signals on the daily timeframe, it often spills over into more growth-sensitive sectors like technology, which are heavily represented in the Nasdaq100. The Nasdaq100 itself has a bearish daily trend, reinforcing the idea that broader market weakness is impacting tech valuations.
The Nasdaq100's recent decline to $29,164.86 is also occurring against a backdrop of concerning economic data releases. Recent news indicates that US consumer confidence fell to 90.8 in July, with expectations remaining below recession thresholds. This weakening consumer sentiment can translate into lower corporate earnings and reduced spending, directly impacting the growth-oriented companies that dominate the Nasdaq100. Additionally, reports of potential inflation surges, coupled with rising oil prices, are keeping central banks on edge. The ECB's stance, with Governing Council member Peter Kazimir suggesting at least one more rate hike and warning of potential further hikes if oil shocks persist, adds to the uncertainty. This hawkish undertone from major central banks generally acts as a headwind for growth stocks.
The correlation between tech stocks and the broader macroeconomic environment cannot be overstated. The recent narrative around Nvidia's expanding circular financing deals and its subsequent impact on the AI trade, as reported by sources like Reuters, serves as a stark reminder of how interconnected market segments are. A sell-off in a key AI bellwether like Nvidia can trigger a domino effect, impacting investor sentiment towards the entire tech sector. This ripple effect is precisely what we're observing in the Nasdaq100's current price action, as fears about company valuations and funding practices resurface.
From a fundamental perspective, the persistent inflation concerns, exacerbated by geopolitical tensions in the Middle East and their impact on oil prices, create a challenging environment for the Federal Reserve. While the Fed might be nearing the end of its hiking cycle, any indication that inflation remains 'stubborn' could lead to prolonged higher interest rates. Higher rates increase the cost of capital for growth companies, reducing their present value and making them less attractive to investors. This is a critical factor for the Nasdaq100, which is heavily weighted towards companies whose valuations are sensitive to discount rates.
The technical picture, with multiple indicators flashing bearish signals across different timeframes, suggests that the Nasdaq100 is vulnerable to further declines. The confluence of negative MACD momentum, RSI trending downwards, and prices trading below Bollinger middle bands on the daily and hourly charts paints a picture of caution. While the Stochastic oscillator offers a glimmer of hope on some timeframes, the overall trend strength, particularly the ADX readings, indicates that bearish momentum is either strong or building. The key is to watch how the index reacts to the immediate support levels; a decisive break could accelerate the downtrend.
The recent price action in gold also provides context. Gold prices traded higher as dollar and yields dipped on US-Iran truce hopes, according to reports. While this might seem counterintuitive to the Nasdaq100's fall, it reflects a broader market sentiment shift. When safe-haven assets like gold are in demand, it often signals increased risk aversion, which is detrimental to growth-oriented tech stocks. The Nasdaq100's decline, therefore, aligns with a broader market move away from riskier assets towards safer havens, a trend that could persist if geopolitical tensions or inflation fears escalate.
The interplay between the Nasdaq100 and its correlated assets is crucial for traders. The strengthening dollar (DXY at 100.7) is a clear headwind. If the DXY continues its upward trend, it will likely exert further pressure on the Nasdaq100. Similarly, the performance of the S&P 500 and Nasdaq100 themselves provides internal market signals. The bearish daily trend of the S&P 500 and the Nasdaq100's own bearish signals on multiple timeframes suggest that the path of least resistance is currently downwards. Understanding these correlations and divergences is key to navigating the current market landscape.
As we look ahead, the economic calendar will be paramount. Upcoming data releases, particularly those related to inflation and employment, will be closely watched by the Federal Reserve and the market. Any indication that inflation is not cooling as expected could lead to a more hawkish stance from the Fed, further pressuring growth stocks. Conversely, signs of a significant economic slowdown or a sharp drop in consumer confidence could prompt a reassessment of Fed policy, potentially offering some relief to indices like the Nasdaq100. The market is currently in a data-dependent mode, making each release critical.
The current price of $29,164.86 for the Nasdaq100 is a critical juncture. While short-term indicators might show some oversold conditions, the dominant bearish trends on the daily and hourly charts, coupled with macroeconomic headwinds and a strong dollar, suggest that further downside is possible. The immediate focus will be on whether the index can hold the $29,135.55 support level. A failure to do so could open the door to a more significant correction, targeting levels closer to $28,852.38. Conversely, a stabilization and a potential bounce from current levels would require a clear shift in market sentiment or supportive economic news.
The market sentiment is clearly shifting. The days of unchecked optimism in the tech sector may be waning as fundamental realities – inflation, interest rates, and geopolitical risks – reassert their influence. While the Nasdaq100 has shown resilience in the past, the current confluence of bearish technical signals and concerning macro-economic data suggests that caution is warranted. Investors should pay close attention to the upcoming economic data releases and the Federal Reserve's commentary for clues on the future direction of monetary policy, which will undoubtedly shape the trajectory of the Nasdaq100 in the coming weeks.
Ultimately, navigating this market requires discipline and a clear understanding of the risk factors at play. The Nasdaq100 at $29,164.86 is at a critical point where a breakdown could signal a deeper correction. Traders and investors must remain vigilant, monitor key support and resistance levels, and be prepared for potential volatility as the market digests incoming economic data and central bank signals. The current environment demands a data-driven approach, focusing on risk management and strategic positioning rather than chasing speculative rallies.
Nasdaq100 Analysis: Bullish vs. Bearish Scenarios
The technical indicators and macroeconomic backdrop present a complex picture for the Nasdaq100. While bearish signals dominate the short to medium term, the possibility of a market rebound cannot be entirely dismissed, especially if key support levels hold or if upcoming economic data proves surprisingly positive. Understanding these potential scenarios is crucial for strategic decision-making.
Bearish Scenario: Downside Pressure Mounts
70% ProbabilityNeutral Scenario: Consolidation Around Key Levels
20% ProbabilityBullish Scenario: Rebound from Support
10% ProbabilityFrequently Asked Questions: Nasdaq100 Analysis
What happens if the Nasdaq100 breaks below the $29,135.55 support level?
A break below $29,135.55 on the Nasdaq100 would likely trigger further selling pressure, invalidating the neutral outlook. This could lead to a test of the next significant support at $29,076.62, and potentially accelerate declines towards $28,852.38 if momentum builds.
Should I consider buying the Nasdaq100 at current levels of $29,164.86 given the RSI at 32.77?
Buying solely based on the 1-hour RSI at 32.77 would be speculative. While it suggests oversold conditions on that specific timeframe, the daily and hourly charts show bearish trends. A more prudent approach would be to wait for confirmation, such as a hold of $29,135.55 support with bullish divergence or a clear break above resistance levels.
Is the MACD showing negative momentum a sell signal for the Nasdaq100 right now?
The negative MACD momentum, with the line below the signal line, does indicate bearish pressure. While not an automatic sell signal on its own, it reinforces the bearish outlook suggested by other indicators and price action. It implies that any rallies might face selling pressure, making it a signal to be cautious rather than initiating new long positions.
How will the rising DXY at 100.7 affect the Nasdaq100 this week?
The rising DXY at 100.7 typically exerts downward pressure on growth assets like the Nasdaq100. This indicates a stronger US dollar, which can make US equities more expensive for international investors and signal risk aversion. If the DXY continues to strengthen, it could exacerbate the Nasdaq100's decline and hinder any potential recovery attempts.
Track markets in real-time
AI-powered analysis, technical indicators and real-time price data.
Join Our Telegram Channel
Breaking market news, AI analysis and trading signals instantly.
Join Channel