

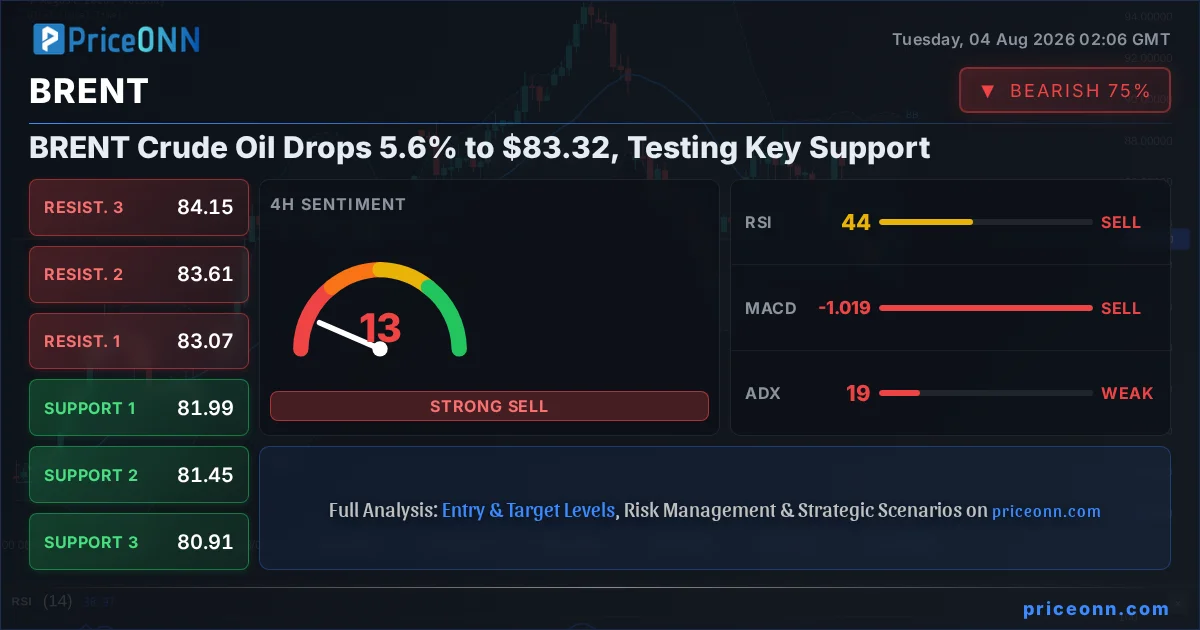
The tension is palpable in the oil markets as BRENT crude experiences a significant 5.6% drop, testing the crucial support level at $81.99. This sharp decline from recent highs, bringing BRENT down to $83.32, is not occurring in a vacuum. It's a complex interplay of shifting macroeconomic winds, evolving geopolitical landscapes, and contrasting technical signals that are creating a volatile environment for traders. The question on everyone's mind is whether this is a temporary pullback or the start of a more sustained downtrend. The ADX at 19.21 on the 4-hour chart signals a lack of strong trend, suggesting choppiness ahead, but the daily chart's ADX of 25.07 indicates a stronger downward trend is trying to establish itself. This divergence across timeframes adds to the complexity, painting a picture of a market at a critical juncture.
- BRENT crude oil has fallen 5.6% to $83.32, testing support at $81.99.
- The 4-hour ADX at 19.21 suggests a ranging market, while the daily ADX at 25.07 hints at a developing downtrend.
- RSI at 43.61 (4H) and 47.73 (1D) indicates room for further downside, while Stochastic shows oversold conditions on the 4H chart.
- Geopolitical news, including the easing of tensions in Europe and shifting crude supply dynamics, are influencing price action.
The Bull Case: A Temporary Correction or a Buying Opportunity?
Support Holds, Opportunity Knocks
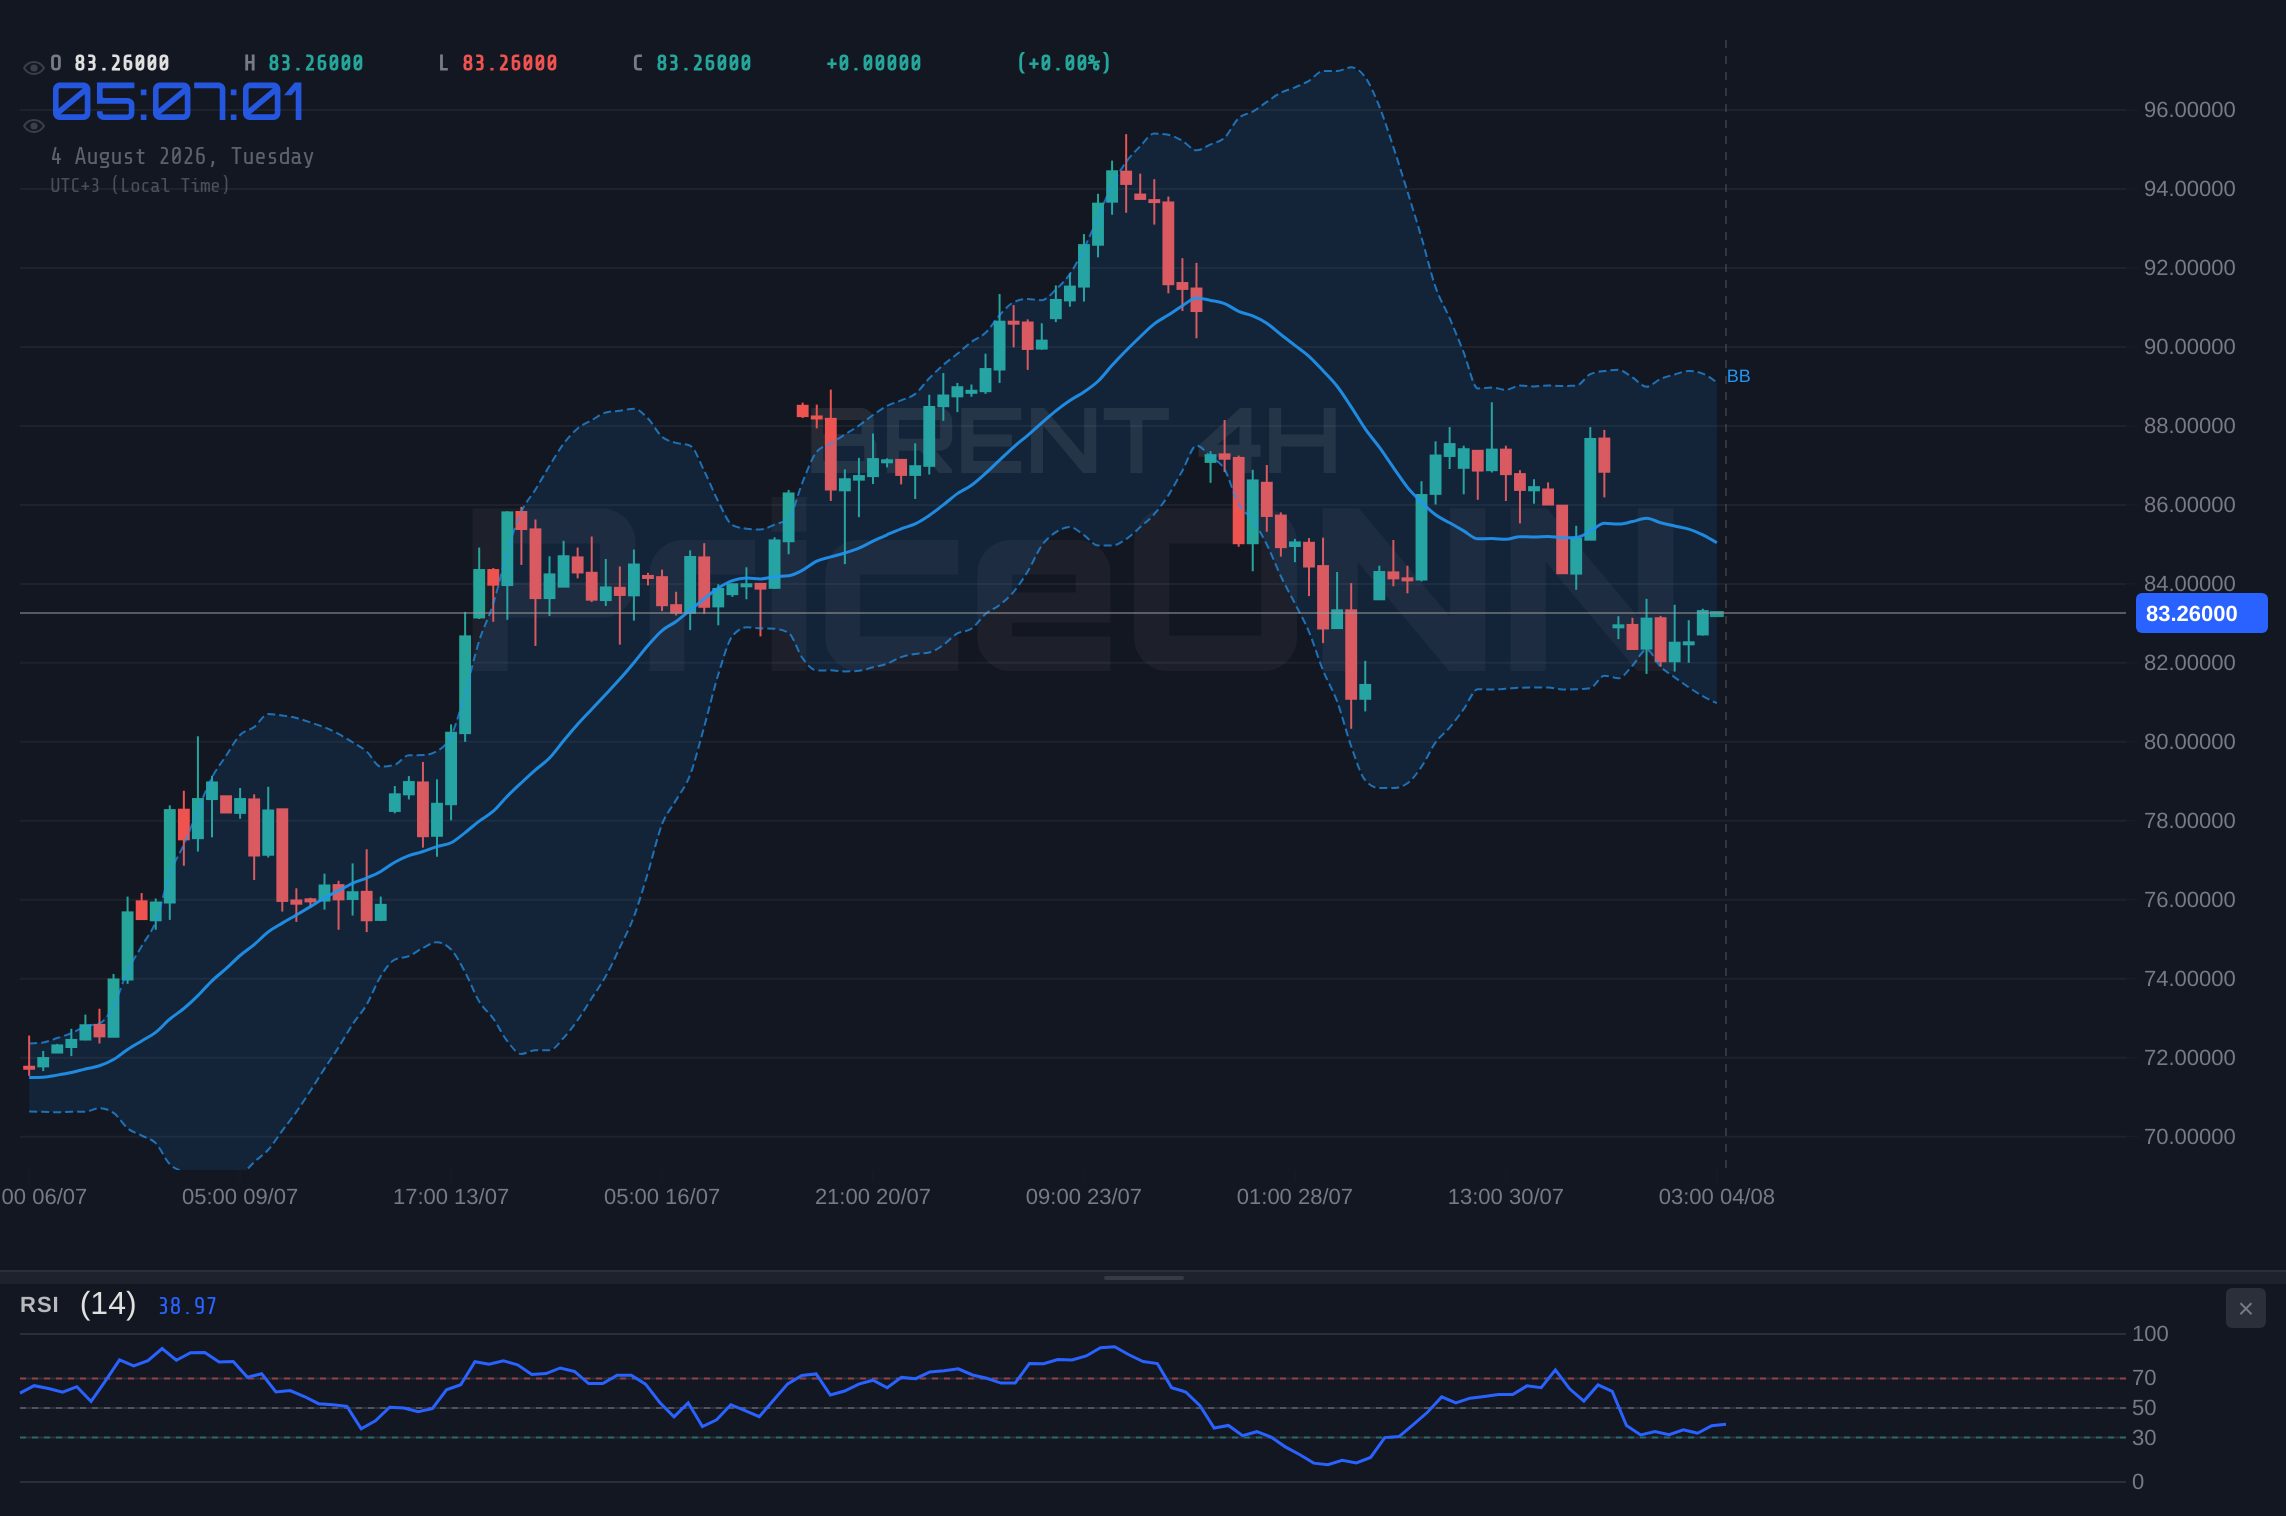
While the immediate price action for BRENT crude is bearish, a closer look at the technical indicators and broader market correlations reveals a potential for a bullish rebound. The current price of $83.32 sits precariously close to the first significant support level at $81.99. On the 4-hour chart, the Stochastic indicator is in the oversold territory (K=16.96, D=13.75), often signaling a potential reversal to the upside. Historically, such oversold conditions, especially when coupled with a bounce from a key support level, can precede a price recovery. The RSI on the 4-hour chart, currently at 43.61, is moving away from the extreme oversold readings, suggesting that the selling pressure might be waning. Furthermore, the MACD on the 4-hour chart shows positive momentum, with the MACD line above the signal line, indicating that the underlying momentum could be shifting back towards buyers. If BRENT can hold above $81.99 and then decisively break above the immediate resistance at $83.56, we could see a swift move towards the next resistance at $84.15. This scenario would be further supported by a general improvement in risk sentiment globally, perhaps driven by positive economic data or a de-escalation of geopolitical tensions.
Macroeconomic Tailwinds and Geopolitical Shifts
The narrative for a bullish recovery in BRENT also finds support in recent macroeconomic and geopolitical developments. Despite the current price drop, the underlying fundamentals for oil demand remain relatively robust, particularly with the global economy showing signs of resilience. While Fed officials, like NY Fed President John Williams, are focusing on core inflation trends beyond the immediate oil shock, the overall sentiment suggests a cautious optimism that inflation is gradually declining. This could pave the way for central banks to maintain or even consider easing monetary policy later in the year, which would typically be supportive of commodity prices. On the geopolitical front, news that Europe is replacing Russian crude with supplies from Kazakhstan and Libya, as reported by Black Sea, suggests a diversification of supply that could stabilize markets. Additionally, the reported cancellation of a plan that sent European gas prices tumbling could indicate a reduction in immediate energy supply chain anxieties, potentially freeing up capital to flow back into riskier assets like oil. If these factors combine with a stronger DXY at 100.04 failing to sustain its upward momentum and showing signs of weakness, it could provide a crucial tailwind for BRENT.
The Bear Case: Downside Risks Persist
Daily Trend and Weak Momentum
However, the bearish case for BRENT crude is compelling, primarily driven by the prevailing trend on the daily timeframe and persistent weakness in momentum indicators. The daily chart paints a clear picture of a downtrend, with the ADX at a strong 25.07, indicating that sellers are gaining control. The current price of $83.32 is trading below the middle Bollinger Band on the daily chart, and the RSI at 47.73, while not deeply oversold, shows a clear downward inclination. This suggests that there is still room for prices to fall before reaching oversold territory. The Stochastic indicator on the daily chart also shows a bearish signal (%K
Market Sentiment and Intermarket Analysis
The broader market sentiment also seems to be leaning towards caution, which is detrimental to oil prices. The DXY (Dollar Index) at 100.04 shows a slight upward bias, which typically puts pressure on dollar-denominated commodities like oil. While the DXY's 4-hour trend is bearish (ADX 34.26), its daily trend is also neutral (ADX 24.19), indicating a lack of strong directional conviction but a general strength that can weigh on oil. Furthermore, major equity indices like the SP500 and Nasdaq are showing mixed signals. The SP500's daily trend is bearish (ADX 47.51), and its 1-hour RSI at 70.95 suggests it's in overbought territory, potentially facing a pullback. A significant risk-off sentiment, triggered by negative economic data or escalating geopolitical tensions, could see investors flocking to safe-haven assets, further pressuring BRENT. The news regarding Trump's potential reversal on Iran policy, though initially sending European gas prices tumbling, could also be interpreted as a reduction in perceived immediate supply risks, indirectly weighing on oil prices if it lessens the geopolitical risk premium. The record output from Argentina's Vaca Muerta, failing to lift the wider economy, also points to supply-side factors that could add to downward pressure if global demand falters.
The Verdict: A Watchful Wait Near Critical Support
Technical Confluence and the Path Forward
The current technical picture for BRENT crude is a study in contrasts. The 1-hour chart offers some bullish signals, with positive MACD momentum and the Stochastic in an oversold zone, suggesting a potential for a short-term bounce. However, these are overshadowed by the bearish trend on the daily chart, where the ADX at 25.07 indicates a developing downtrend and RSI at 47.73 still has room to fall. The critical support at $81.99 is the line in the sand. A failure to hold this level would likely confirm the bearish outlook, potentially leading to a sharp sell-off towards $80.91. On the other hand, a sustained hold above $81.99, followed by a decisive breakout above the immediate resistance at $83.56 and then $84.15, could signal the start of a recovery. The 4-hour Stochastic being oversold adds a layer of complexity, as it could either signal a reversal or simply indicate that the market is deeply oversold before a further decline.
What Needs to Happen for a Valid Setup?
For a truly valid bullish setup to emerge, we need to see a clear confluence of factors. Firstly, BRENT must demonstrate a firm hold above the $81.99 support level. This should be accompanied by a clear bullish signal on the daily chart, such as the RSI moving above 50 and MACD histogram turning positive. A breakout above the 4-hour resistance at $83.56, and more importantly, the daily resistance at $85.34, would be a strong confirmation. Simultaneously, we would look for a weakening of the US Dollar Index (DXY) from its current 100.04 level, ideally falling below 99.70, and a shift towards risk-on sentiment in global equity markets, with the SP500 showing signs of recovery above its 6533.23 support. Until these conditions are met, the market remains in a 'watch zone,' characterized by high volatility and uncertainty. Patience is key; forcing a trade in such conditions often leads to whipsaws and losses. The market is presenting a challenging environment, and waiting for clearer signals is the prudent approach.
Navigating the Uncertainty: Risk Management is Paramount
In this environment of conflicting signals and potential volatility, disciplined risk management becomes paramount. Traders should be prepared for choppy price action, and any positions taken should have clearly defined stop-loss levels. For those looking to enter on the long side, waiting for confirmation of a bounce from $81.99, ideally with a daily close above $85.34, would offer a more defined risk-reward profile. Conversely, a break below $81.99 would open up shorting opportunities, with targets at $80.91 and potentially $80.09. The current ADX readings across different timeframes highlight the indecision in the market; the 4-hour suggests ranging conditions, while the daily points to a developing trend. This means that breakouts, when they occur, could be sharp and decisive. However, without a clear directional conviction from the majority of indicators and broader market sentiment, it is wise to remain cautious. The geopolitical backdrop, while showing some signs of easing in Europe, remains a wildcard that could quickly shift sentiment and price action. Therefore, a strategy that involves waiting for clear setups, managing risk tightly, and avoiding premature entries is the most sensible approach.
The Importance of Macro and Geopolitical Context
It's crucial to remember that BRENT's price is not determined in isolation. The broader macroeconomic environment and geopolitical developments play a significant role. While the Fed is focused on core inflation, any unexpected shifts in their stance or surprising economic data releases could impact the dollar and, consequently, oil prices. The DXY's current level at 100.04 is a key watchpoint; a sustained move above 100.34 could add further pressure on BRENT. Conversely, a weakening dollar could provide a much-needed boost. Geopolitically, while the news about European gas prices might suggest a temporary easing of energy supply fears, the situation in the Middle East remains a constant source of potential volatility. Any escalation there could rapidly push BRENT prices higher, overriding current technical signals. Therefore, a comprehensive analysis must consider these external factors. For instance, the correlation between BRENT and the SP500's daily trend (bearish) suggests that a broader market downturn could drag oil prices lower, regardless of specific oil supply news. This intermarket analysis is vital for understanding the true drivers behind BRENT's price action.
Looking Ahead: What to Watch in the Coming Days
In the immediate future, all eyes will be on the $81.99 support level for BRENT crude. A decisive break below this level would invalidate any immediate bullish hopes and likely signal a continuation of the downtrend, with targets at $80.91 and $80.09. Confirmation of this bearish move would require continued weakness in the DXY and potentially a further decline in risk sentiment reflected in the equity markets. On the bullish side, a hold above $81.99, followed by a strong push above $83.56 and then $85.34, would be necessary to signal a potential reversal. This would ideally be accompanied by improving daily technicals and a more positive macroeconomic outlook. Traders should also monitor upcoming economic data releases, particularly those related to inflation and employment, which could influence central bank policy expectations and, by extension, commodity prices. The interplay between supply-side factors, global demand, geopolitical risks, and macroeconomic policy will continue to shape BRENT's trajectory. The current ADX of 19.21 on the 4H chart suggests the market might consolidate before the next major move, so patience and a focus on risk management are crucial.
Trade Scenarios: Navigating the $81.99 Level
Bearish Scenario: Downside Breakout
65% ProbabilityBullish Scenario: Support Holds, Reversal
25% ProbabilityNeutral Scenario: Consolidation & Range-Bound
10% Probability| Indicator | Value | Signal | Interpretation |
|---|---|---|---|
| RSI (14) | 47.73 | Bearish | Daily RSI indicates room for further downside. |
| MACD Histogram | -1.53 | Bearish | Daily MACD shows negative momentum. |
| Stochastic %K | 38.0 | Bearish | Daily Stochastic signals downside pressure. |
| ADX (Daily) | 25.07 | Strong Trend | Indicates a developing downtrend. |
| Bollinger Bands (Daily) | Price below Mid-Band | Bearish | Suggests downward pressure. |
Frequently Asked Questions: BRENT Analysis
What happens if BRENT breaks below the $81.99 support level?
A decisive close below $81.99 on the daily chart would likely confirm the bearish trend, potentially triggering a sell-off towards the $80.91 and $80.09 support levels. This scenario is supported by the daily ADX at 25.07 and RSI below 50.
Should I consider buying BRENT at current levels around $83.32 given the 4H oversold Stochastic?
While the 4-hour Stochastic at 16.96 is oversold, the daily chart presents a bearish trend. A cautious approach would be to wait for confirmation, such as a hold above $81.99 and a break of $83.56 resistance, before considering a long position. Risk management is crucial.
Is the RSI at 47.73 a sell signal for BRENT right now?
An RSI of 47.73 on the daily chart is not an extreme sell signal but indicates bearish momentum. It suggests that prices have room to fall further before reaching oversold territory, aligning with the prevailing downtrend on the daily timeframe.
How will the DXY's current level of 100.04 affect BRENT's price this week?
A DXY at 100.04, showing some upward pressure, generally exerts downward pressure on dollar-denominated commodities like BRENT. A sustained rise in the DXY above 100.34 could exacerbate BRENT's decline, while a fall below 99.70 might offer some support.
Track markets in real-time
AI-powered analysis, technical indicators and real-time price data.
Join Our Telegram Channel
Breaking market news, AI analysis and trading signals instantly.
Join Channel