

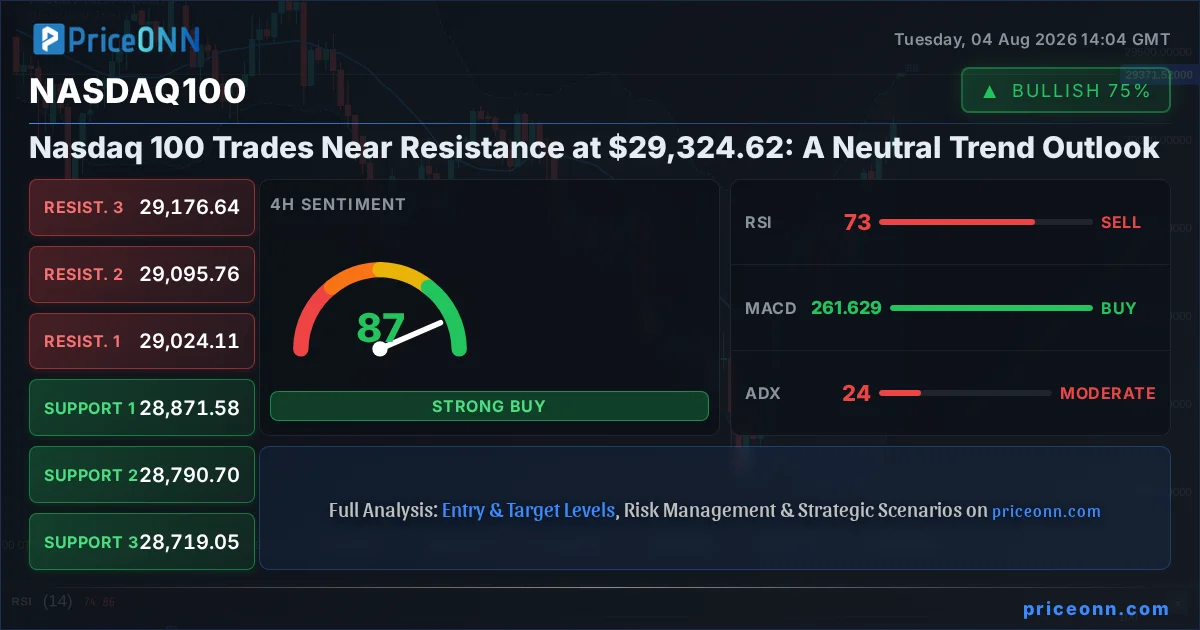
The Nasdaq 100 is currently navigating a critical juncture, hovering precariously near resistance levels at $29,324.62. This isn't just another day on the markets; it's a moment where the broader economic narrative, coupled with nuanced technical signals, demands our attention. As a seasoned economic analyst, I see this as a period of heightened importance, where understanding the interplay between global indices, currency movements, and commodity price action is paramount for deciphering the next potential move in the tech-heavy Nasdaq. The current price action suggests a market caught between the lingering optimism from recent gains and the cautious undertones of potential headwinds. This delicate balance is what we'll unpack today, moving beyond the headlines to dissect the underlying data driving this crucial market sentiment.
- The Nasdaq 100 is trading near resistance at $29,324.62, with a neutral trend signal on the daily timeframe.
- Critical resistance is observed at $29,164.20, while support lies at $29,015.67.
- RSI at 54.66 suggests neutral momentum, but ADX at 27.04 indicates a strong trend, creating a conflicting picture.
- DXY's slight dip to 99.92 offers some breathing room for risk assets, but its correlation remains a key watch.
The past week has been a dance of mixed signals for the Nasdaq 100. While the index has shown resilience, pushing towards higher grounds, the daily chart paints a picture of a market that's neither fully committed to a breakout nor ready to capitulate. The current price of $29,324.62 sits just below the 1H resistance of $29,164.20, a level that has acted as a ceiling for immediate upward momentum. This technical positioning is crucial. It suggests that while buyers have shown strength, they are facing stiff opposition from sellers who are likely defending these higher price points. The 1H trend is firmly in the 'Bullish' camp with 100% strength, supported by a strong ADX of 49.72, indicating a robust trend. However, this is juxtaposed by a Stochastic K line at 97.85 and D line at 86.96, signaling extreme overbought conditions on the 1-hour timeframe. This divergence is precisely where seasoned traders find opportunities – not by blindly following a signal, but by understanding the conflicting forces at play.
Diving deeper into the 4-hour timeframe, the picture becomes slightly more nuanced. Here, the trend is classified as 'Neutral' with 50% strength. While the RSI at 62.83 still points towards a positive bias, it's comfortably within neutral territory, unlike the overbought conditions seen on the 1-hour chart. MACD is showing positive momentum, a sign that underlying buying pressure hasn't completely evaporated. However, the ADX at 24.23 suggests a moderate trend strength, which is less assertive than the 1H's aggressive 49.72. This difference in trend strength across timeframes is a classic sign of consolidation. Prices are moving, but without a clear, sustained directional conviction. The Stochastic K line at 97.85 and D line at 86.96 on the 4H chart echo the overbought sentiment from the 1H, reinforcing the idea that further upside might be limited without a significant catalyst or a period of consolidation to digest recent gains. The general signal for the 4H timeframe is 'BUY' (6 Buy, 2 Sell, 0 Neutral), but this comes with a significant caveat due to the overbought Stochastic readings and the neutral trend strength.
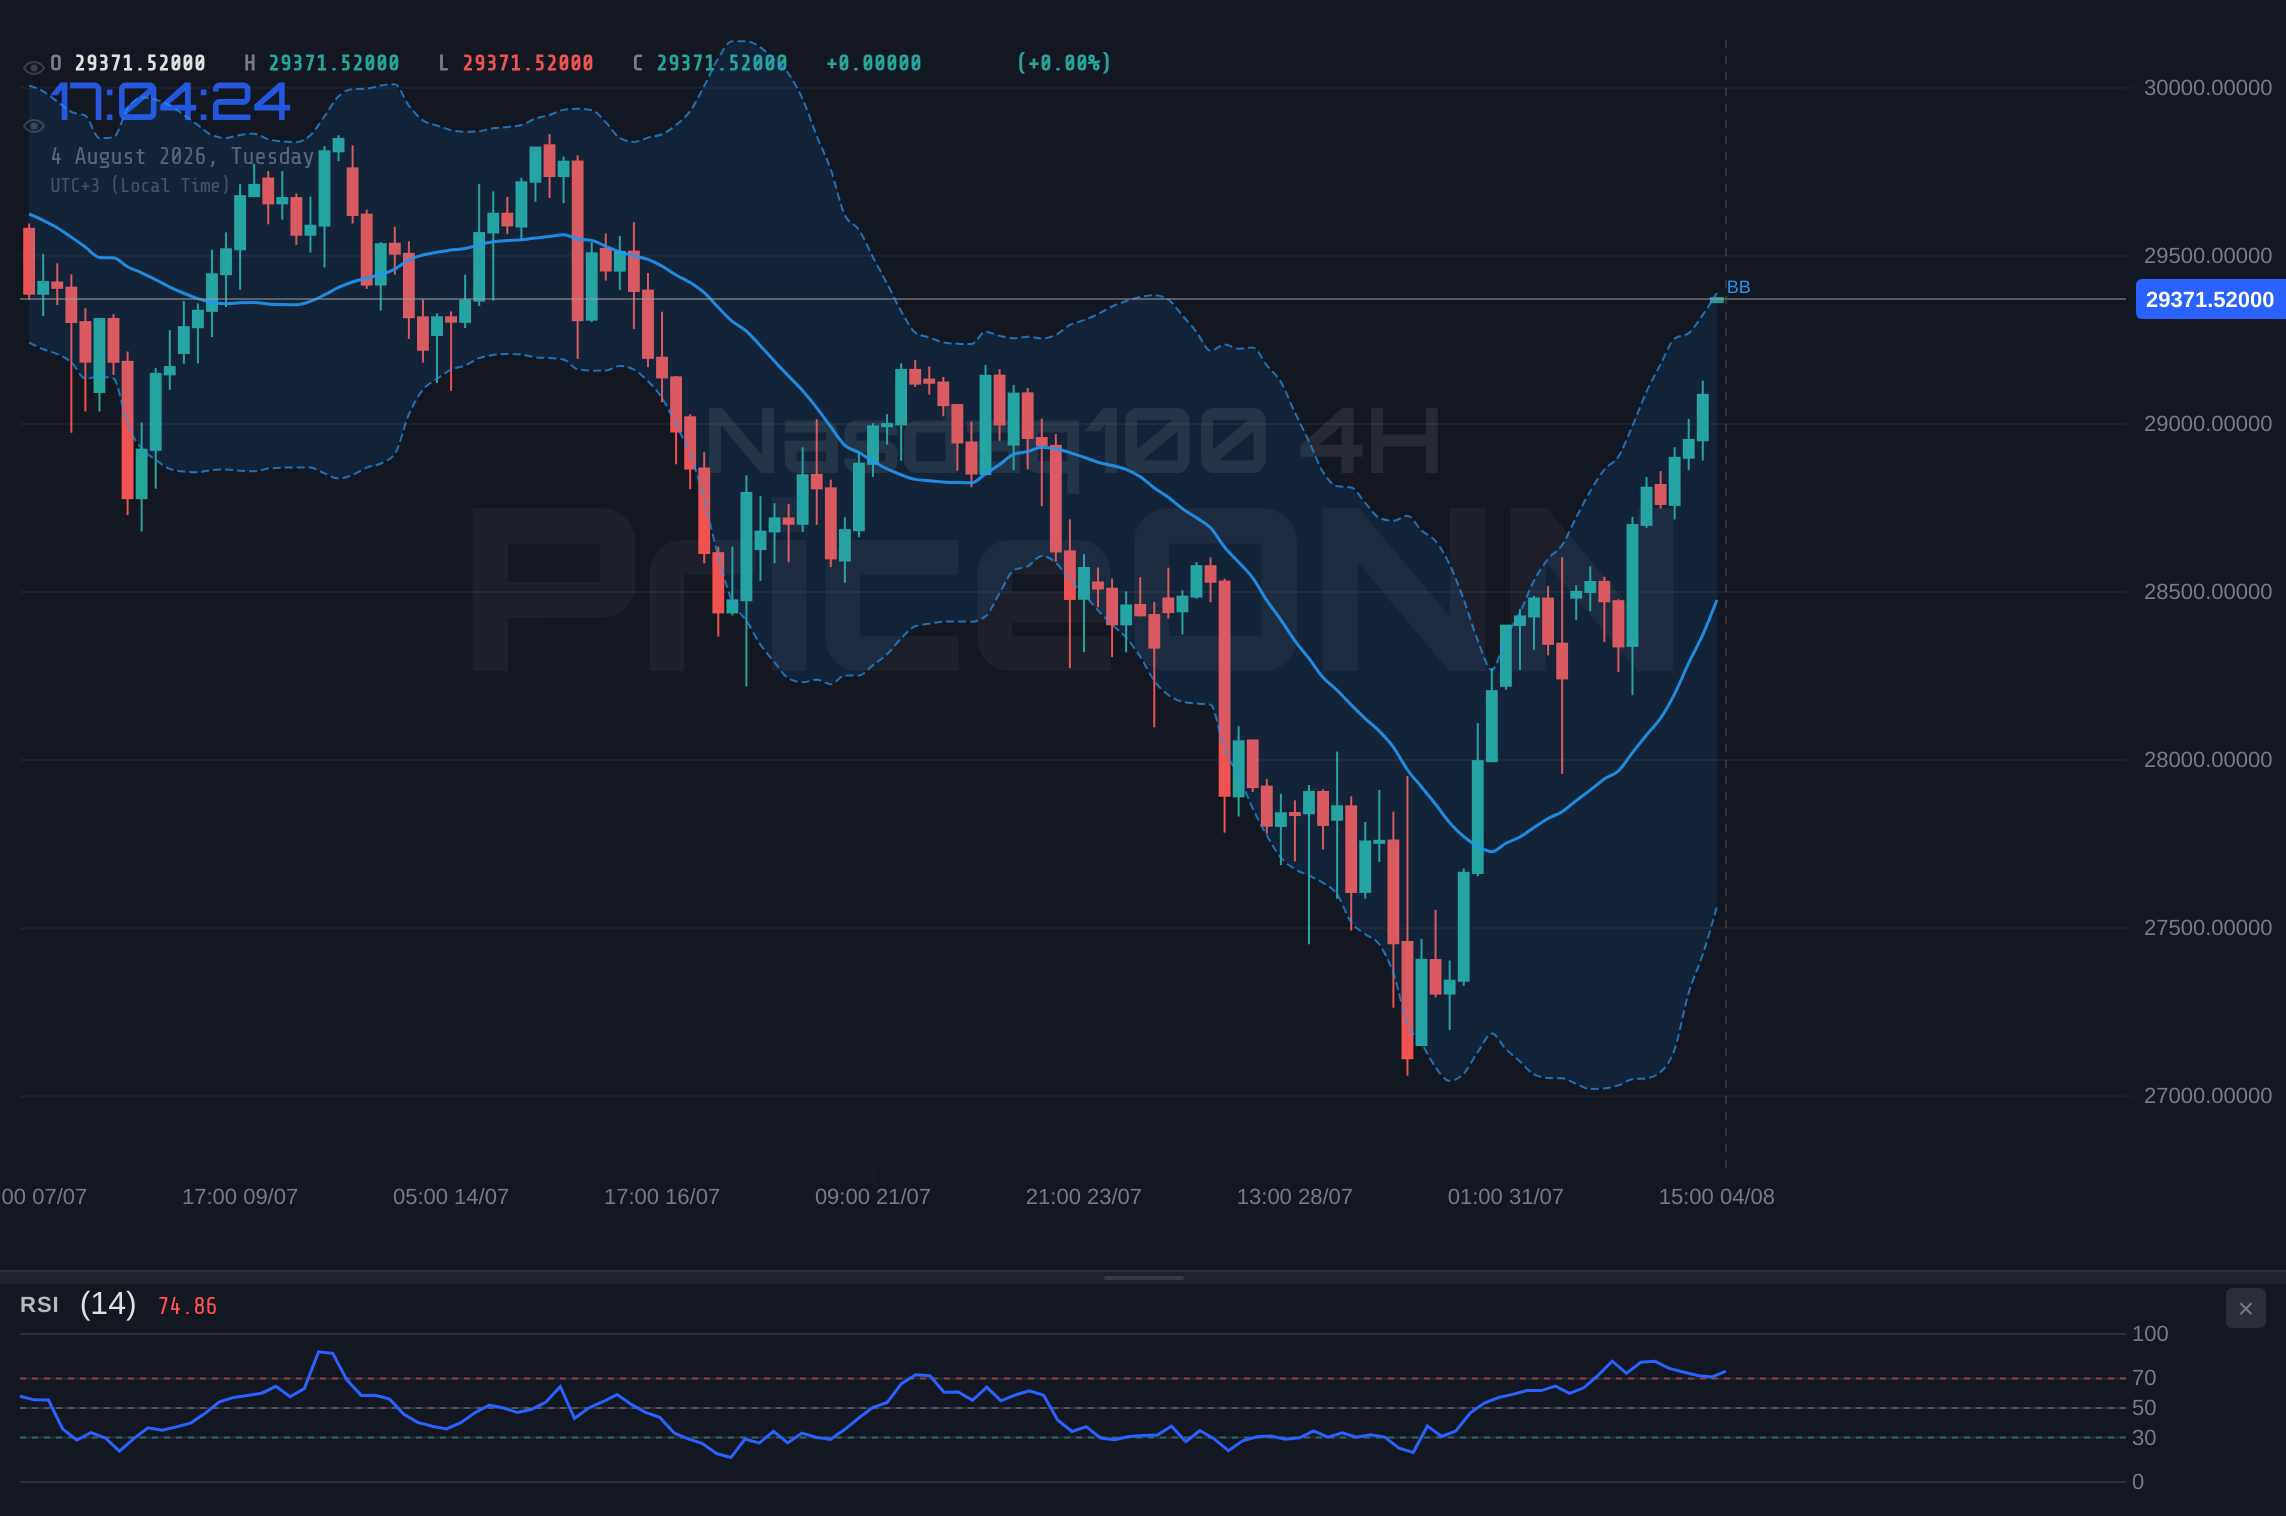
It's on the daily chart where the Nasdaq 100's current predicament truly crystallizes. Here, the trend is marked as 'Bearish' with 100% strength, a stark contrast to the bullish sentiment on shorter timeframes. This is a critical conflict. The daily RSI at 45.35 indicates a lean towards bearish momentum, sitting below the 50-mark. MACD is also showing negative momentum, with the histogram below the signal line, suggesting that sellers have been more dominant over the longer term. The ADX at 47.51 is particularly noteworthy; it signifies a strong bearish trend, indicating that the downward pressure has been substantial and sustained. Despite this bearish daily outlook, the 1D Stochastic K line at 42.97 and D line at 29.88 are showing a bullish crossover, hinting at a potential short-term bounce or a dead-cat bounce scenario. This dichotomy between the strong bearish trend indicators (ADX, RSI, MACD) and the emerging bullish signal from Stochastic is precisely why the market is currently trading in a neutral fashion, despite the daily trend being technically bearish. The 'SELL' signal (2 Buy, 5 Sell, 0 Neutral) on the daily chart underscores this caution.
Understanding these inter-timeframe dynamics is key for any trader. The bullish signals on the 1-hour and 4-hour charts might be interpreted as short-term buying opportunities or retracements within a larger downtrend indicated by the daily timeframe. The overbought Stochastic readings across multiple timeframes, especially the extreme levels on the 1H and 4H, suggest that any further upward push could be met with significant profit-taking. The ADX readings are particularly telling: a strong 49.72 on the 1H suggests a committed trend, but the drop to 24.23 on the 4H and then to 47.51 on the daily creates a complex picture. The daily ADX of 47.51 points to a strong trend, but the conflicting bullish Stochastic crossover suggests we might be seeing a temporary reprieve rather than a sustained trend reversal. This conflict means that traders should be extremely cautious about chasing long positions without clear confirmation of a trend change, or short positions without a confirmed breakdown below key support levels.
The broader market context is equally important. The Dollar Index (DXY) is currently trading around 99.92, showing a slight dip. Historically, a rising DXY often puts pressure on risk assets like the Nasdaq 100, as a stronger dollar makes US assets more expensive for foreign investors and can signal tighter global liquidity. The current slight pullback in the DXY provides some relief for risk appetite, but its overall strength in recent times has been a subtle headwind for equity markets. If the DXY were to resume its upward trend, particularly breaking above the 100.07 resistance level seen on the 1H chart, it would likely add further pressure on the Nasdaq. Conversely, a sustained drop in the DXY below 99.83 could offer a tailwind for equities, potentially helping the Nasdaq push through its current resistance.
We also need to consider the performance of other major indices. The SP500 is trading at 6572.87, showing a strong daily gain of 0.74%. This is a positive sign for overall market sentiment, suggesting a degree of risk-on appetite. However, the daily trend for the SP500 is also marked as 'Bearish' (100% strength), with an RSI of 45.35 and a strong ADX of 47.51. This mirrors the Nasdaq's daily technical picture – a bounce within a larger bearish structure. The Nasdaq's outperformance, with its significant 1.79% daily gain to $29,324.62, suggests that technology stocks are currently leading the charge, perhaps anticipating specific sector-related news or benefiting from a rotation into growth assets. The Dow Jones Industrial Average also shows a strong daily gain of 0.96% to 53753.5, indicating broad market strength, but its daily trend is 'Bullish' (83% strength), suggesting a slightly different dynamic compared to the Nasdaq and SP500. This divergence in daily trend strength across indices warrants careful observation.
Turning to commodities, Brent crude is trading at $79.26, down significantly by 3.96%. This sharp decline in oil prices is a double-edged sword. On one hand, falling oil prices can ease inflationary pressures, potentially giving central banks more room to consider easing monetary policy or at least pausing rate hikes, which is generally positive for equities. On the other hand, a steep drop in oil can also signal weakening global demand, a bearish indicator for the broader economy and corporate earnings. The current bearish ADX of 21.52 on the 1H chart for Brent suggests a downtrend is in play, and the RSI at 30.32 indicates it's approaching oversold territory, hinting at a potential short-term stabilization. WTI crude is also down sharply, trading at $77.08. This commodity price action is a significant factor to watch, as energy costs directly impact inflation expectations and corporate costs.
Precious metals offer another layer to this complex market tapestry. Gold (XAUUSD) is currently trading at $4,084.40, showing a notable 0.72% increase. This rise in gold prices, especially when other risk assets are also showing gains (like the Nasdaq), suggests that the market might be pricing in a complex mix of factors. It could be a response to geopolitical uncertainty, a hedge against potential inflation, or simply a reflection of strong demand for safe-haven assets. The 1H trend for gold is 'Bullish' with 93% strength, and RSI at 63.56 is in neutral territory with an upward bias. However, the ADX at 15.29 indicates a weak trend, suggesting the current rally might lack strong conviction. Silver (XAGUSD) is also on the rise, trading at $59.64 with a significant 2.55% daily gain. Its 1H trend is strongly bullish (97% strength), with RSI at 70.03 entering the overbought zone. The concurrent rise in both gold and silver, alongside equities, is an unusual dynamic that often signals a shift in market sentiment or a specific catalyst driving broad asset classes higher.
The foreign exchange market provides further context. EUR/USD is trading at 1.15236, showing a modest 0.14% increase. The 1D trend is neutral, but the 1D Stochastic is showing a bullish signal. USD/JPY, on the other hand, is trading at 157.421, down 0.18% on the day. The daily chart shows a bearish trend with RSI at 25.54 in oversold territory, suggesting potential for a bounce, though the ADX at 31.21 indicates a strong trend is in place. GBP/USD is trading at 1.34479, up 0.17%. The daily trend is bullish with an RSI of 55.99. AUD/USD is at 0.70356, up 0.53%, with a bullish 1D trend. NZD/USD is trading at 0.58912, up 0.37%, also showing a strong bullish daily trend. The general weakness in USD/JPY compared to other major pairs, and the strength in GBP/USD, AUD/USD, and NZD/USD, might indicate a slight risk-on sentiment permeating the forex market, which could indirectly support the Nasdaq's upward push, provided the DXY doesn't surge.
Considering the current technical setup for the Nasdaq 100, the confluence of conflicting signals across different timeframes presents a challenging trading environment. The bullish momentum on shorter timeframes (1H, 4H) is being capped by resistance levels and overbought indicators, while the daily timeframe exhibits a bearish trend with strong ADX readings, albeit with a nascent bullish signal from Stochastic. This suggests a potential for a period of consolidation or a range-bound market in the immediate short term. The key levels to watch are the immediate resistance at $29,164.20 and the support at $29,015.67 on the 1H chart. A decisive break above $29,164.20, accompanied by strong volume and sustained RSI above 70, could signal a continuation of the bullish momentum seen on shorter frames, potentially targeting higher resistance levels. Conversely, a close below $29,015.67 could confirm the bearish bias from the daily chart, opening the door for a move towards the 4H support at $28,871.58.
The recent news flow, while not directly naming the Nasdaq 100, provides relevant context. Reports of analysts favoring copper and gold miners like Freeport-McMoran, and Fresnillo tripling profits on surging precious metals prices, indicate strength in commodities, particularly gold and silver. This could be a sign of inflation hedging or a 'risk-on' play in certain commodity sectors. Forex news highlights a busy week ahead for EUR/USD and potential upside for GBP/CAD and GBP/USD, suggesting some directional conviction in major currency pairs. The mention of Fed's Williams focusing beyond oil shocks on core inflation is also important; it implies that central bank policy will remain data-dependent, with inflation figures continuing to be a key driver. This backdrop of mixed commodity and forex signals, alongside the conflicting technicals for the Nasdaq, emphasizes the need for a cautious and data-driven approach. The market is not yet giving a clear directive, making it a crucial time for disciplined risk management.
Bullish Scenario: Nasdaq 100 Breaks Resistance
15% ProbabilityNeutral Scenario: Consolidation Around Resistance
65% ProbabilityBearish Scenario: Daily Trend Resumes
20% ProbabilityFrequently Asked Questions: Nasdaq100 Analysis
What happens if the Nasdaq 100 breaks above the $29,164.20 resistance level?
A sustained close above the 1H resistance of $29,164.20, particularly with strong volume and positive RSI momentum, could signal a continuation of the bullish sentiment seen on shorter timeframes. This might lead to price targets around the daily high of $29,383.08 and potentially test the next resistance at $29,685.50.
Should I buy the Nasdaq 100 at current levels near $29,324.62 given the mixed signals?
Buying at current levels requires extreme caution due to conflicting signals and overbought indicators on shorter timeframes. A neutral scenario with consolidation between $29,015.67 and $29,164.20 has a 65% probability. Wait for a clear breakout above resistance or a breakdown below support, confirming the direction with strong volume and less extreme indicator readings.
Is the RSI at 54.66 a sell signal for the Nasdaq 100 right now?
An RSI of 54.66 on the daily chart is considered neutral territory, leaning slightly towards bullish momentum. It is not an inherent sell signal. However, when combined with overbought Stochastic readings on 1H and 4H charts and strong daily bearish ADX, it suggests that upside might be limited and caution is warranted before initiating new long positions.
How will the current DXY levels near 99.92 affect the Nasdaq 100 this week?
The DXY trading around 99.92 offers some breathing room for risk assets like the Nasdaq 100. A sustained drop in the DXY below 99.83 could provide a tailwind, supporting a potential push through Nasdaq's resistance. Conversely, if the DXY resumes its climb above 100.07, it would likely exert downward pressure on the index, reinforcing the bearish daily trend.
The Nasdaq 100's current position near resistance at $29,324.62 encapsulates the broader market's indecision. We're seeing conflicting signals across timeframes and asset classes – bullish momentum on shorter-term charts battling a bearish daily trend, strong commodity prices juxtaposed with falling oil, and a mixed forex landscape. This environment calls for patience and discipline. The key takeaway is that the market is waiting for a clearer directive, likely from upcoming economic data or central bank commentary. Until then, managing risk and waiting for a decisive breakout or breakdown below key levels such as $29,015.67 or $29,164.20 will be the most prudent strategy. Volatility creates opportunity, and for those prepared to wait for their setup, the market will undoubtedly provide another chance.
| Indicator | Value | Signal | Interpretation |
|---|---|---|---|
| RSI (14) | 54.66 | Neutral | Neutral momentum on daily, leaning bearish below 50. |
| MACD Histogram | -45.00 | Bearish | Negative momentum on daily, suggesting downward pressure. |
| Stochastic | K:42.97, D:29.04 | Bullish Crossover | Bullish crossover in oversold territory, hinting at potential bounce. |
| ADX | 27.04 | Strong Trend | Strong bearish trend indicated on daily chart. |
| Bollinger | Middle Band | Below Middle Band | Price below middle band on daily chart, suggesting bearish bias. |
Track markets in real-time
AI-powered analysis, technical indicators and real-time price data.
Join Our Telegram Channel
Breaking market news, AI analysis and trading signals instantly.
Join Channel