

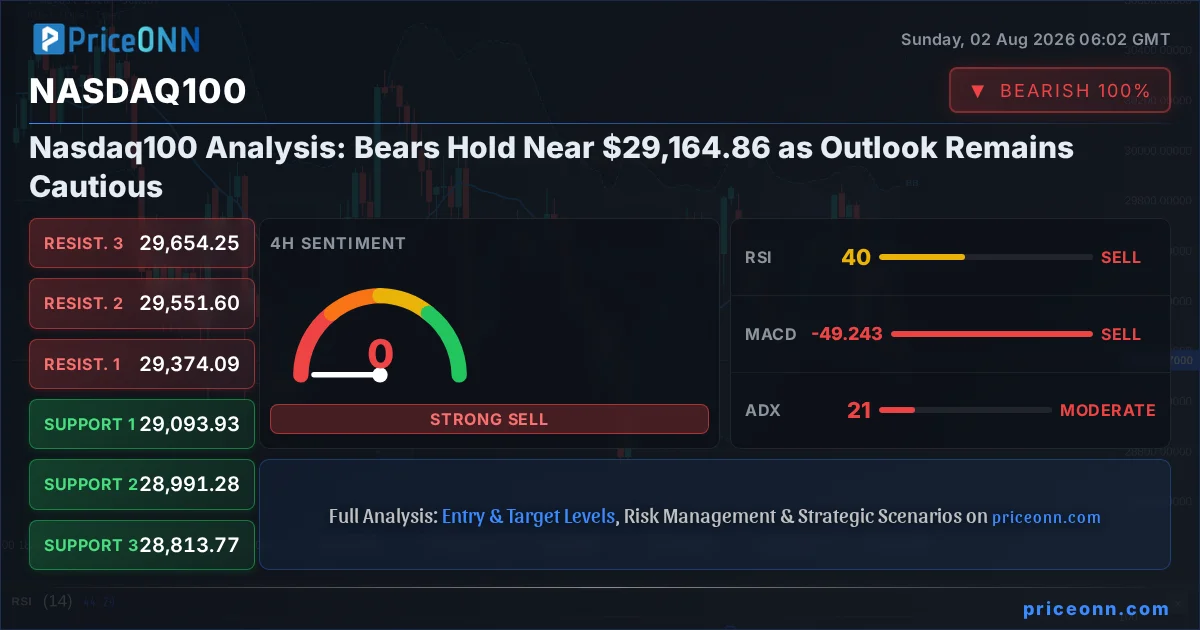
The Nasdaq100 closed last Friday hovering around the critical $29,164.86 mark, a level that has become a focal point for traders and analysts alike. Last week was a testament to the prevailing bearish sentiment, with the index experiencing significant fluctuations and ultimately failing to reclaim higher ground. As we step into a new trading week, the question on everyone's mind is whether the bears will continue their grip or if a shift in momentum is on the horizon. The technical indicators paint a mixed, yet predominantly cautious picture, suggesting that the path forward for the tech-heavy index is fraught with uncertainty. Several key levels were tested and ultimately held, reinforcing the current sentiment. The interplay between macroeconomic factors, central bank policy expectations, and the Nasdaq's own technical structure will be crucial in determining its trajectory in the coming days. This analysis delves into the specific price action, indicator readings, and potential scenarios that traders should be watching closely.
- The Nasdaq100 is currently trading near $29,164.86, with significant bearish pressure evident from its 1H and 4H technical signals.
- Key support for the Nasdaq100 is identified at $29,135.55, while resistance looms at $29,260.86 on the 1H timeframe. A break below $29,076.62 could accelerate declines.
- RSI at 32.77 on the 1H chart indicates oversold conditions are developing, but the MACD histogram remains negative, suggesting bearish momentum persists.
- The strong ADX reading of 33.23 on the 1H timeframe confirms a robust downtrend is in play, despite some conflicting signals from Stochastic.
- Market sentiment remains cautious, influenced by global risk appetite indicators like DXY and ongoing concerns about central bank policies and inflation.
Last Friday's close for the Nasdaq100 at $29,164.86 was more than just a number; it represented the culmination of a week marked by indecision and underlying bearish pressure. The index's inability to decisively break through the $29,260.86 resistance level on the 1H chart, coupled with its proximity to the $29,135.55 support, highlights a market at a critical juncture. The daily chart, while showing some potential for a bounce with Stochastic flashing a bullish signal (K=58.96, D=53.46), is still dominated by a bearish trend, confirmed by a strong ADX of 47.51. This divergence across timeframes is a classic sign of market indecision, where short-term oversold conditions are battling against a longer-term bearish trend. The overall picture suggests that any upward move might be met with significant selling pressure, especially if broader market sentiment, influenced by factors like the Dollar Index (DXY) and S&P 500, continues to lean negative. The $29,076.62 level on the 1H chart is particularly important; a sustained break below this point could trigger a cascade of sell orders, pushing the index much lower.
The strength of the downtrend on the daily timeframe is undeniable, with an ADX reading of 47.51 indicating a powerful bearish move is underway. This is further supported by the MACD histogram remaining firmly in negative territory, suggesting that sellers are in control of the longer-term narrative. However, the 1H chart presents a slightly different, albeit still cautious, perspective. Here, the RSI is hovering at 32.77, teetering on the edge of oversold territory. While this alone is not a buy signal, it suggests that the selling momentum might be exhausting itself in the very short term. The Stochastic indicator on the 1H chart (K=30.97, D=20.52) also shows a potential for a short-term bounce, as the %K line has crossed above the %D line. This is the kind of conflicting signal that keeps traders on edge, as it highlights the battle between short-term oversold conditions and the dominant bearish trend. The crucial question is whether these short-term technical readings can overcome the entrenched bearish sentiment.
The Bull's Roadmap: Navigating the Upside
For the bulls to regain control, a decisive break and sustained hold above key resistance levels are paramount. The immediate hurdle lies at the 1H resistance of $29,260.86. A move above this level, ideally with increased volume, would be the first sign of renewed buying interest. If this level is cleared, the next target would be the 1H resistance at $29,327.24. A successful breach of this mark would signal a potential shift in short-term momentum. However, the real test would be the ability to conquer the daily resistance zone, starting with $29,848.39. A sustained push above this level would be a significant bullish development, potentially signaling the end of the current downtrend and the start of a recovery. This scenario hinges on several factors: a weakening DXY, a positive shift in broader market sentiment (perhaps a rally in the S&P 500), and potentially dovish signals from upcoming economic data or central bank commentary. The RSI on the 1H chart, currently at 32.77, would need to climb decisively above 50, and ideally towards 70, to confirm a bullish reversal. Similarly, the MACD would need to produce a bullish crossover and push the histogram into positive territory. The Stochastic's current bullish cross is a nascent sign, but it needs confirmation from other indicators and sustained price action.
The path for a bullish reversal is not a smooth one. The underlying bearish trend, especially on the daily chart with its ADX at 47.51, presents significant headwinds. For any sustained upside, we would need to see a clear break of the daily resistance at $29,848.39. This level has acted as a significant ceiling in recent trading sessions, and overcoming it would require substantial buying pressure. The 4H chart, while showing a neutral trend (ADX 24.23), is still within the broader daily downtrend context. A bullish scenario would likely require the RSI on the 4H chart to break above 60, and the MACD to maintain positive momentum. The current Stochastic signal on the 4H (K=97.85, D=86.96) is in extreme overbought territory, suggesting that even if a bounce occurs, it might be short-lived and prone to profit-taking. Therefore, a true bullish scenario requires not just a break of immediate resistance, but a fundamental shift in market sentiment and sustained buying interest across multiple timeframes. It’s a scenario that currently appears less probable given the prevailing technical setup.
Where Bears Take Control: The Downside Scenario
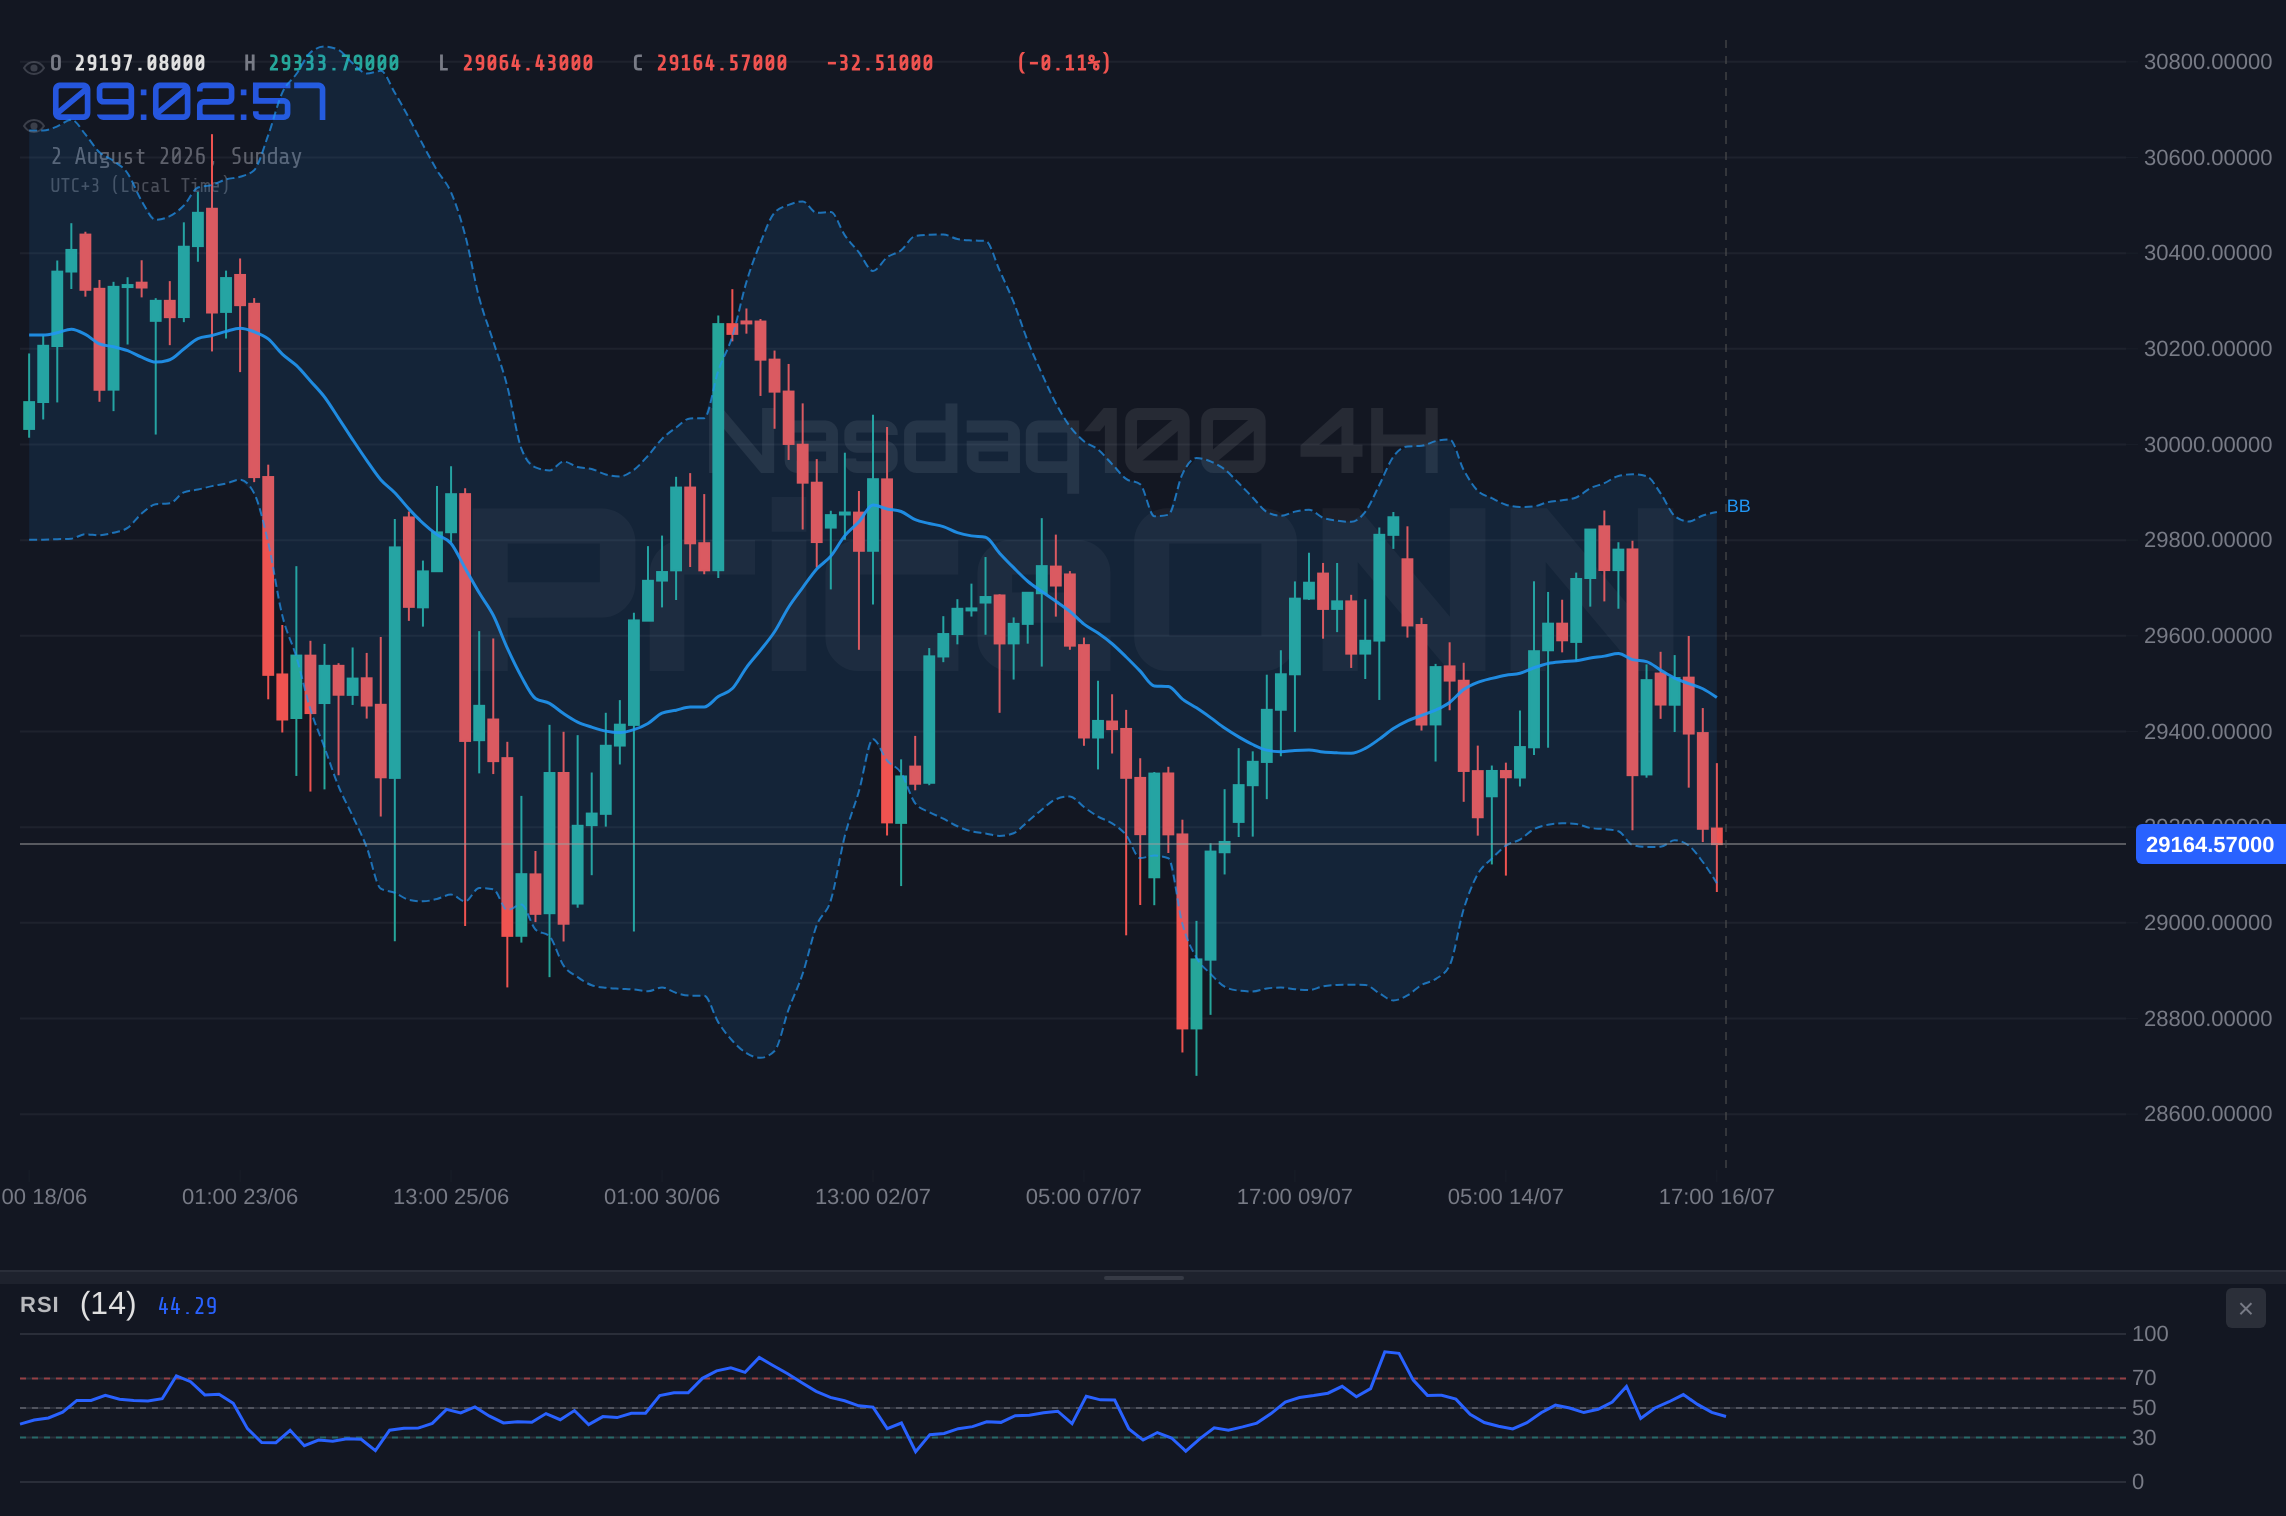
The bearish scenario seems more aligned with the current technicals, especially on the longer timeframes. If the Nasdaq100 fails to hold the immediate 1H support at $29,135.55, the path of least resistance is clearly downwards. The next significant support level to watch on the 1H chart is $29,076.62. A break and close below this level would likely trigger further selling, targeting the 1H support at $29,010.24. On the 4H chart, the support levels are $29,093.93, $28,991.28, and $28,813.77. A decisive move below $29,076.62 on the 1H could quickly lead to tests of these lower 4H supports. The daily chart provides even more concerning levels, with support at $28,852.38 and $28,511.31. The strong ADX of 47.51 on the daily chart indicates that if the price breaks lower, the downtrend could accelerate significantly. This bearish outlook is reinforced by the MACD histogram, which remains negative across multiple timeframes, and the RSI on the 1H chart, which, despite being near oversold, is still trending downwards. A weakening DXY, coupled with risk-off sentiment in other markets like the S&P 500 (currently showing a bearish signal on the 1D chart), would further bolster this scenario.
The bearish thesis gains further credibility when we consider the overall market context. The dollar index (DXY) is showing signs of strength, trading around 100.70, which typically puts pressure on riskier assets like the Nasdaq. The S&P 500, despite a recent uptick, has a bearish signal on its daily chart, indicating potential headwinds for the broader equity market. For the bearish scenario to fully play out, we would need to see a clear break below the $29,076.62 level on the 1H chart, followed by a decisive move below the 4H support at $28,991.28. This would likely confirm the daily downtrend's continuation, potentially targeting the $28,852.38 support level. The RSI would need to remain below 50, and the MACD would need to sustain its negative momentum. The Stochastic indicator, currently showing some divergence on the 1H, would need to reassert its bearish bias or at least not provide conflicting bullish signals. This scenario is plausible, especially if upcoming economic data, such as US Non-Farm Payrolls (NFP) or inflation figures, prove to be weaker than expected or if central bank rhetoric turns more hawkish, increasing demand for safe-haven assets and dampening risk appetite.
The Waiting Game: A Consolidation Scenario
A neutral or range-bound scenario for the Nasdaq100 would occur if the index fails to decisively break either the immediate support or resistance levels. This often happens when conflicting signals emerge across different timeframes or when the market awaits a significant catalyst, such as major economic data releases or central bank announcements. In such a scenario, the Nasdaq100 might oscillate between the 1H support at $29,135.55 and resistance at $29,260.86. The ADX readings, which are currently indicating strong trends on some timeframes (daily 47.51) but weaker trends on others (hourly 33.23, 4-hour 24.23), support the idea of a potential consolidation phase as these trends battle for dominance. The RSI readings, hovering in the neutral zone (1H: 32.77, 4H: 39.92, 1D: 46.36), also suggest a lack of strong directional conviction. During such a period, volatility might decrease, and price action could become choppy, with quick reversals at the boundaries of the range. This phase typically lasts until a significant event or a strong technical breakout occurs, forcing a resolution.
This consolidation phase could be characterized by trading within a defined range, perhaps between the 1H support of $29,135.55 and the 1H resistance of $29,260.86. Within this range, minor fluctuations might occur, but a sustained move in either direction would be unlikely without a significant catalyst. The market might be 'pricing in' upcoming events, such as the highly anticipated US Non-Farm Payrolls report, leading to a period of watchful waiting. During this time, traders might focus on scalping opportunities within the range or wait for a clear breakout signal. The ADX readings would likely remain subdued or fluctuate without establishing a strong directional trend. The MACD might show oscillating momentum, and the RSI could hover around the 50 level, reflecting the balanced battle between buyers and sellers. This scenario is plausible if upcoming economic data is mixed or if geopolitical tensions remain elevated but stable, creating an environment of uncertainty that prevents a strong directional move. It’s a phase where patience is key, and the focus shifts to risk management rather than aggressive directional bets.
Bears Consolidate Grip
65% ProbabilityRange-Bound Uncertainty
25% ProbabilityRally Potential Ignited
10% ProbabilityAssessing the Odds: Why Bears Lead
Given the current technical landscape, the bearish scenario holds the highest probability at 65%. The dominance of the downtrend on the daily chart, evidenced by the ADX of 47.51 and negative MACD momentum, cannot be ignored. While short-term indicators on the 1H chart show signs of exhaustion (RSI at 32.77, Stochastic bullish cross), they are not yet strong enough to signal a sustained trend reversal. The 4H chart also leans bearish, with a strong ADX of 29.63 and a clear downtrend signal from Stochastic. The immediate support at $29,135.55 on the 1H chart is the critical line in the sand. A break below this level would likely confirm the prevailing bearish sentiment and open the door for further downside, aligning with the dominant trend. The neutral scenario, with a 25% probability, reflects the market's current indecision and the potential for consolidation as it awaits key economic data. This could manifest as trading within the defined 1H range. The bullish scenario, currently assigned a low 10% probability, would require a significant shift in market dynamics, including a strong break of immediate resistance and a broader market sentiment turnaround, which does not appear imminent based on current data.
The conviction behind the bearish outlook is further strengthened by the correlation with broader market indicators. The Dollar Index (DXY) is currently trading at 100.70, showing upward momentum. A stronger dollar typically correlates with weaker risk assets, including the Nasdaq100. Furthermore, the S&P 500, a key risk appetite barometer, is showing bearish signals on its daily chart, reinforcing the risk-off sentiment. The Nasdaq100's own daily chart exhibits a strong downtrend (ADX 47.51), suggesting that the prevailing market conditions favor sellers. For the bullish case to materialize, we would need to see a significant change in these correlated indicators – a falling DXY, a rising S&P 500, and a clear bullish signal on the Nasdaq's daily chart, such as an RSI breaking above 50 and a bullish MACD crossover. Until then, the path of least resistance appears to be to the downside, making the bearish scenario the most probable outcome in the short to medium term.
Key Triggers to Watch This Week
As we look ahead to the upcoming trading week, several key triggers will be crucial in determining the Nasdaq100's direction. The most significant event on the horizon is the US Non-Farm Payrolls (NFP) report, scheduled for release next Friday. This report is a major driver of market sentiment, particularly concerning Federal Reserve policy. A stronger-than-expected NFP could reignite inflation concerns and bolster expectations for further interest rate hikes, potentially putting renewed downward pressure on the Nasdaq. Conversely, a weaker report might lead to hopes of a Fed pause or pivot, offering a potential catalyst for a bullish reversal. Traders will be scrutinizing not only the headline payroll number but also average hourly earnings and the unemployment rate for clues about the labor market's health and inflationary pressures.
Beyond the NFP report, traders should also monitor the DXY's movement. Any significant weakening of the dollar could provide a tailwind for the Nasdaq, especially if it's driven by shifting Fed rate expectations. Conversely, continued strength in the DXY, perhaps fueled by global economic uncertainty or geopolitical tensions, would likely add to the bearish pressure on the index. On the technical front, the immediate 1H support at $29,135.55 and resistance at $29,260.86 remain the most critical levels to watch in the intraday timeframe. A decisive break of either of these levels, confirmed by volume and sustained price action, will likely dictate the short-term direction. Additionally, keep an eye on the S&P 500's performance; its ability to hold its own support levels or break below them will offer further insight into the broader market sentiment and risk appetite, which heavily influences the Nasdaq100.
The technical structure itself provides ongoing triggers. On the 1H chart, the RSI is hovering near oversold territory at 32.77. A move back above 50 would be a short-term bullish signal, but it needs to be confirmed by other indicators. The MACD histogram's negative momentum is a persistent bearish signal that needs to flip positive for a sustained rally. On the daily chart, the strong ADX of 47.51 indicates that the current trend has conviction. For this trend to reverse, we would need to see the ADX fall below 25 and a sustained move in the opposite direction. The Stochastic indicator on the daily chart (K=58.96, D=53.46) is showing a bullish cross, but this needs to be sustained and move out of the neutral zone to be considered a strong signal. The interplay between these short-term buy signals and the longer-term sell signals will be the key focus for traders navigating this complex market environment. Patience and adherence to risk management principles will be paramount as the market digests incoming data and technical signals.
Frequently Asked Questions: Nasdaq100 Analysis
What happens if Nasdaq100 breaks below the $29,076.62 support level?
A sustained break below the 1H support at $29,076.62 would likely confirm the prevailing bearish sentiment, potentially triggering further selling pressure. This could lead to tests of the 4H support levels, starting with $28,991.28, as the dominant daily downtrend continues.
Is the current RSI reading of 32.77 on the 1H chart a buy signal for Nasdaq100?
While an RSI of 32.77 suggests oversold conditions are developing on the 1H chart, it is not a standalone buy signal, especially given the stronger bearish trend on daily charts. A confirmation from other indicators and sustained price action above immediate resistance would be needed.
How might the upcoming US Non-Farm Payrolls report affect Nasdaq100 trading this week?
A stronger-than-expected NFP report could increase fears of continued Fed rate hikes, pressuring the Nasdaq100 downwards. Conversely, a weaker report might fuel hopes of a Fed pause, potentially triggering a bullish reversal for the index.
Should traders consider buying Nasdaq100 if it holds the $29,135.55 support level?
Holding $29,135.55 support could lead to a short-term bounce towards $29,260.86 resistance. However, given the dominant daily downtrend (ADX 47.51), such a bounce might be limited. A more robust bullish confirmation would require breaking through higher resistance levels and a shift in overall market sentiment.
| Indicator | Value | Signal | Interpretation |
|---|---|---|---|
| RSI (14) | 32.77 | Bearish | Oversold conditions developing on 1H, but part of a larger downtrend. |
| MACD Histogram | -15.20 | Bearish | Negative momentum persists across timeframes. |
| Stochastic | K=30.97, D=20.52 | Bullish | Bullish cross on 1H, but needs confirmation against daily trend. |
| ADX | 33.23 | Bearish | Strong downtrend confirmed on 1H. |
| Bollinger | Middle Band | Watch | Price is below the middle band, indicating bearish pressure. |
Track markets in real-time
AI-powered analysis, technical indicators and real-time price data.
Join Our Telegram Channel
Breaking market news, AI analysis and trading signals instantly.
Join Channel