

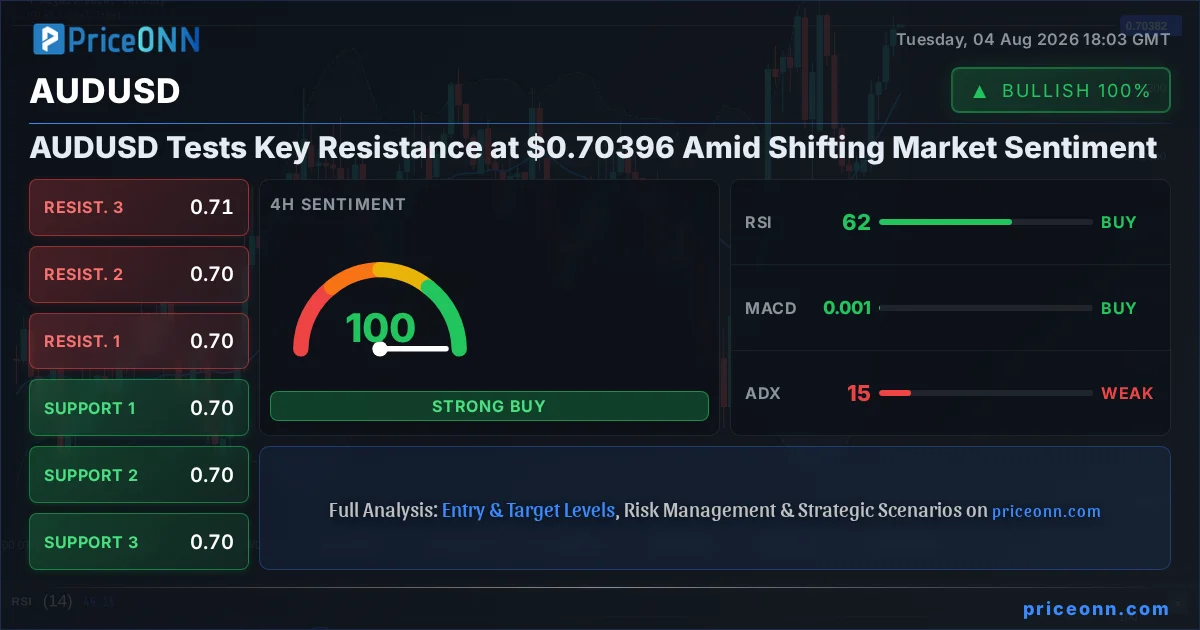
The Australian Dollar against the US Dollar (AUDUSD) is currently finding itself at a critical juncture, hovering just below the significant resistance level of $0.70396. This price point represents not just a technical barrier, but a pivotal moment where the pair's immediate direction could be determined. With the latest market data showing AUDUSD trading precisely at $0.70396, the tug-of-war between bullish aspirations and bearish pressures is palpable. Traders are closely watching to see if the momentum behind the recent uptick is strong enough to break through this level, or if a reversal is imminent.
- AUDUSD is testing resistance at $0.70396, a critical level for determining short-term direction.
- The RSI at 69.97 on the 1H chart signals strong upward momentum but approaches overbought territory, suggesting potential caution.
- On the daily chart, ADX at 13.77 indicates a weak trend, meaning the current move may lack sustained conviction.
- Correlation analysis with the DXY, currently at 99.93, shows a potential drag on AUDUSD if the dollar strengthens further.
The narrative surrounding AUDUSD has been one of cautious optimism recently, with the pair attempting to claw back some of its earlier losses. However, the current price action around $0.70396 suggests that the path higher is far from guaranteed. The 1-hour chart reveals a strong upward trend with a high conviction percentage (98%), supported by a robust RSI reading of 69.97. This suggests that buyers have been in control in the short term, pushing the price towards the upper limits of its recent trading range. The Stochastic Oscillator, with %K at 84.44 and %D at 85.42, also indicates an overbought condition, which, while confirming bullish strength, also raises a yellow flag for potential profit-taking or a short-term stall.
Diving deeper into the technical indicators, the MACD on the 1-hour timeframe shows positive momentum, with the MACD line positioned above its signal line, further reinforcing the short-term bullish sentiment. Bollinger Bands on this timeframe are also trading above the middle band, indicating an upward bias. However, it's the ADX at 25.28 that provides a more nuanced view; while it suggests a strong uptrend, it also hints at the possibility of a developing trend rather than a fully established one. This blend of strong short-term signals and slightly weaker trend strength creates a complex picture at the key $0.70396 resistance.
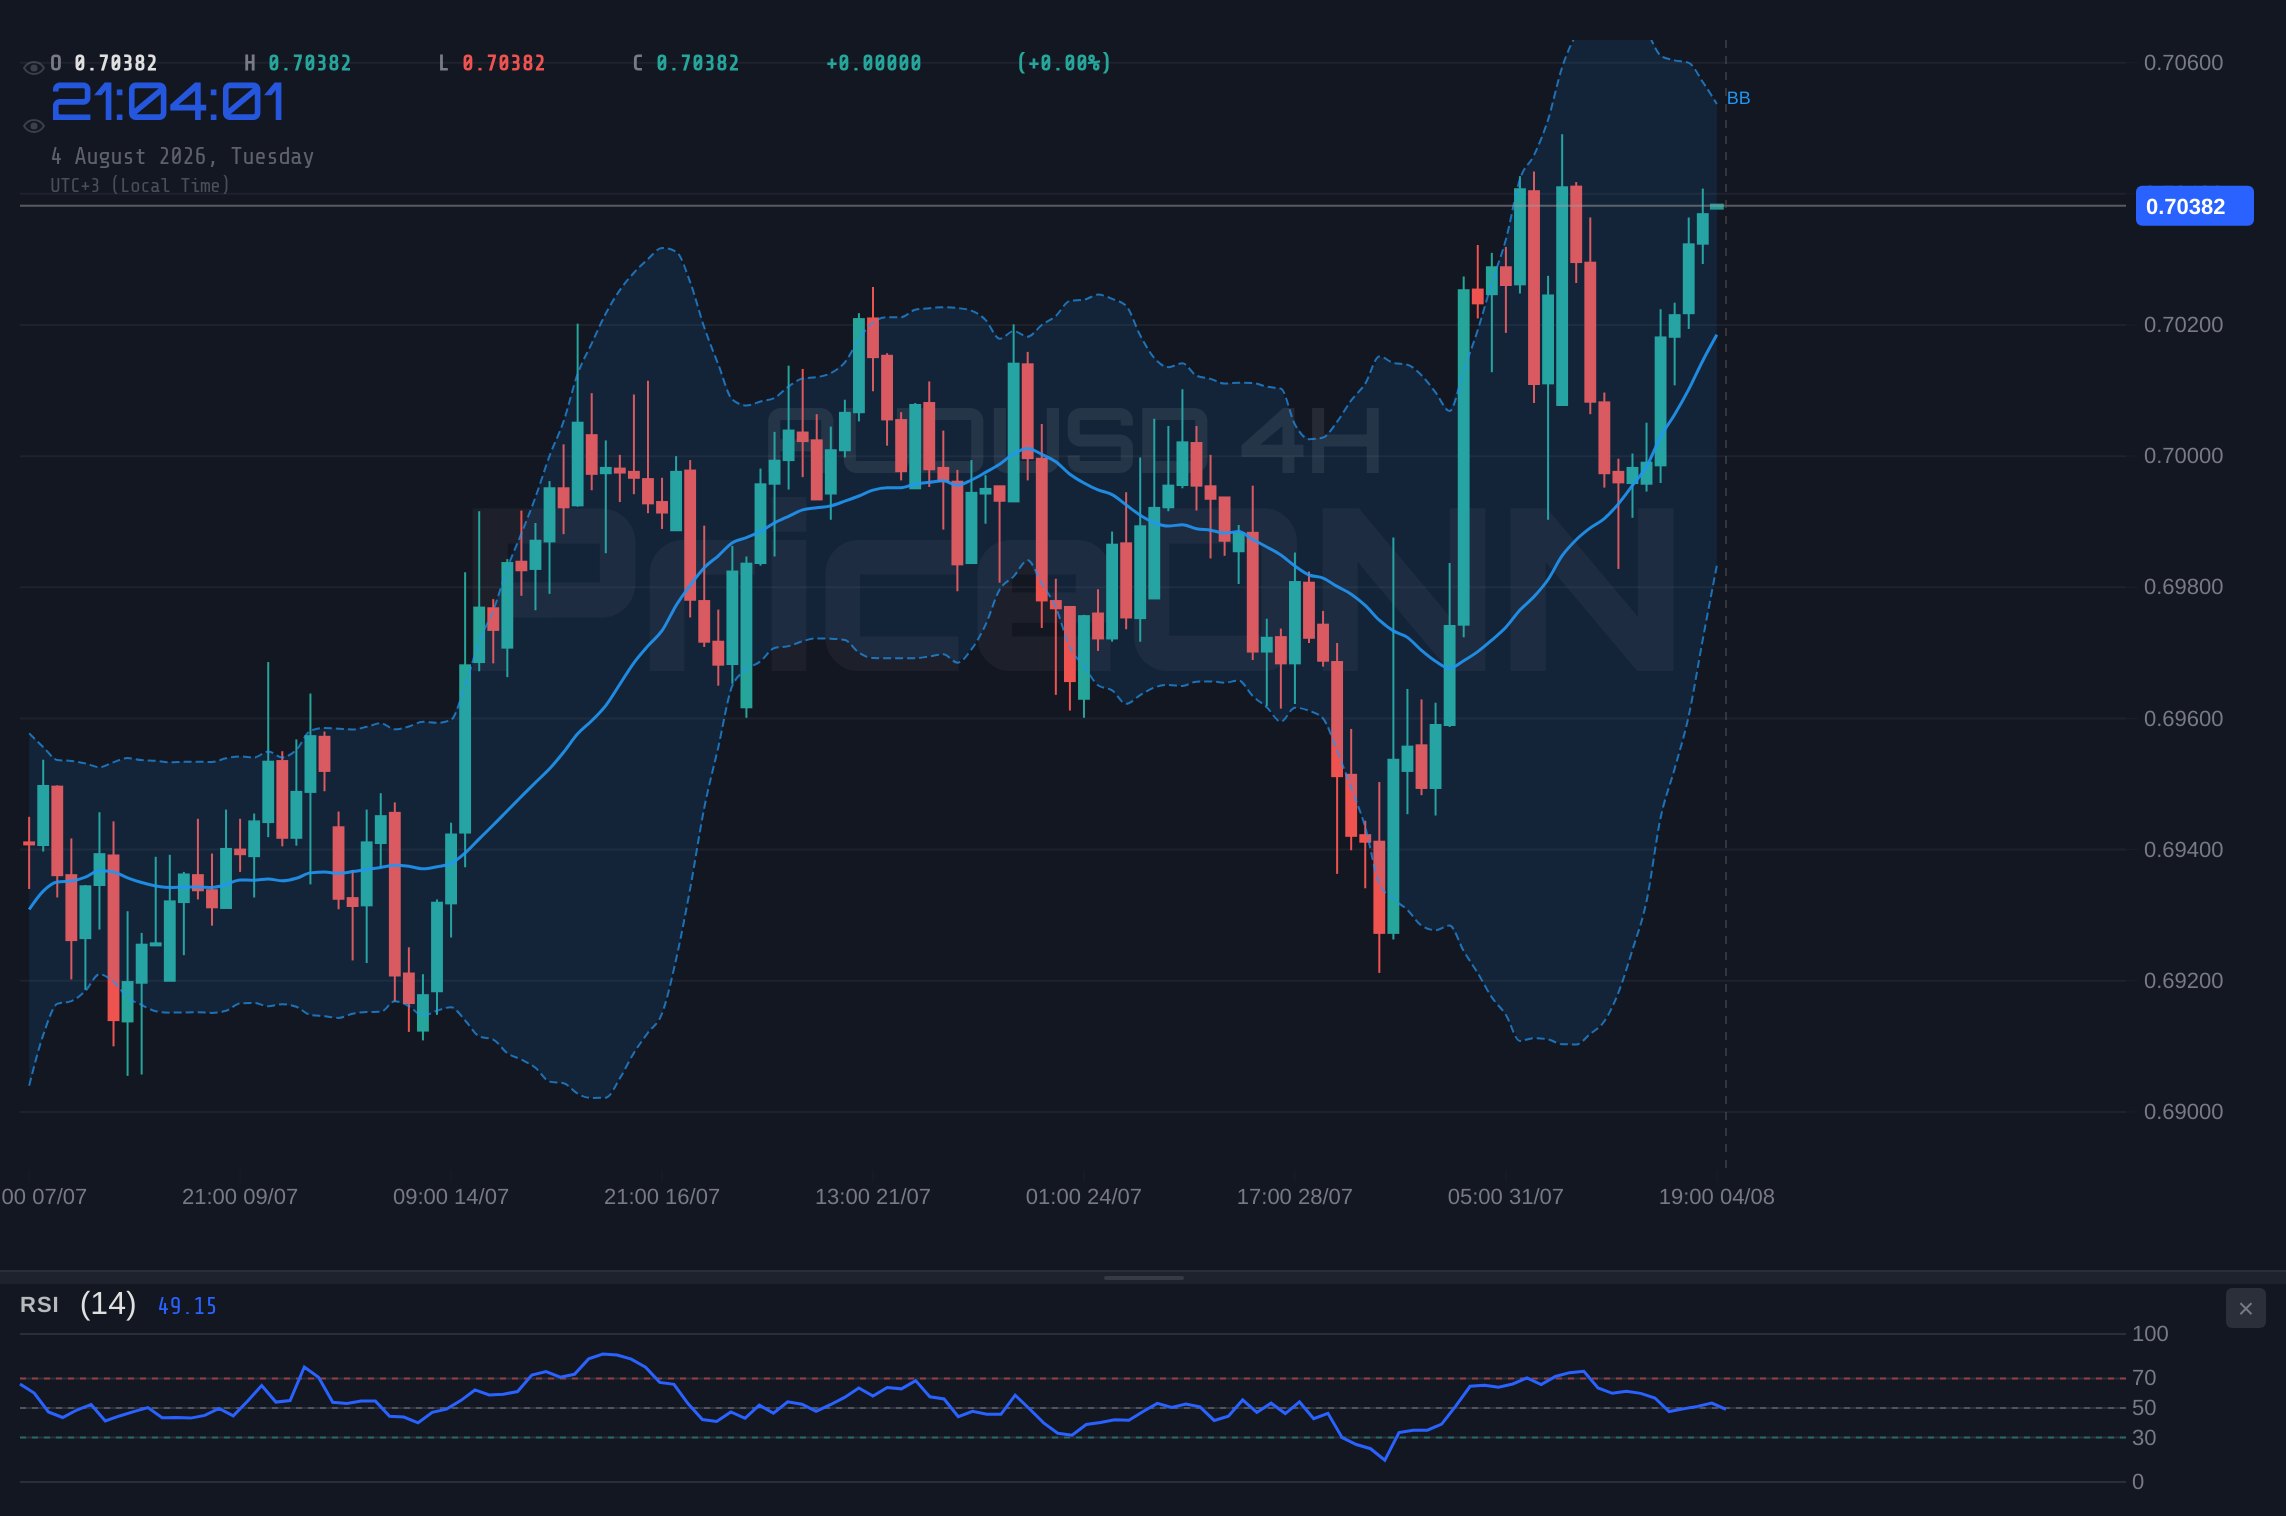
Shifting our focus to the 4-hour timeframe, the trend remains firmly in the bullish camp, albeit with a slightly lower conviction percentage of 87%. The RSI here is at 61.7, still comfortably in neutral territory but indicating a continued upward bias. The Stochastic Oscillator's position, with %K at 78.52 and %D at 43.93, continues to signal a bullish trend, with %K significantly above %D. The MACD also maintains positive momentum. However, the ADX reading on the 4-hour chart drops to a more moderate 14.93. This suggests that while the broader upward move is in play, the trend strength is weakening as we move into higher timeframes. This divergence in trend strength between the 1-hour and 4-hour charts is a crucial observation for traders trying to gauge the sustainability of any potential breakout above $0.70396.
The daily timeframe presents a different perspective, shifting the trend to neutral with a 50% conviction. Here, the RSI stands at 57.78, still in the neutral zone but showing a slight upward inclination. The Stochastic Oscillator, with %K at 83.11 and %D at 59.41, is in overbought territory and signals a potential rise, but the ADX at 13.77 is the most telling indicator. An ADX value this low on a daily chart signifies a very weak trend. This implies that the current price action, while showing some upward movement, is not supported by a strong, established trend on the daily basis. This lack of a strong daily trend means that any move above $0.70396 might be more susceptible to reversals if broader market forces or fundamental shifts come into play.
The interplay between AUDUSD and the US Dollar Index (DXY) is a crucial element to consider. The DXY is currently trading at 99.93, showing a slight downward movement but remaining a significant factor. Historically, a stronger dollar often puts pressure on AUDUSD, as it makes the Australian dollar relatively more expensive for holders of US dollars. Conversely, a weaker DXY can provide a tailwind for AUDUSD. With the DXY hovering around the 100 mark, a psychological level of significance, any decisive move in either direction could have a magnified impact on AUDUSD. If the DXY were to break decisively below 99.83, it could provide the necessary impetus for AUDUSD to clear the $0.70396 resistance. Conversely, a strong rebound in the DXY from current levels could be the catalyst for a reversal in AUDUSD.
Adding to the complexity, recent news flow offers mixed signals. Reports indicate that the Reserve Bank of Australia (RBA) might be done with its hiking cycle, while there's speculation about further tightening from the Reserve Bank of New Zealand (RBNZ). This divergence in central bank policy expectations between Australia and its neighbor could influence the AUD's performance against other currencies, though its direct impact on AUDUSD needs careful monitoring. Furthermore, recent analyst reports highlight Freeport-McMoran Copper & Gold as a top metals pick, and Fresnillo's profit tripling due to surging gold and silver prices. While these are commodity-specific, they underscore a broader strength in precious metals, which can sometimes correlate with commodity currencies like the AUD, but this is not a direct driver for AUDUSD itself.
The recent Forex news also provides context. Reports suggest that GBP/USD could push higher if buyers hold control, and EUR/USD is building on gains, with bulls eyeing higher levels. These movements in major currency pairs, especially EUR/USD, can sometimes spill over into AUDUSD due to correlations and general market sentiment. The fact that EUR/USD is showing resilience and potentially pushing higher could indirectly support AUDUSD if the overall sentiment towards the US dollar weakens. However, the specific drivers for EUR/USD might differ from those impacting AUDUSD, making this correlation a secondary factor.
Let's consider the implications of the current technical picture for different trading styles. For short-term traders, the 1-hour chart presents an immediate challenge at $0.70396. A confirmed break and hold above this level, ideally with increasing volume, could signal an intraday opportunity to target higher resistance levels like $0.70405. However, the overbought Stochastic and RSI readings suggest caution, and a failure to break through could lead to a quick pullback towards the $0.70344 support. Swing traders will likely be more focused on the daily timeframe. The neutral trend and weak ADX mean that a sustained move is less likely without a significant catalyst. They might look for confirmation on the daily close – a strong daily candle above $0.70396 would be more convincing than a short-term hourly push.
The economic calendar also holds potential catalysts. While specific upcoming events for the Australian or US economies were not detailed in the provided data, general market awareness dictates that key inflation and employment figures, as well as central bank commentary, are always critical for currency pairs. Any unexpected data that shifts the outlook for the RBA or the Federal Reserve could dramatically alter the AUDUSD's trajectory. For instance, stronger-than-expected US inflation data could bolster the DXY and put AUDUSD under renewed pressure, while positive Australian employment figures could provide the necessary support for a breakout above $0.70396.
Looking at the broader market context, the S&P 500 is showing strong upward momentum, trading at 6572.87 with a 0.74% daily gain. This risk-on sentiment in equities can sometimes be supportive of riskier currencies like the Australian dollar. However, the Nasdaq 100's even stronger surge to 29705.22 suggests a tech-heavy rally, which doesn't always translate directly into strength for commodity currencies. The Dow Jones Industrial Average is also up significantly at 54177. If equity markets continue to climb, it might provide a backdrop for AUDUSD to attempt a move higher. Conversely, any sign of weakness in these major indices could quickly turn sentiment against AUDUSD.
The energy markets present another layer of complexity. Brent crude oil is trading at $78.75, showing a significant daily drop of 4.57%. WTI crude is also down, at $76.80. Lower oil prices can sometimes be a headwind for commodity currencies, as they can reflect weakening global demand or easing inflationary pressures. If the decline in oil prices continues, it might indirectly weigh on AUDUSD, especially if it signals broader economic concerns. However, the correlation is not always direct, and other factors like interest rate differentials and commodity-specific supply/demand dynamics play a larger role.
Considering the confluence of technical signals, the AUDUSD finds itself at a critical resistance point of $0.70396. The short-term charts show bullish momentum, but the longer-term charts and indicators like ADX suggest a lack of strong trend conviction. The overbought conditions on shorter timeframes also warrant caution. The DXY's position near a psychological level and the mixed signals from equity and energy markets add further layers of uncertainty. Therefore, while a breakout is possible, the conditions suggest a high degree of choppiness and a need for clear confirmation before committing to a direction.
The current technical setup for AUDUSD, with price action consolidating around the $0.70396 resistance, presents a classic scenario where patience is paramount. The conflicting signals across different timeframes - strong short-term momentum versus weak daily trend strength - mean that a decisive move is unlikely without a clear catalyst. Traders should be wary of premature entries, either long or short, until a more defined picture emerges. The key will be observing how the pair behaves if it attempts to push through $0.70396 or conversely, if it pulls back towards the support levels identified.
The next few hours and days will be crucial for AUDUSD. A sustained push above $0.70396, supported by increasing volume and positive follow-through on the daily chart, could open the door for further upside towards resistance levels such as $0.70405 and $0.70430. However, a failure to break this resistance, coupled with a reversal in the DXY or a dip in global equities, could see the pair retreat towards the support at $0.70344. The lack of a strong daily trend suggests that any move might be range-bound until a clearer fundamental or technical signal emerges.
Market Scenarios for AUDUSD
Bearish Scenario: Resistance Holds Firm
65% ProbabilityConsolidation Scenario: Range-Bound Action
25% ProbabilityBullish Scenario: Breakout Above Resistance
10% ProbabilityFrequently Asked Questions: AUDUSD Analysis
What happens if AUDUSD breaks above the $0.70396 resistance level?
A sustained break above $0.70396, particularly on the 4-hour chart with increased volume, could signal further upside potential. The immediate target would be $0.70405, followed by $0.70430, though the low ADX on the daily chart (13.77) suggests this breakout might lack strong trend conviction.
Is the RSI at 69.97 a sell signal for AUDUSD right now?
An RSI reading of 69.97 on the 1-hour chart indicates strong bullish momentum but is approaching overbought territory. It's not a direct sell signal on its own, but it suggests that the upward pace might be unsustainable in the very short term, increasing the probability of a pullback or consolidation around current levels.
How will the current DXY level of 99.93 affect AUDUSD this week?
The DXY hovering around 99.93 presents a mixed outlook. A further decline in the DXY could support AUDUSD's attempt to break resistance, potentially targeting $0.70405. However, if the DXY rebounds from this psychological level, it could exert downward pressure on AUDUSD, potentially leading to a test of support around $0.70344.
Should I consider trading AUDUSD if it stays between $0.70301 and $0.70396?
Given the weak daily trend (ADX 13.77) and mixed signals, a consolidation scenario between $0.70301 and $0.70396 is plausible, carrying a 25% probability. Traders might look for short-term opportunities within this range, but confirmation is key, as a breakout in either direction could signal a more significant move.
The path forward for AUDUSD hinges on its ability to decisively break or hold the $0.70396 resistance. The technical indicators offer a complex tapestry of short-term strength and longer-term uncertainty. While the bulls have shown resilience, the lack of a strong daily trend and the approaching overbought conditions on shorter timeframes suggest that caution is warranted. The market is ripe for a clear signal, and until then, navigating these levels requires a disciplined approach, focusing on price action and confirmation rather than chasing immediate moves.
Track markets in real-time
AI-powered analysis, technical indicators and real-time price data.
Join Our Telegram Channel
Breaking market news, AI analysis and trading signals instantly.
Join Channel