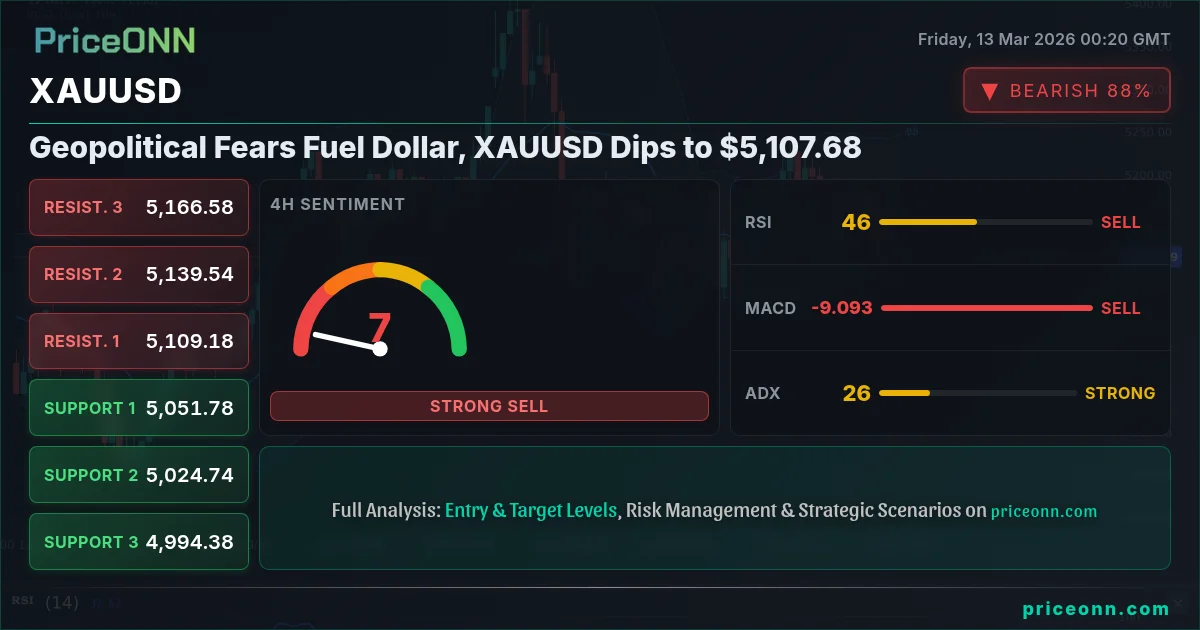
The tug-of-war between bulls and bears in the gold market intensifies as XAUUSD dips to $5,107.68 amid escalating geopolitical tensions fueling a surge in the US dollar. The question now is whether this pullback represents a buying opportunity or a signal of deeper correction.
- RSI at 39.23 on the 1H chart suggests further downside potential in the short term.
- Critical support sits at $5,080.26, which, if broken, could trigger a sell-off towards $5,064.82.
- MACD histogram shows negative momentum, indicating that the bears are currently in control.
- DXY strength, driven by safe-haven demand, is exerting downward pressure on XAUUSD.
The Bull Case for Gold: Safe-Haven Demand and Inflation Hedge
Gold has long been considered a safe-haven asset, and heightened geopolitical uncertainties often drive investors towards it. The ongoing tensions in the Middle East, as reported by several news outlets, are creating a risk-off environment. This traditionally benefits gold, but the simultaneous strengthening of the US dollar, currently trading at 99.38 on the DXY, is complicating the picture. A weaker dollar generally supports gold prices, but when geopolitical fears are paramount, the dollar can also act as a safe haven, creating a competing dynamic.
Furthermore, gold is viewed as an inflation hedge. While inflation data has been relatively contained recently, the massive stimulus measures implemented over the past few years continue to linger in the global economy. If inflation resurges, gold could regain its footing as a store of value. The rising oil prices, with Brent crude at $101.85 and WTI crude at $95.27, are adding to inflationary concerns and could provide a floor for gold prices. The "Oil Prices Soar as Middle East Conflict Triggers Record Supply Disruption" news highlights this risk.
The Bear Case for Gold: Dollar Dominance and Rising Yields
The primary headwind for gold is the strength of the US dollar. As the DXY climbs, it makes gold more expensive for international buyers, dampening demand. The dollar's rise is fueled by expectations of continued hawkishness from the Federal Reserve. If the Fed signals further interest rate hikes, the dollar could strengthen further, putting additional pressure on gold. According to Reuters, Fed officials remain concerned about persistent inflation, which could lead to more aggressive monetary policy tightening.
Rising Treasury yields also pose a threat to gold. As yields increase, the opportunity cost of holding gold, which doesn't pay interest, rises. The market is closely watching upcoming economic data releases, particularly the GBP data and USD data scheduled for today, as they could influence the trajectory of interest rates and, consequently, gold prices. If these figures indicate stronger economic growth or higher inflation, yields could climb, weighing on gold.
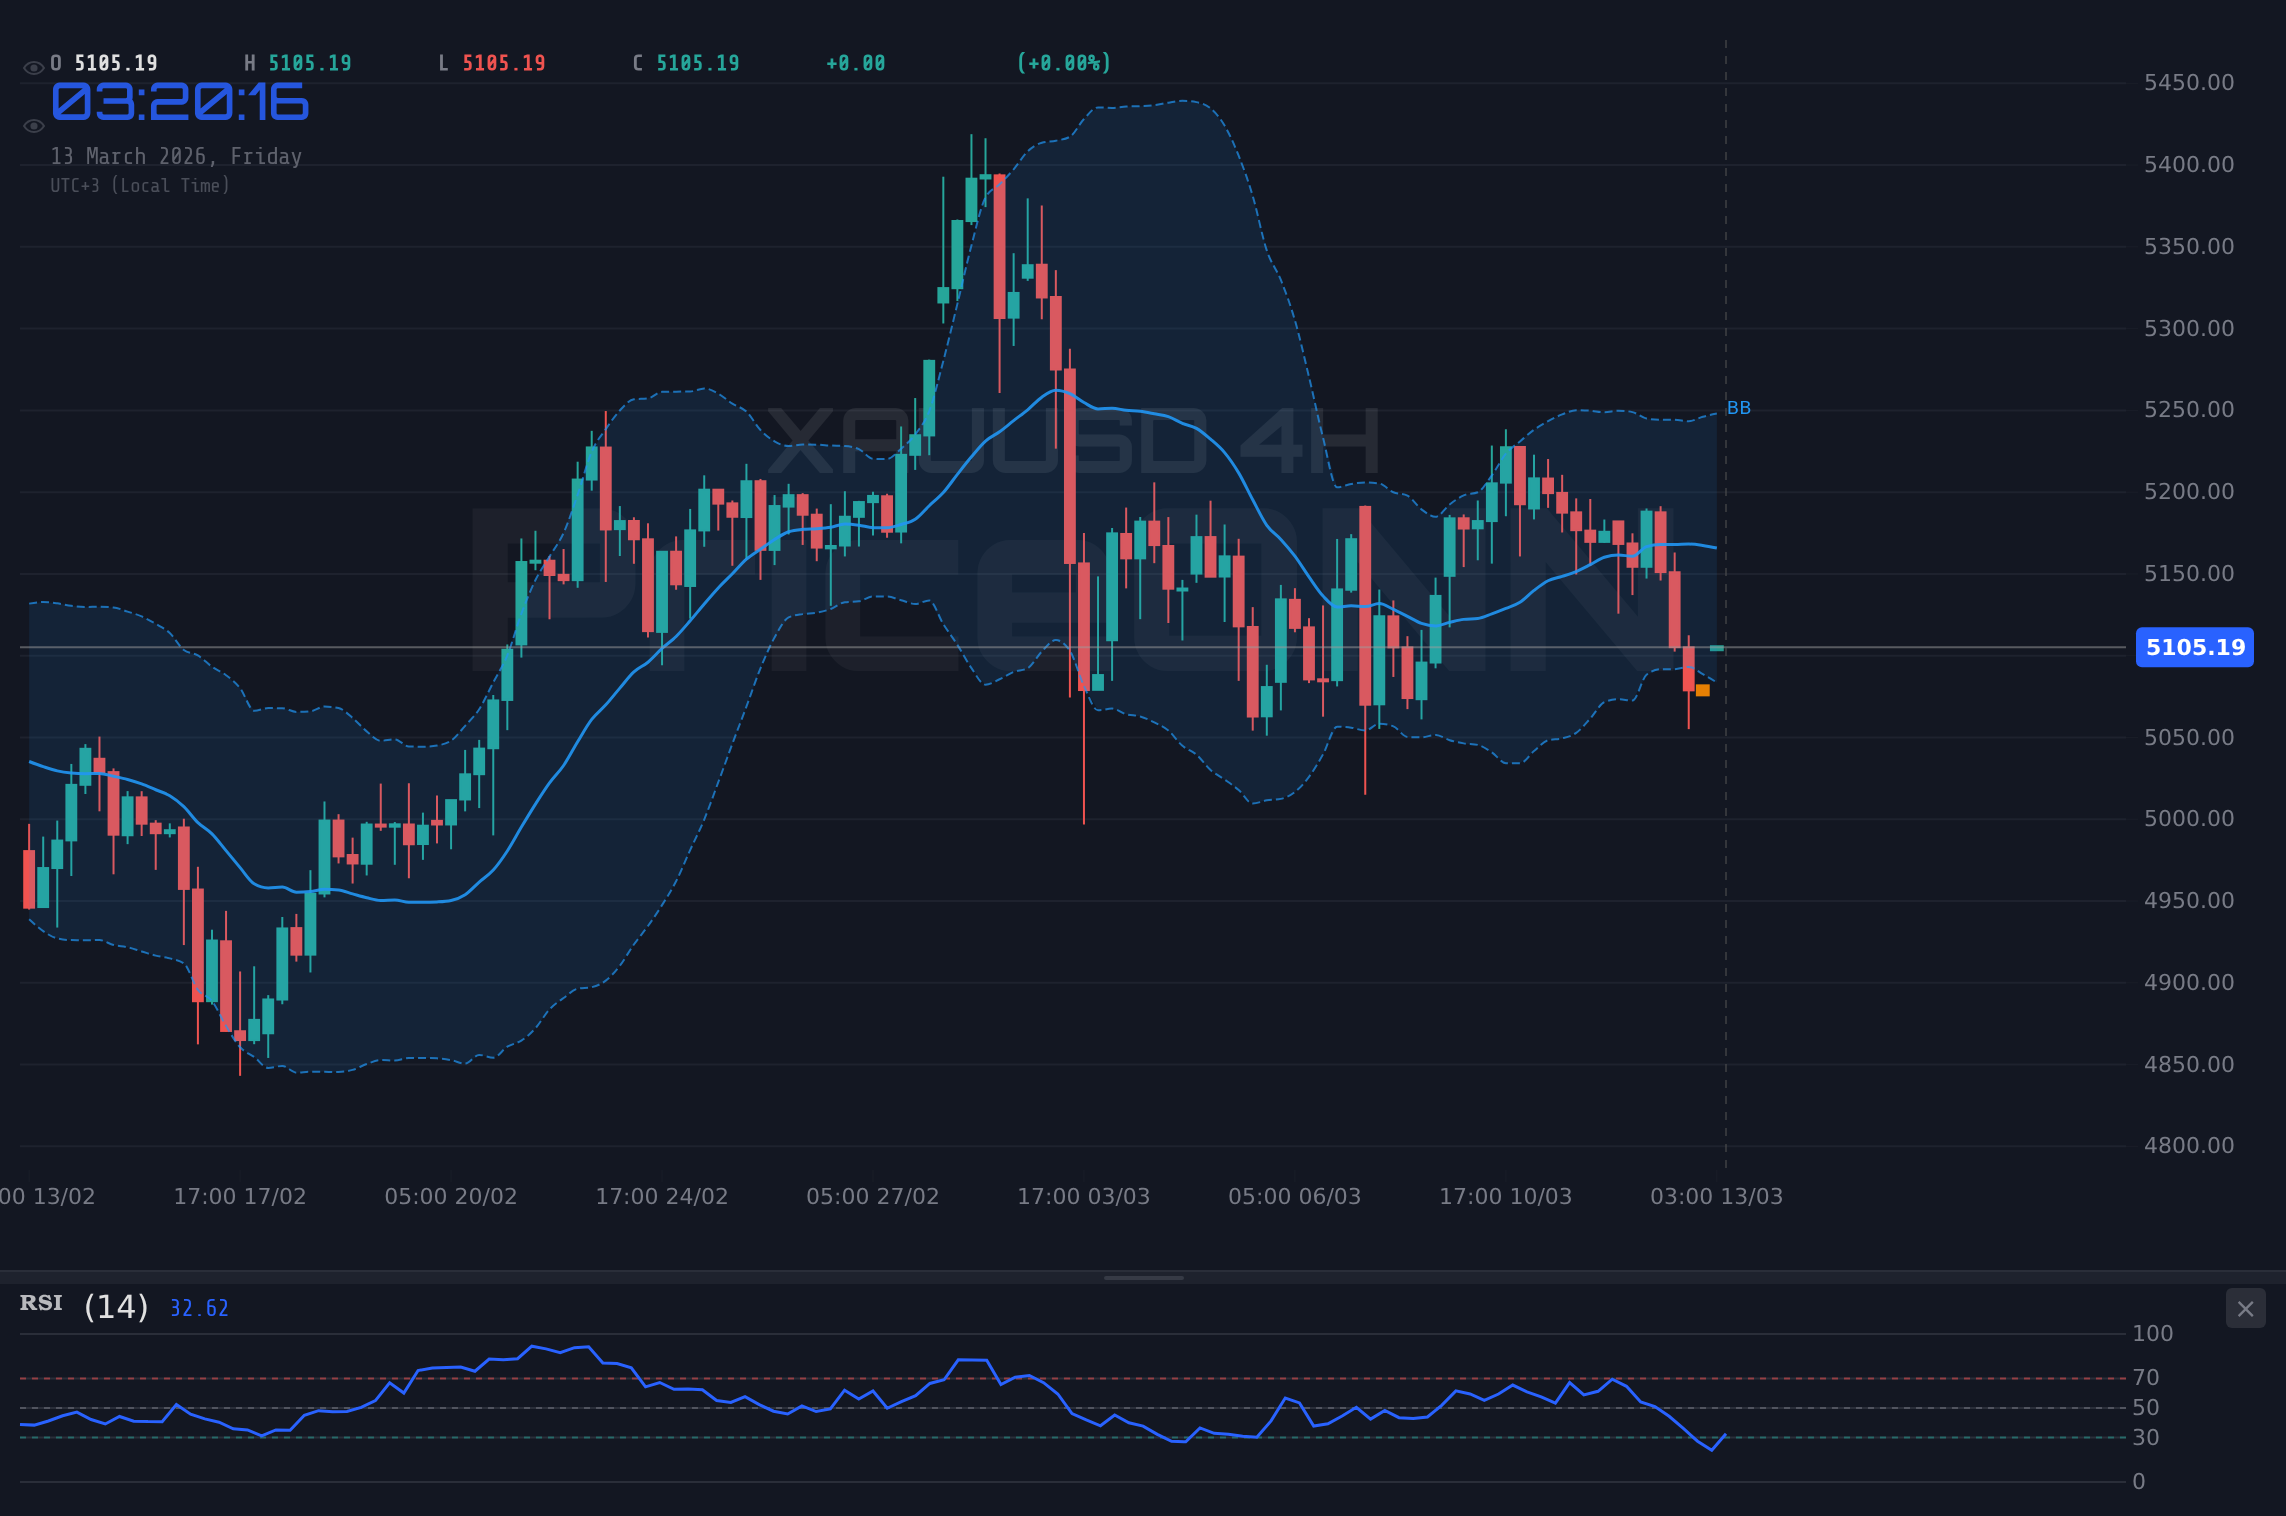
XAUUSD Technical Analysis: A Battleground at $5,100
From a technical perspective, XAUUSD is at a critical juncture. The 1H chart shows a clear downtrend, with the price trading below the middle band of the Bollinger Bands. The RSI at 39.23 suggests that there is still room for further downside before the market becomes oversold. The MACD histogram confirms the negative momentum, indicating that the bears are currently in control. However, the Stochastic oscillator shows a potential bullish signal, with K=32.61 crossing above D=14.48, suggesting a possible short-term bounce.
On the 4H chart, the trend is neutral, but the indicators are leaning bearish. The RSI at 41.7 is in neutral territory but trending downward. The MACD is also negative, and the Stochastic shows a bearish signal, with K=22.23 below D=33.02. The ADX at 25.31 indicates a moderately strong downtrend. Key support levels to watch are $5,084.13, $5,063.01, and $5,023.52. Resistance levels are $5,144.74, $5,184.23, and $5,205.35.
Zooming out to the 1D chart, the trend is also neutral, but the indicators are mixed. The RSI at 51.69 is in neutral territory and trending upward. The MACD is negative, but the Stochastic shows a bullish signal, with K=38.35 above D=35.22. The ADX at 11.96 indicates a weak trend, suggesting that the market is in a consolidation phase. Key support levels are $5,142.66, $5,109.56, and $5,069.42. Resistance levels are $5,215.9, $5,256.04, and $5,289.14.
XAUUSD Trade Plan: Short-Term Bearish Bias
Considering the technical picture and the fundamental drivers, a short-term bearish bias seems appropriate for XAUUSD. The strength of the dollar and the potential for further interest rate hikes are significant headwinds. The technical indicators on the shorter timeframes also support a move lower. However, traders should be mindful of the potential for a short-term bounce, given the oversold conditions and the bullish Stochastic signal on the 1H chart.
XAUUSD breaks below the immediate support at $5,080.26, triggering a sell-off towards $5,064.82 and potentially $5,057.06. Continued dollar strength and hawkish Fed comments fuel the decline.
XAUUSD finds support at $5,080.26 and bounces back towards the resistance at $5,103.46. A break above this level could lead to a test of $5,111.22. Weaker-than-expected economic data or dovish Fed comments trigger the recovery.
Impact of Economic Calendar Events
The upcoming economic data releases, particularly the GBP data and USD data scheduled for today (Friday), could significantly impact XAUUSD. Stronger-than-expected data could reinforce the dollar's strength and weigh on gold, while weaker-than-expected data could provide a boost to gold. Traders should closely monitor these releases and adjust their positions accordingly. The previous USD data released on Tuesday lacked actual figures which left the market uncertain about the dollar's direction.
The Geopolitical Landscape and XAUUSD
Geopolitical risks continue to play a significant role in the gold market. The ongoing tensions in the Middle East, particularly involving the tensions, are creating a risk-off environment that could support gold prices. However, as seen recently, these tensions can also lead to a flight to safety in the US dollar, creating a competing dynamic. Traders should carefully assess the evolving geopolitical landscape and its potential impact on XAUUSD.
Frequently Asked Questions: XAUUSD Analysis
What happens if XAUUSD breaks below $5,080.26 support?
A break below the $5,080.26 support level could trigger a sell-off towards the next support at $5,064.82, potentially leading to further declines towards $5,057.06. This scenario would likely be driven by continued dollar strength and hawkish comments from the Federal Reserve.
Should I buy XAUUSD at current levels of $5,107.68 given the RSI at 39.23?
With the RSI at 39.23 on the 1H chart, XAUUSD is not yet oversold, suggesting that there is still room for further downside. Therefore, buying at current levels may be premature. It would be prudent to wait for a more oversold reading or a clear bullish reversal signal before initiating a long position.
Is the negative MACD signal on the 4H chart a reliable indicator for XAUUSD?
The negative MACD signal on the 4H chart confirms the bearish momentum in XAUUSD. However, it is important to consider other indicators and factors before making a trading decision. The Stochastic oscillator, for example, shows a potential bullish signal on the 1H chart, suggesting a possible short-term bounce.
How will the upcoming USD data affect XAUUSD this week?
The upcoming USD data releases today (Friday) are crucial for XAUUSD. Stronger-than-expected data could reinforce the dollar's strength and weigh on gold, while weaker-than-expected data could provide a boost to gold. Traders should closely monitor these releases and adjust their positions accordingly.
Technical Outlook Summary
| Indicator | Value | Signal |
|---|---|---|
| RSI (14) | 39.23 | Neutral |
| MACD Histogram | Negative | Bearish |
| Stochastic | K=32.61, D=14.48 | Bullish |
| ADX | 40.41 | Strong Downtrend |
| Bollinger | Middle Band | Watch |
Key Levels
Support Levels
Resistance Levels
Track markets in real-time
AI-powered analysis, technical indicators and real-time price data.
Join Our Telegram Channel
Breaking market news, AI analysis and trading signals instantly.
Join Channel