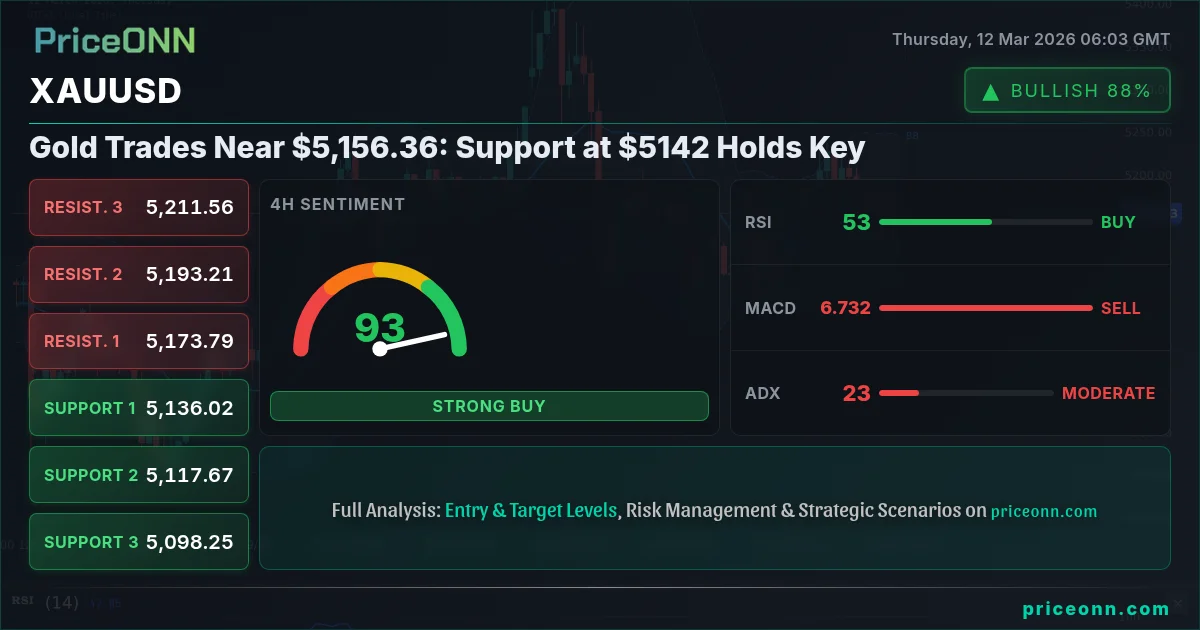
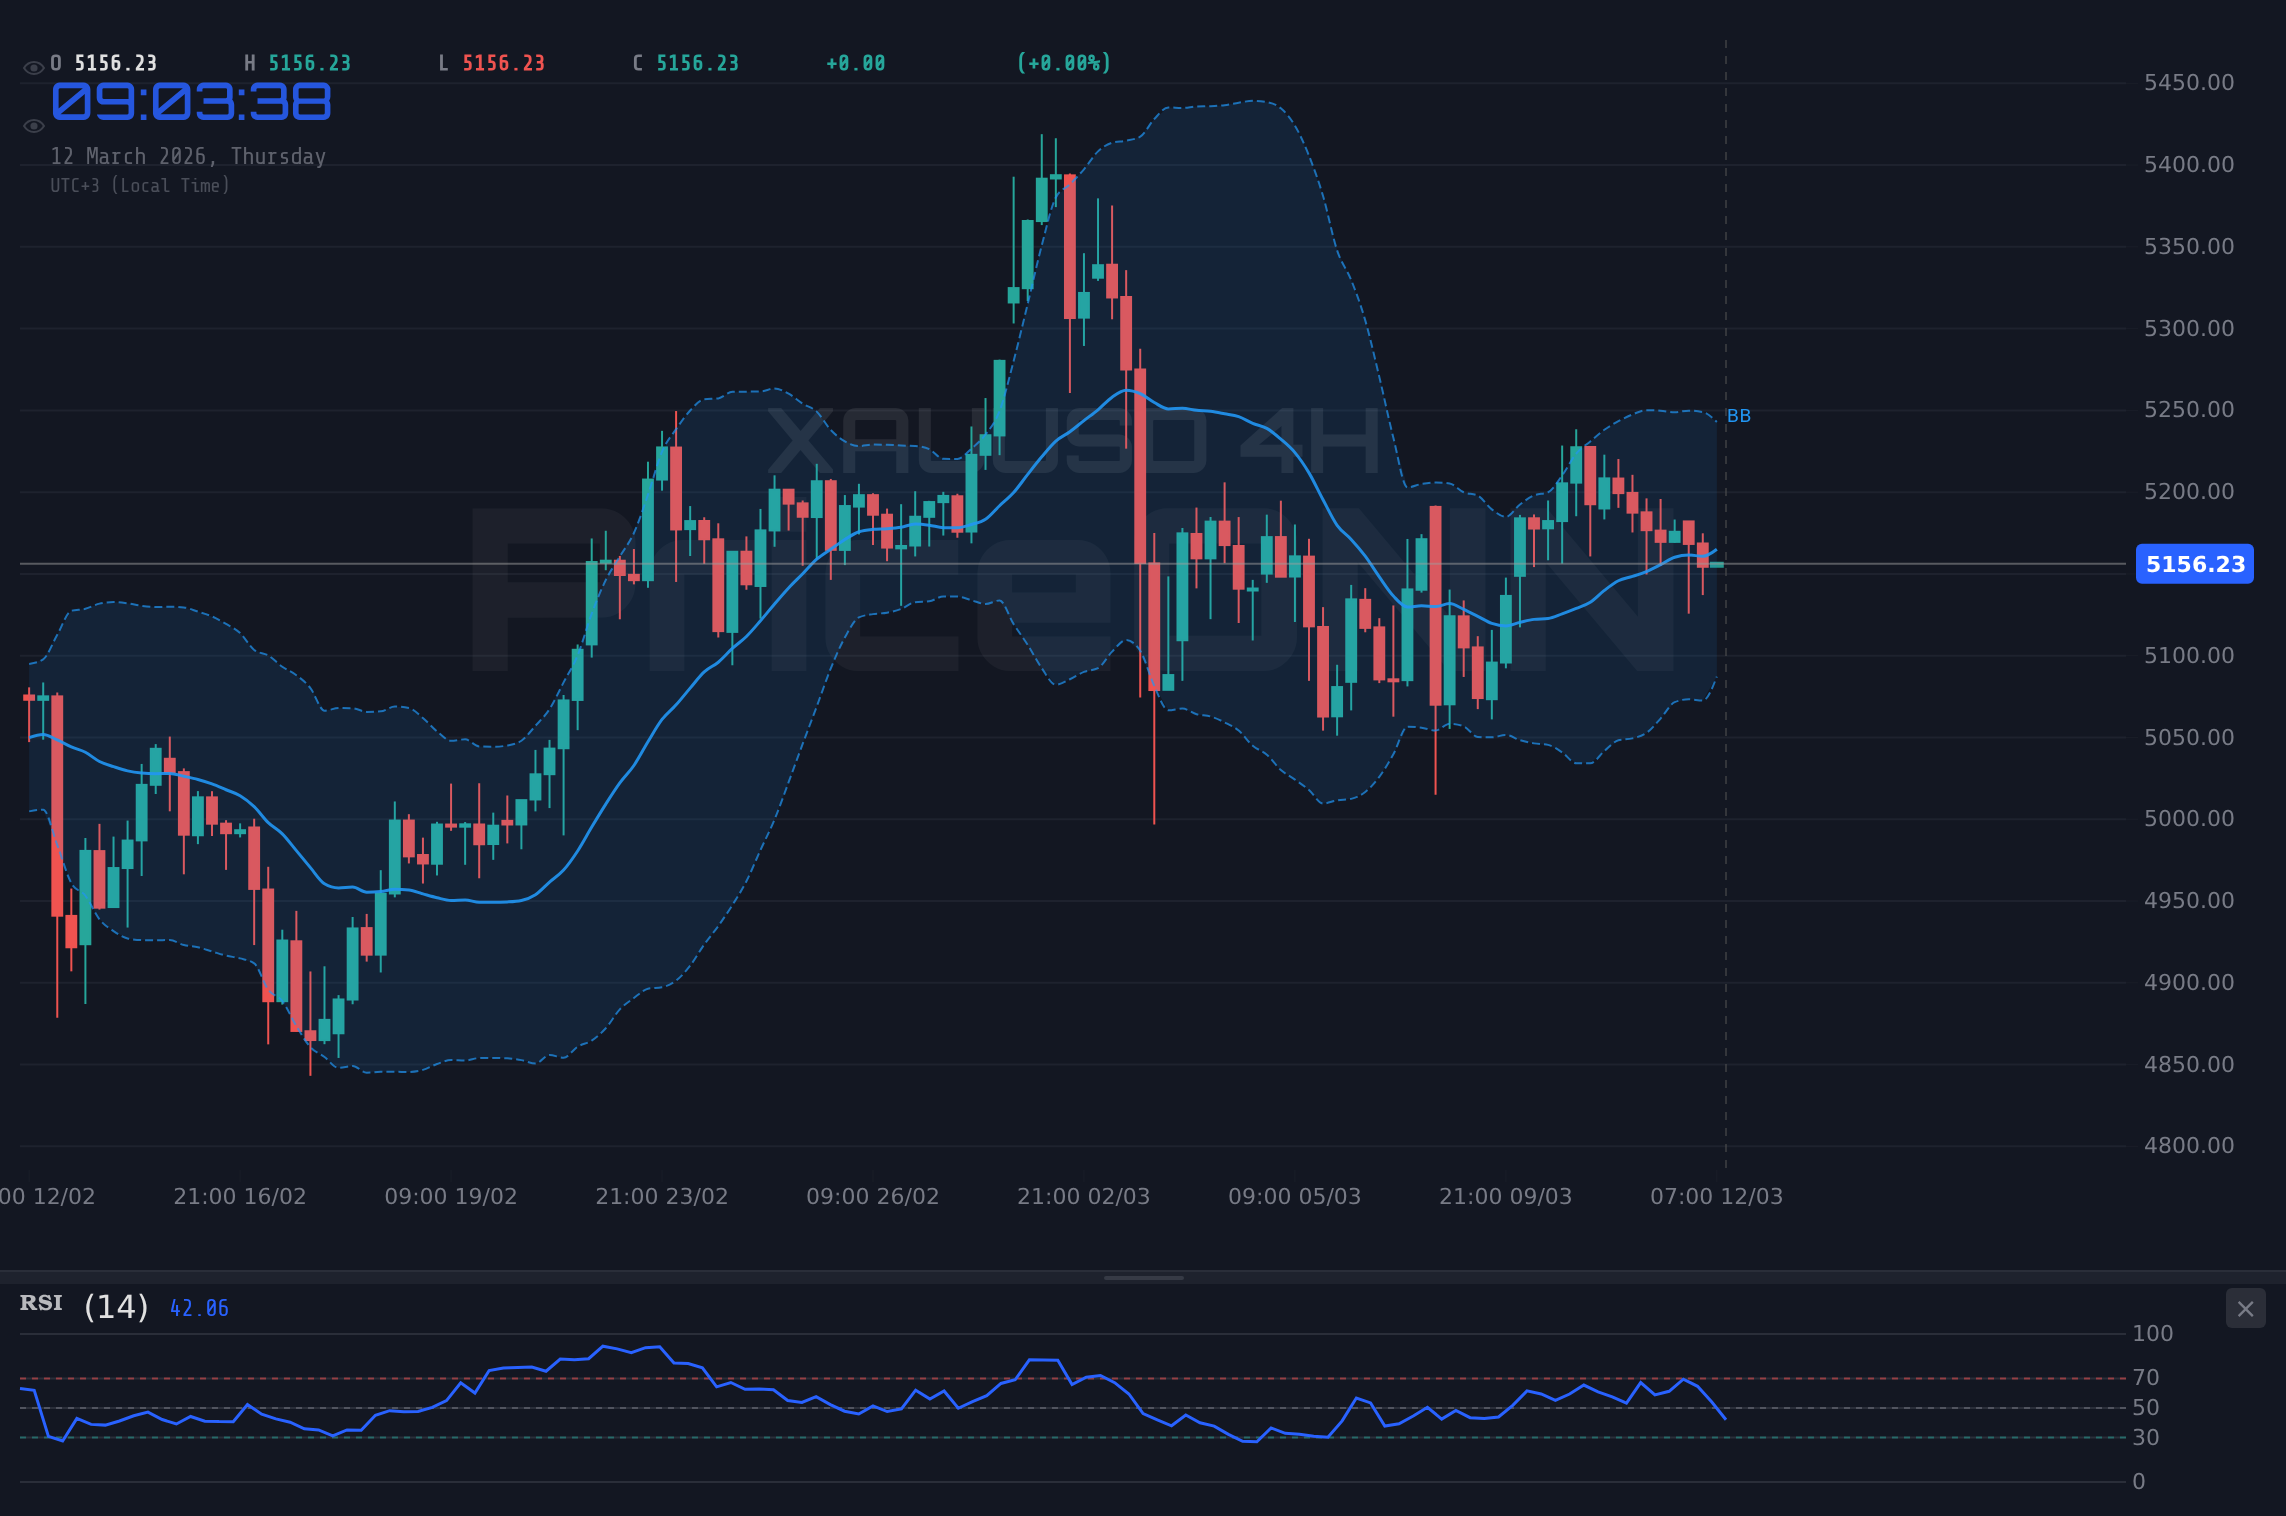
Gold (XAUUSD) is currently navigating a complex landscape, hovering near $5,156.36. The metal faces headwinds from a strengthening US dollar, as the DXY index shows a strong upward trend, currently trading around 99.24. This puts pressure on gold, which often moves inversely to the dollar. The key question is whether support at $5142.66 will hold, or if the bears will push the price lower. This level is critical to watch for potential reversals or further declines.
- RSI at 45.95 on the 1H timeframe suggests neutral momentum with a slight downward bias.
- Critical support level at $5142.66, which needs to hold to prevent further declines.
- The ADX on the 1H timeframe reads 33.25, indicating a strong downtrend that could challenge support.
- DXY strength is the primary driver behind the downward pressure on XAUUSD.
Looking at the technical indicators, the 1-hour chart paints a mixed picture. The RSI(14) currently sits at 45.95, indicating neutral momentum with a slight downward bias. This suggests that the bulls aren't entirely out of the picture, but they're not in control either. The MACD histogram shows negative momentum, further supporting the bearish sentiment in the short term. What's particularly noteworthy is the ADX reading of 33.25 on the 1H timeframe. This indicates a strong downtrend, suggesting that the current downward pressure could persist and potentially challenge the support level at $5142.66. However, the Stochastic indicator shows K=43.16 and D=42.58, signaling a potential upward move, adding a layer of complexity to the short-term outlook.
Stepping back to the 4-hour timeframe, a clearer bearish trend emerges. The trend strength is at 81%, indicating a high probability of continued downward movement. The RSI(14) at 48.19 mirrors the 1H chart, suggesting sustained neutral-to-bearish sentiment. The MACD remains in negative territory, confirming the bearish momentum. The Stochastic reading of K=32.41 and D=42 further solidifies this bearish outlook. The ADX at 22.3 indicates a moderate downtrend, suggesting the price could continue to drift lower if the DXY maintains its strength. The support levels to watch on this timeframe are 5135.32, 5102.29, and 5078.87. Resistance is seen at 5191.77, 5215.19, and 5248.22. A break above the first resistance would be needed to negate the current downward momentum.
On the daily chart, the trend is neutral, but the indicators suggest a potential shift. The RSI(14) is at 54.02, indicating a slight bullish bias, although the MACD remains negative. The Stochastic reading of K=42.19 and D=35.86 suggests a possible upward move. However, the ADX is low at 11.43, which points to a weak trend. The key levels to watch are the supports at 5142.66, 5109.56, and 5069.42 and the resistances at 5215.9, 5256.04, and 5289.14. The overall signal is neutral, suggesting that a breakout in either direction is possible.
From a broader market perspective, the rise in oil prices, with Brent Crude testing the $100 mark, is adding to inflationary pressures. As reported by Reuters, "geopolitical tensions are escalating in the Middle East, fueling supply fears and pushing oil prices higher." This situation can impact gold as a hedge against inflation, but the strength of the dollar is currently overshadowing this effect. The SP500 is also down by -0.72%, indicating a risk-off sentiment in the market. This could provide some support for gold as a safe-haven asset, but the stronger dollar is limiting this effect.
The economic calendar is also playing a role. On Monday, March 9th, we saw JPY data released. Looking ahead, the market is awaiting the release of GBP data on Friday, March 13th, which is expected to provide further insights into the UK economy. Any surprises in these data releases could trigger volatility in the respective currencies and impact gold prices. Traders should also monitor USD data releases on Friday, March 13th, as these could influence the dollar's strength and, consequently, gold prices.
Historically, XAUUSD has shown sensitivity to geopolitical events and economic data releases. For instance, during the 2022 energy crisis, heightened inflation fears and economic uncertainty drove gold prices higher, despite a relatively strong dollar. However, the current situation is unique, with the dollar strength acting as a dominant force. When RSI reaches levels around 45 on the 1H chart, it has often signaled a continuation of the prevailing trend, but the Stochastic indicator suggests a possible reversal. This creates a conflicting signal, and traders should exercise caution.
Given the mixed signals and the current market conditions, a cautious approach is warranted. Scalpers might look for short-term opportunities based on the Stochastic signal on the 1H chart, but the overall trend favors the downside. Swing traders should wait for a clearer signal, such as a break above the resistance at 5191.77 or a break below the support at 5142.66. Long-term investors should monitor the DXY and its impact on gold, as well as inflation data and geopolitical developments. Patient investors may find attractive entry points in the future, but the current market is too uncertain for aggressive positioning.
The correlation analysis reveals that the DXY is currently the most significant driver for XAUUSD. As the DXY rises, gold typically falls, and this relationship is evident today. The SP500's decline is providing some support for gold, but it's not enough to offset the dollar's strength. Bond yields are also rising, which is putting additional pressure on gold, as higher yields make bonds more attractive compared to non-yielding assets like gold. The rise in oil prices could eventually provide some support for gold if it leads to higher inflation expectations, but this effect is not yet apparent. Until the DXY shows signs of weakness, gold is likely to remain under pressure. With DXY at 99.24, XAUUSD is clearly under pressure.
If XAUUSD breaks above the resistance at 5150.63, it could target 5158.86 and potentially 5164.01. This scenario is contingent on a weakening dollar and a risk-off sentiment in the market. Probability: 30%
If XAUUSD breaks below the support at 5142.66, it could target 5137.25 and potentially 5132.1. This scenario is supported by a strengthening dollar and rising bond yields. Probability: 70%
Trade Plan
Given the overall bearish sentiment, a short position is favored, but only on a confirmed break below support.
- Entry Trigger: Short entry upon a confirmed break and close below 5142.66
- Target 1: 5137.25
- Target 2: 5132.1
- Stop/Invalidation: Stop-loss at 5150.63
Risk Warning: There is a high probability of USD volatility on Friday, March 13th due to the scheduled data releases.
Frequently Asked Questions: XAUUSD Analysis
What happens if XAUUSD breaks below $5142.66?
If XAUUSD breaks below the support level of $5142.66, it could trigger a further decline towards the next support levels at $5137.25 and $5132.1. This scenario is supported by the strong downtrend indicated by the ADX on the 1H timeframe.
Should I buy XAUUSD at current levels of $5,156.36 given the DXY strength?
Given the current strength of the DXY at 99.24, buying XAUUSD at $5,156.36 is risky. The inverse correlation between gold and the dollar suggests that gold prices are likely to decline further if the DXY continues to rise. It is prudent to wait for a clearer signal or a weakening dollar before considering a long position.
Is RSI at 45.95 on the 1H chart a sell signal for XAUUSD?
An RSI of 45.95 on the 1H chart indicates neutral momentum with a slight downward bias. While it's not a definitive sell signal on its own, it supports the bearish sentiment suggested by other indicators like the MACD and the ADX. Traders should look for confirmation from other indicators or a break below support before initiating a short position.
How will the USD data releases on Friday, March 13th affect XAUUSD this week?
The USD data releases on Friday, March 13th, could significantly impact XAUUSD. Stronger-than-expected data could further boost the dollar's strength, putting additional downward pressure on gold. Conversely, weaker-than-expected data could weaken the dollar and provide some relief for gold prices. Traders should closely monitor these releases and adjust their positions accordingly.
Technical Outlook Summary
| Indicator | Value | Signal |
|---|---|---|
| RSI (14) | 45.95 | Neutral |
| MACD Histogram | Negative | Bearish |
| Stochastic | K=43.16, D=42.58 | Bullish |
| ADX | 33.25 | Strong Downtrend |
| Bollinger | Middle Band | Watch |
Key Levels
Support Levels
Resistance Levels
Track markets in real-time
AI-powered analysis, technical indicators and real-time price data.
Join Our Telegram Channel
Breaking market news, AI analysis and trading signals instantly.
Join Channel