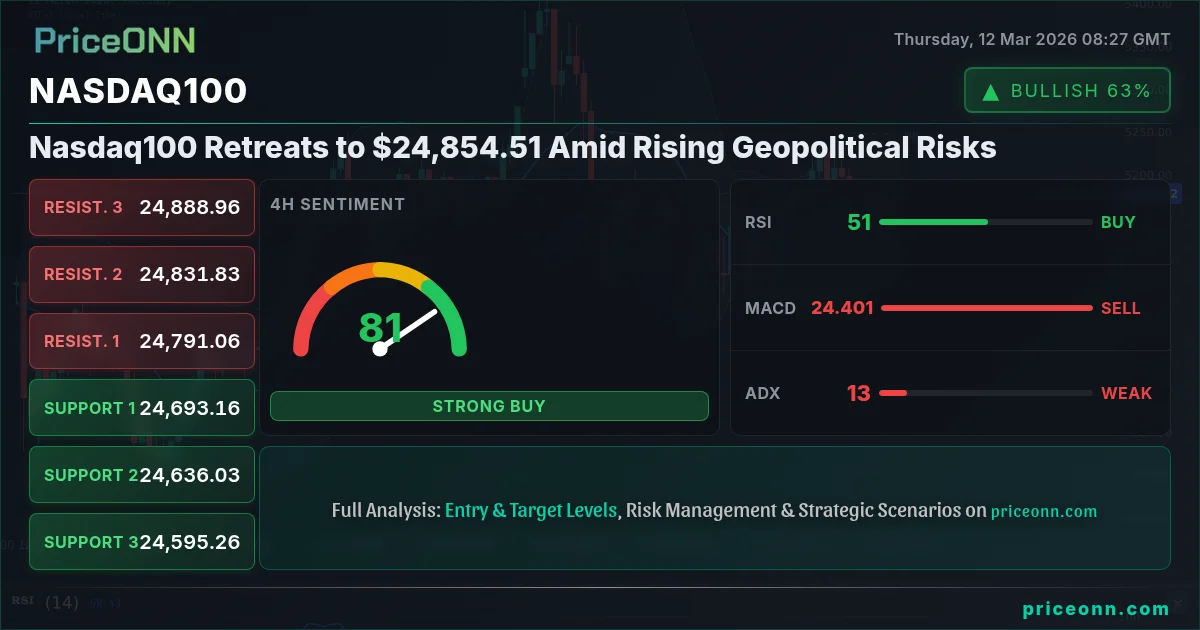
The Nasdaq 100 is trading near $24,854.51, feeling the heat as escalating geopolitical tensions in the Middle East send oil prices soaring, reigniting inflation fears and prompting investors to reassess risk. The recent surge in oil, as reported by multiple sources, has triggered concerns about supply chain disruptions and potential stagflation, weighing on equity markets.
- Nasdaq100 faces immediate resistance at 24,882.03, a level to watch for potential breakout attempts.
- Key support sits at 24,797.04, a breach of which could trigger further downside towards 24,672.1.
- The ADX reading of 29.02 on the daily chart indicates a strong downtrend, suggesting further weakness.
- Rising oil prices and their impact on inflation expectations are driving Nasdaq100's correlation with the DXY.
The surge in oil prices, with Brent crude eyeing $95 and WTI at $91.57, is not just about supply concerns; it's about the broader implications for inflation and interest rate policy. As oil prices soar, central banks face a difficult balancing act - combating inflation without stifling economic growth. This uncertainty is reflected in the Nasdaq 100's recent performance, with the index struggling to maintain upward momentum.
The technical picture for the Nasdaq 100 reveals a mixed bag of signals. On the 1-hour chart, the RSI is at 49.57, indicating neutral momentum with a slight downward bias. The MACD histogram is also negative, further reinforcing the short-term bearish outlook. However, the Stochastic is showing a bullish signal (%K > %D), suggesting a potential for a short-term bounce. The crucial point is the ADX, which sits at a weak 15.94, indicating a choppy market. This means that the current downtrend is not yet strong enough to confirm a sustained move lower.
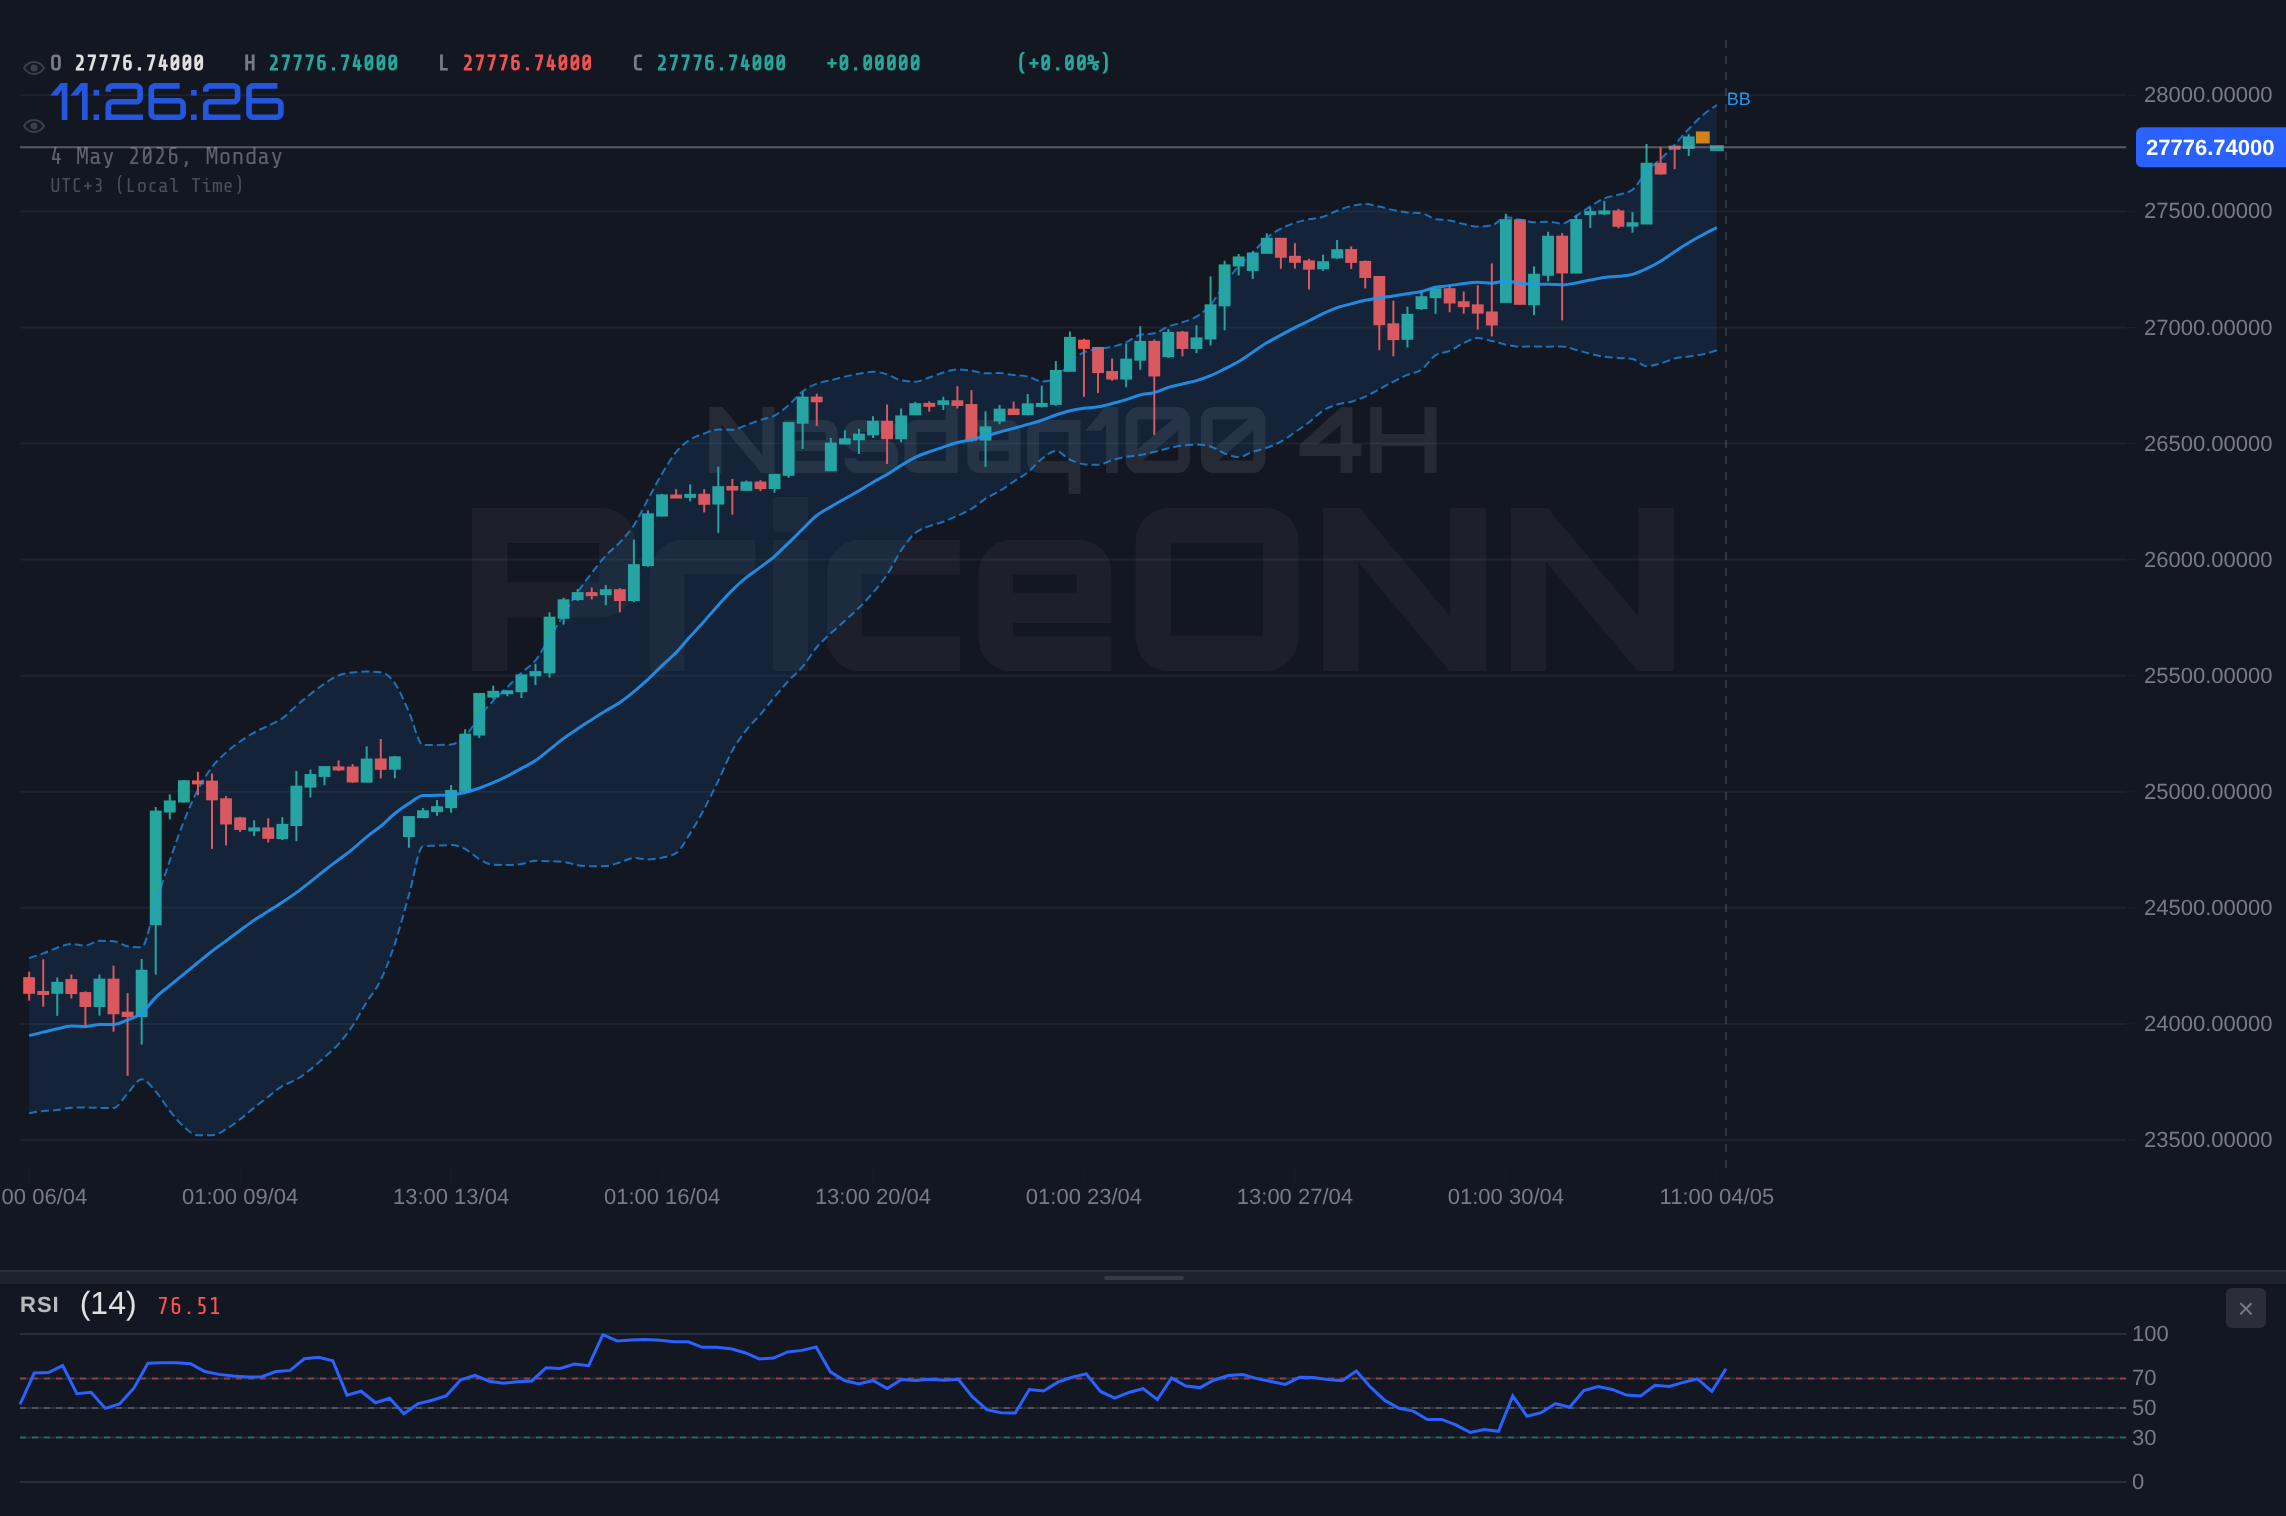
Looking at the 4-hour timeframe, the bearish bias becomes more pronounced. The RSI is at 49.76, and the MACD histogram is negative. The Stochastic is showing a bearish signal (%K
The daily chart provides a broader perspective on the Nasdaq 100's trend. The RSI is at 47.33, indicating that the index is not yet oversold. The MACD histogram is positive, but the ADX is at 29.02, signalling a strong downtrend. This suggests that the overall trend for the Nasdaq 100 is bearish, and any short-term bounces should be viewed with caution. Key support on the daily chart is at 24,797.04, followed by 24,672.1. Resistance is at 25,100.2.
Having tracked Nasdaq100 through the 2024 rate cycle, it is clear that the index is highly sensitive to changes in interest rate expectations. The strength of the dollar, as indicated by the DXY at 99.14, is also putting pressure on the Nasdaq 100. Historically, when the DXY rises above 99, the Nasdaq 100 has often experienced a period of weakness.
The recent comments from Federal Reserve officials, as reported by Reuters, have further dampened market sentiment. The Fed has indicated that it is prepared to raise interest rates further if inflation remains stubbornly high. This hawkish stance has led to a sell-off in risk assets, including the Nasdaq 100. The yield on the 10-year Treasury note is also rising, reflecting increased expectations for higher interest rates.
From a trader's perspective, the current market conditions warrant a cautious approach. Scalpers may look for short-term opportunities to fade rallies, while swing traders may consider establishing short positions on breaks of key support levels. Long-term investors may view the current correction as an opportunity to accumulate shares at lower prices, but they should be prepared for further volatility.
The upcoming economic data releases will be crucial in determining the near-term direction of the Nasdaq 100. On Friday, the market will be closely watching the release of the latest employment data, including the non-farm payrolls (NFP) and the unemployment rate. A strong jobs report could reinforce the Fed's hawkish stance and put further pressure on the Nasdaq 100. Conversely, a weak jobs report could lead to a rebound in risk assets.
The overall market sentiment towards the Nasdaq 100 remains cautious. The combination of rising oil prices, geopolitical tensions, and hawkish central bank policies is creating a challenging environment for equity markets. Until the NFP data resolves this, caution is warranted. The key level to watch is 24,797.04. A daily close below this level would open the door for a deeper correction.
Frequently Asked Questions: Nasdaq100 Analysis
What happens if Nasdaq100 breaks below $24,797.04 support?
If the Nasdaq100 breaks below the support level of $24,797.04, it could trigger further selling pressure, potentially leading to a test of the next support level at $24,672.1. This scenario would confirm the bearish trend and open the door for a deeper correction.
Should I short Nasdaq100 at current levels of $24,854.51 given the ADX reading?
Given the current ADX reading of 29.02, which indicates a strong downtrend, shorting the Nasdaq100 at current levels of $24,854.51 could be a viable strategy. However, it's crucial to wait for a confirmation signal, such as a break below the 24,797.04 support, before initiating a short position.
Is RSI at 47.33 a sell signal for Nasdaq100 right now?
While an RSI of 47.33 suggests that the Nasdaq100 is not yet oversold, it does indicate that the index is trending downwards. This, combined with other bearish signals, such as the negative MACD histogram and the strong ADX reading, reinforces the bearish outlook and strengthens the case for a potential sell-off.
How will the NFP data on Friday affect Nasdaq100 this week?
The upcoming NFP data release on Friday will be a key catalyst for the Nasdaq100 this week. A strong jobs report could reinforce the Fed's hawkish stance and put further downward pressure on the index, while a weak jobs report could lead to a rebound in risk assets.
Volatility creates opportunity- those prepared will be rewarded.
Track markets in real-time
AI-powered analysis, technical indicators and real-time price data.
Join Our Telegram Channel
Breaking market news, AI analysis and trading signals instantly.
Join Channel